How I Made a Fully Functional Arduino Weather Station
I live in Córdoba, Argentina, approximately 130 kilometers (~80 miles) away from the lake where I kitesurf. Thats roughly a two-hour drive, which I can deal with. But I can’t deal with the fact that weather forecasts are inaccurate. And where I live, good wind conditions last just a couple of hours. The last thing you want to do is clear up your Monday schedule to go kitesurfing and find yourself cursing the gods on a windless lake after two hours of driving.
I needed to know the wind conditions of my favorite kitesurfing spot—in real time. So I decided to build my own weather station.

Francisco is an engineer focused on cross-platform apps (Ionic/Cordova) and specialized in hardware-software technology integration.
Expertise
UPDATE: Work on our Arduino weather station continued after this article was published, culminating in the release of Open Weather Station (OWS). Check it out for additional updates, resources, along with code and new tutorials.
What is this all about?
Kitesurfing is one of the most addictive sports in the world. All it requires is a kiteboard, a body of water, and a few accessories. It’s a great way to get in touch with nature, free up your mind, and exercise. Plus, you can really go crazy with it.
So what’s the problem?
Oh, I forgot one essential requirement: wind. And that’s where we have our problem: you never know whether or not there will be wind unless you live right by your favorite kitesurfing spot.
I live in Córdoba, Argentina, approximately 130 kilometers (~80 miles) away from the lake where I kitesurf. That’s roughly a two-hour drive, which I can deal with. But I can’t deal with the fact that weather forecasts are inaccurate. And where I live, good wind conditions last just a couple of hours. The last thing you want to do is clear up your Monday schedule to go kitesurfing and find yourself cursing the gods on a windless lake after two hours of driving.
I needed to know the wind conditions of my favorite kitesurfing spot—in real time. So I decided to build my own weather station.
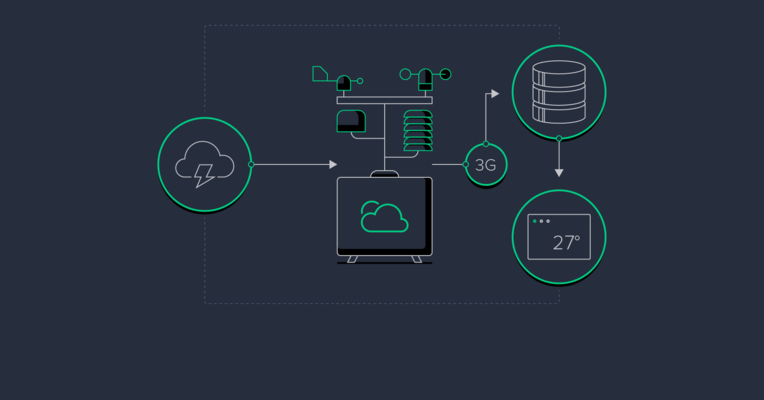
Measuring weather in real time—in a hostile environment
The goal was to deliver real-time weather data to the browser at home:

Before I get into the specifics, let’s take a moment to consider the key questions and caveats involved in a project like this:
- How can I create a weather station that it is neither valuable nor attractive to a thief?
- How can I keep hardware costs and development time to the minimum?
- How can I measure and access weather data in real time and display it in a useful way?
- Required measurements: wind and wind gusts, wind direction, rain, atmospheric pressure, temperature, humidity
- Connect station to Internet
- Store and retrieve local weather data
- Communicate between weather station and server
- How can I reduce maintenance to (almost) zero?
- Manage hanging of software
- Manage loss of connectivity
- Manage loss of energy supply
Say hello to my little friend!
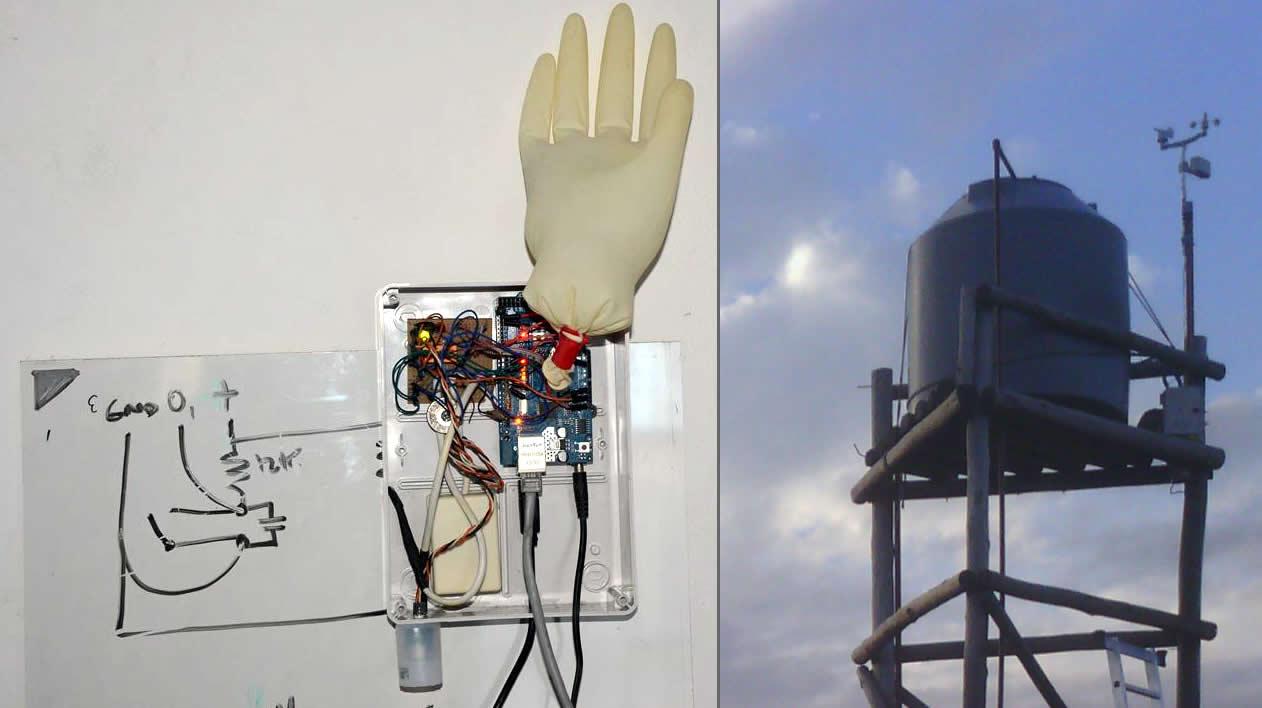
You may think that the glove is there to make the station appear friendlier; but it’s actually used to test the barometric sensor (the glove pressure increases inside the inflated glove). On the right, you can see the station in its final location, perched atop a nearby tower.
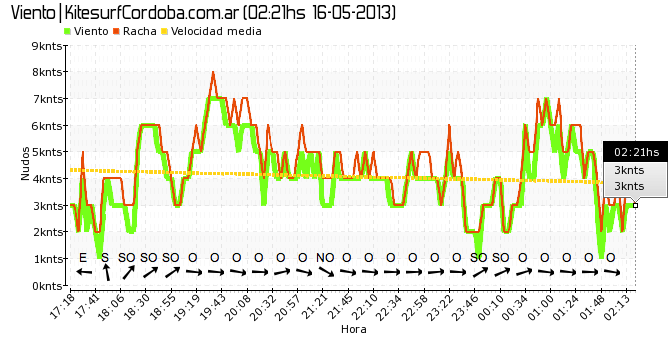
I also designed and programmed a website about kitesurfing, which includes a real-time plot of the station’s measurements to help out the kitesurfing community. Finally, I created a kitesurfing group on Facebook.
That’s awesome! So how did you do it?
Well, I’ll address each point in-turn:
“How can I create a weather station that it is neither valuable nor attractive to a thief?”
This was a critical factor and, in many ways, drove the rest of the design process. Most premade stations below the $2000 line required a USB connection to a computer. If a thief recognized that the station had a PC next to it, that would be the end of things, as the cost to replace the computer and the station would be above my personal budget. Therefore, I decided to test several hardware platforms to implement the station from scratch, at a lower cost.
“How can I keep hardware costs and development time to the minimum?”
I alone was supporting the costs of this side project and doing all the work in my spare time, so of course this was a big concern. I started with the popular PIC32 and some pre-assembled microchip Ethernet modules, but the costs were not as low as I had expected and there was far too much overhead involved in the hardware assembly and extension. Then, I started looking into the Arduino: an open source hardware and software for electronics prototyping using C language. This was exactly what I wanted, and I could purchase modules on DealeXtreme. I was able to start playing around with just $15 of expenditures and two days of my time.
Of course, the Arduino also has its limitations: only 2KBytes of RAM and 32Kbytes for my compiled software—that doesn’t leave much room for fancy strings or useless variables 1.
“How can I measure and access weather data in real time and display it in a useful way?”
Currently, my station can measure: wind speed, wind gust, wind direction, temperature, humidity, rain, and atmospheric pressure. Temperature, humidity, and pressure are handled by a couple of libraries, which made life a lot easier.
Measuring wind speed and rain was a little bit messy. The sensors operated by opening and closing a switch (reed switch). Thus, I needed to implement hardware interrupts in order to catch the sensor as soon as it triggers the input. That is, I needed to call some method:
attachInterrupt(RAINGAUGE_PIN, countRainCycles, FALLING);
This interrupt would break normal code execution and call the countAnemometerCycles or countRainCycles function as soon as the switch experiences a falling edge, produced by closing or opening the circuit. A few variables are incremented on each trigger of the switch. (Later, you weigh these variables to account for unit conversions.)
void countRainCycles() {
    rainCyclesCounter++; // This is easy! And it actually works.
}
But not so fast! This process generates hundreds of false triggers as a result of the switch bouncing effect inherent to any hardware switch. Fortunately, there are both hardware and software solutions to this problem.
About the bouncing effect
The bouncing effect occurs as a consequence of the switch physically opening or closing its ‘contacts’, which establish contact with the rest of the circuit. When the contacts start to separate (opening the switch) or unite (closing the switch), some small electric arcs may be generated, as well as a mechanical elasticity in the circuit that will trigger the circuit on and off for a couple of milliseconds. When you flip a light switch, this effect isn’t apparent; but when you attach an interrupt to the falling edge of a signal, this bouncing effect triggers a ton of interrupts. More here.

I implemented both a hardware debounce circuit and a similar version in software. But how exactly do you implement a software debounce? Easy! After the first expected trigger occurs, “wait” enough time for the bounce to settle before you start listening for new interrupts. This can be accomplished in a couple of lines of C:
void countRainCycles() {
    if (nextTimeRainIterrupt == 0 || nextTimeRainIterrupt < millis()) {
        rainCyclesCounter++; // The interrupts counter
        nextTimeRainIterrupt = millis() + 100; // Wait 100msecs before next trigger
    }
}
The millis() function returns the current execution time in milliseconds since the Arduino was turned on. It’s also worth noting that these variables must be defined as volatile to instruct the compiler not to optimize the execution and therefore avoid inaccurate values during the hardware interrupts.
Somehow, I needed the station to store the accumulated data and periodically send these measurements to a MySQL database. So I added an Ethernet module with an SD slot to log the values and retrieve them whenever a user (the server) connects to the station. During testing at home with ADSL connectivity this worked amazingly well—but I almost lost my hair when I tested this “in the field” with 3G Internet (using a 3G modem), as the station would randomly reset itself when I tried to retrieve the measurements! After significant testing, I finally found that the examples provided all over Internet that describe “serving” data to a connected client didn’t consider that the connection might be so poor that connection to the client could be lost mid-packet transmission, causing the output buffer would overflow. But why would a dropped connection cause a buffer overflow? Well, say that the transmission session starts and the station begins to fill up the output buffer with data. Ideally, the client then consumes this buffer faster than it gets filled. However, when connecting with a 3G modem, this wasn’t the case! The connection to the client was far too poor, so the buffer filled up faster than it was consumed, which caused both a buffer overflow and a sudden reboot of the station.
To address the issue, I needed to add a function to the Ethernet Library provided with the Arduino that went something like this:
int EthernetClient::free() {
    if (_sock != MAX_SOCK_NUM)
        return W5100.getTXFreeSize(_sock);
   return 0;
}
Then, I was able to check if the client had some space in the buffer before trying to fill it up with more data:
while (file.available() > 0) {
    if (client.free() > 0) { // This was key to solving the issue
        c = file.read();
        client.print((char)c);
    } else { // No free buffer? Ok, I'll wait a couple of millis...
        delay(50);
    }
}
file.close();
By the way, if you’re interested in programming an Arduino, here’s a great guide.
Another interesting task was the implementation of a LIFO log. Why was this necessary? Well, typically, when I save measurements to a given file, the approach is simple: open the file, append the new samples to the end, and close the file. But say I want to fetch the latest 1000 measurements, sorted chronologically. Those measurements are at the end of the file; so I should open the file, move the cursor to the end, output the latest measurements, then get the file cursor back to the previous measurement and output that by seeking a sample delimiter to detect where to start and stop. The Arduino has neither enough RAM nor processor power to execute this process quickly, so I needed another approach. Instead, I decided to output the file in reverse order to the server, and then revert the string literals back on the server side:
unsigned long filePosition = file.size();
file.seek(filePosition);

while (filePosition >= 0) {
    if (client.free() > 0){
        file.seek(filePosition);
        c = file.peek();
        if (c != -1) {
            client.print((char)c);
        }
        if (filePosition <= 0) {
            break;
        }
        filePosition--;
    }
}
With any experience as a PHP developer, it’s easy to get the latest samples with the characters in the correct order:
// $output has the reversed string measures, each sample is delimited by ;
$rows = split(";", trim($output));
array_walk_recursive($rows, 'reverseString');
if (strlen($rows[0]) == 0) {
    array_shift($rows); // Remove the first line if empty
}

function reverseString(&$row, $key) {
    $row = trim(strrev($row));
}
// $rows is now the array of the latest samples :)
On the server side, I then setup a cron process to fetch the latest measurements every two minutes and insert the data into a MySQL engine. To display the data, I created www.kitesurfcordoba.com.ar and used jQuery to auto-update the graphs (which are themselves generated using pChart v2.0, a great open-source library).
There were a bunch of other tricks necessary to get things working, related to both software and hardware engineering, but I’ve dragged on long enough—so lets talk about minimizing maintenance.
“How can I reduce maintenance to (almost) zero?”
This was a major concern because it’s certainly not easy for me to reach the station—if I were willing to drive two hours away just to fix a minor malfunction, then I wouldn’t have had to make her in in the first place (I didn’t mention this before, but after all we have been through, the station is actually a “she”, and her name is Dorothy).
So what kinds of errors are we talking about here? Well, for example: the software might hang, the network might lose connectivity, the energy supply might fail (and it does), etc.
Essentially, the station needs to perform as much self-recovery as possible. That’s why I utilized both soft and hard watchdogs. For those who are unfamiliar, a watchdog is a piece of software or hardware that checks if a system is operating correctly and, if not, attempts to bring it back to life. The Arduino has an embedded watchdog you can use. I set it to wait for 8 seconds: if a call takes longer than that time limit, the software watchdog will reset the board.
wdt_enable(WDTO_8S); // "wdt" stands for "watchdog timer"
I love this function. However, there are times when the board resets and the Ethernet module doesn’t. Why? Well, this is a relatively affordable prototyping board, not a highly expensive, fail-proof device (you certainly shouldn’t build a pacemaker with it). To overcome this drawback, I had to hack the Arduino by cross-wiring a hardware-reset input to a digital output on the board itself. In order to avoid a reset loop, a couple of lines of code must be added too:
void setup() {
    digitalWrite(RESET_ARDUINO_PIN, HIGH); // Set it to HIGH immediately on boot
    pinMode(RESET_ARDUINO_PIN, OUTPUT);    // We declare it an output ONLY AFTER it's HIGH
    digitalWrite(RESET_ARDUINO_PIN, HIGH); // Default to HIGH, set to LOW to HARD RESET
    ...
After that, I was able to issue a hardware reset to the Arduino and all the modules on top of it (including the Ethernet module) by simply calling digitalWrite(RESET_ARDUINO_PIN, LOW), which brought Dorothy back to life after a couple of seconds.
Additionally, the board auto-reboots after an energy loss. And if Internet connectivity fails, we exploit the SD card’s storage capabilities (data can be stored on the card for over a week, and the server can pull in old data to recover any missing samples). Combining all these features gives us a highly robust weather station that can survive the hostile conditions it was built to monitor. In total, this thing cost me just about $300.

And in the end
The station has been working since December 2012. To-date, it has not failed (or if it did, the station recovered fast enough that the kitesurfing community and I didn’t notice). There are roughly 500 kitesurfers who check the weather station regularly before travelling to the spot. So aside from reward of solving some tough technical challenges, I’ve also had the opportunity to provide a bunch people with a more enjoyable kitesurfing experience.
1 Initially, I was using an Arduino Uno. Later on, I switched to an Arduino Mega due to the need for increased RAM and flash memory.
Further Reading on the Toptal Blog:
Córdoba, Cordoba, Argentina
Member since November 19, 2012
About the author
Francisco is an engineer focused on cross-platform apps (Ionic/Cordova) and specialized in hardware-software technology integration.