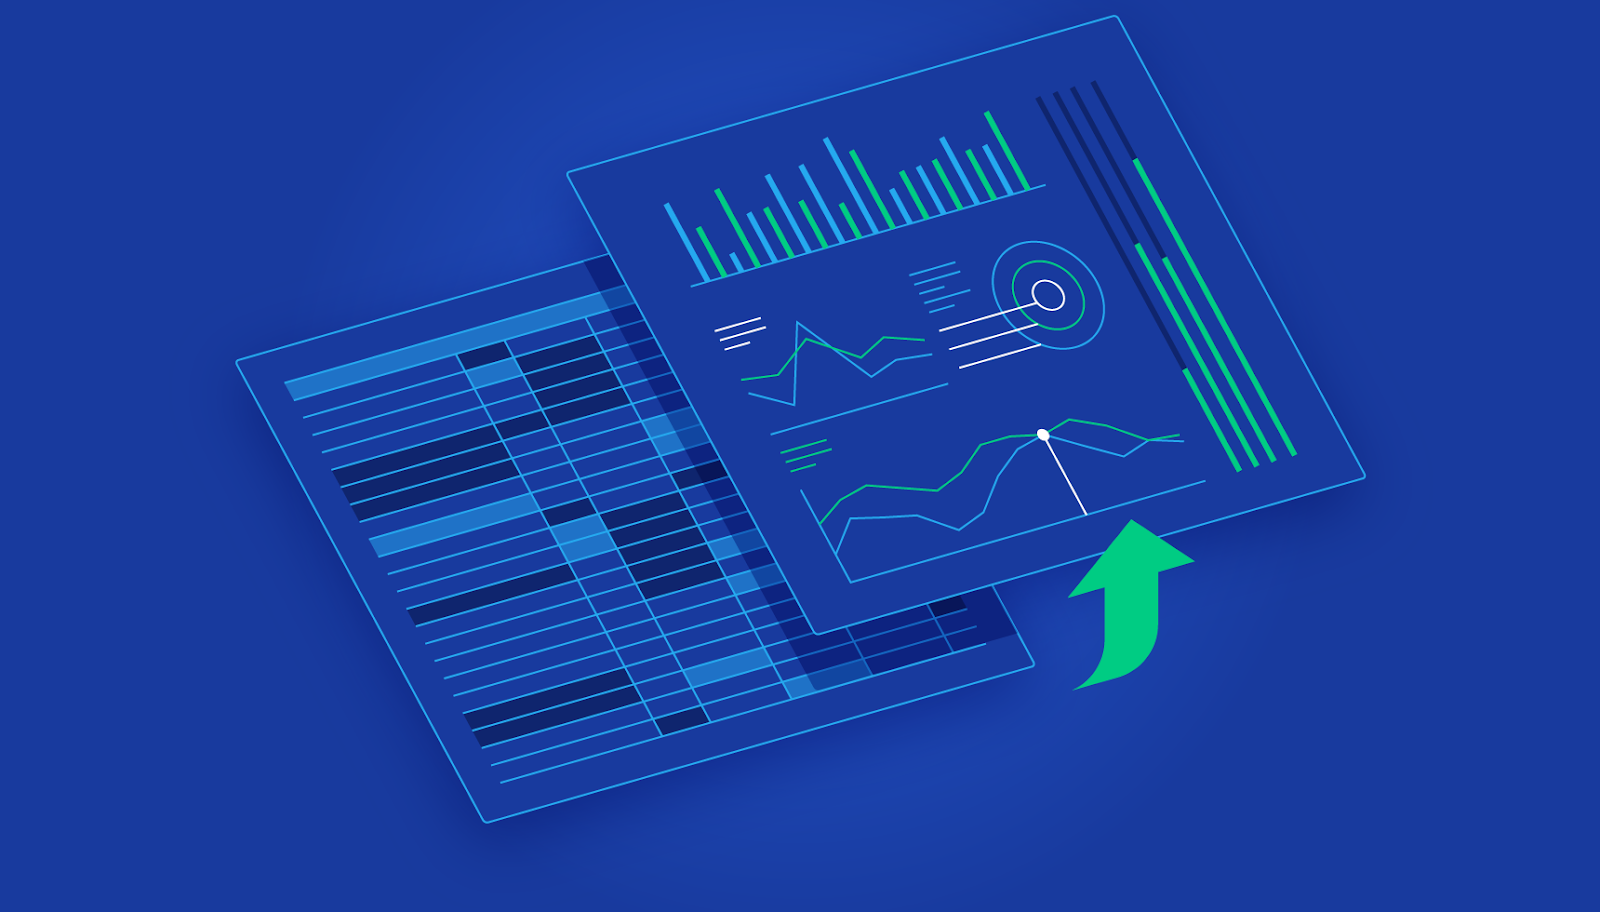
A Complete Overview of the Best Data Visualization Tools
When dealing with data sets that include hundreds of thousands or millions of data points, automating the process of data visualization makes a designer’s job significantly easier.
14 minute readContinue Reading

Cameron Chapman
Data Visualization: Best Practices and Foundations
Data visualization is a coherent way to visually communicate quantitative content. Depending on its attributes, data may be represented in different ways, such as line graphs and scatter plots.
7 minute readContinue Reading

Mayra Magalhaes Gomes
World-class articles, delivered weekly.
Toptal Designers
- Adobe Creative Suite Experts
- Agile Designers
- AI Designers
- Art Direction Experts
- Augmented Reality Designers
- Axure Experts
- Brand Designers
- Creative Directors
- Dashboard Designers
- Digital Product Designers
- E-commerce Website Designers
- Full-Stack Designers
- Information Architecture Experts
- Interactive Designers
- Mobile App Designers
- Mockup Designers
- Presentation Designers
- Prototype Designers
- SaaS Designers
- Sketch Experts
- Squarespace Designers
- User Flow Designers
- User Research Designers
- Virtual Reality Designers
- Visual Designers
- Wireframing Experts
- View More Freelance Designers
Join the Toptal® community.

