Dashboard Design: Considerations and Best Practices
Dashboards are a unique and powerful way to present data-based intelligence using data visualization techniques. This post looks at the fundamental dashboard design principles that lie at the heart of every successful dashboard.

Dashboards are a unique and powerful way to present data-based intelligence using data visualization techniques. This post looks at the fundamental dashboard design principles that lie at the heart of every successful dashboard.

Stelian is a UI designer with over seven years of experience in designing and building projects of different scales from the ground up.
Listen to the audio version of this article
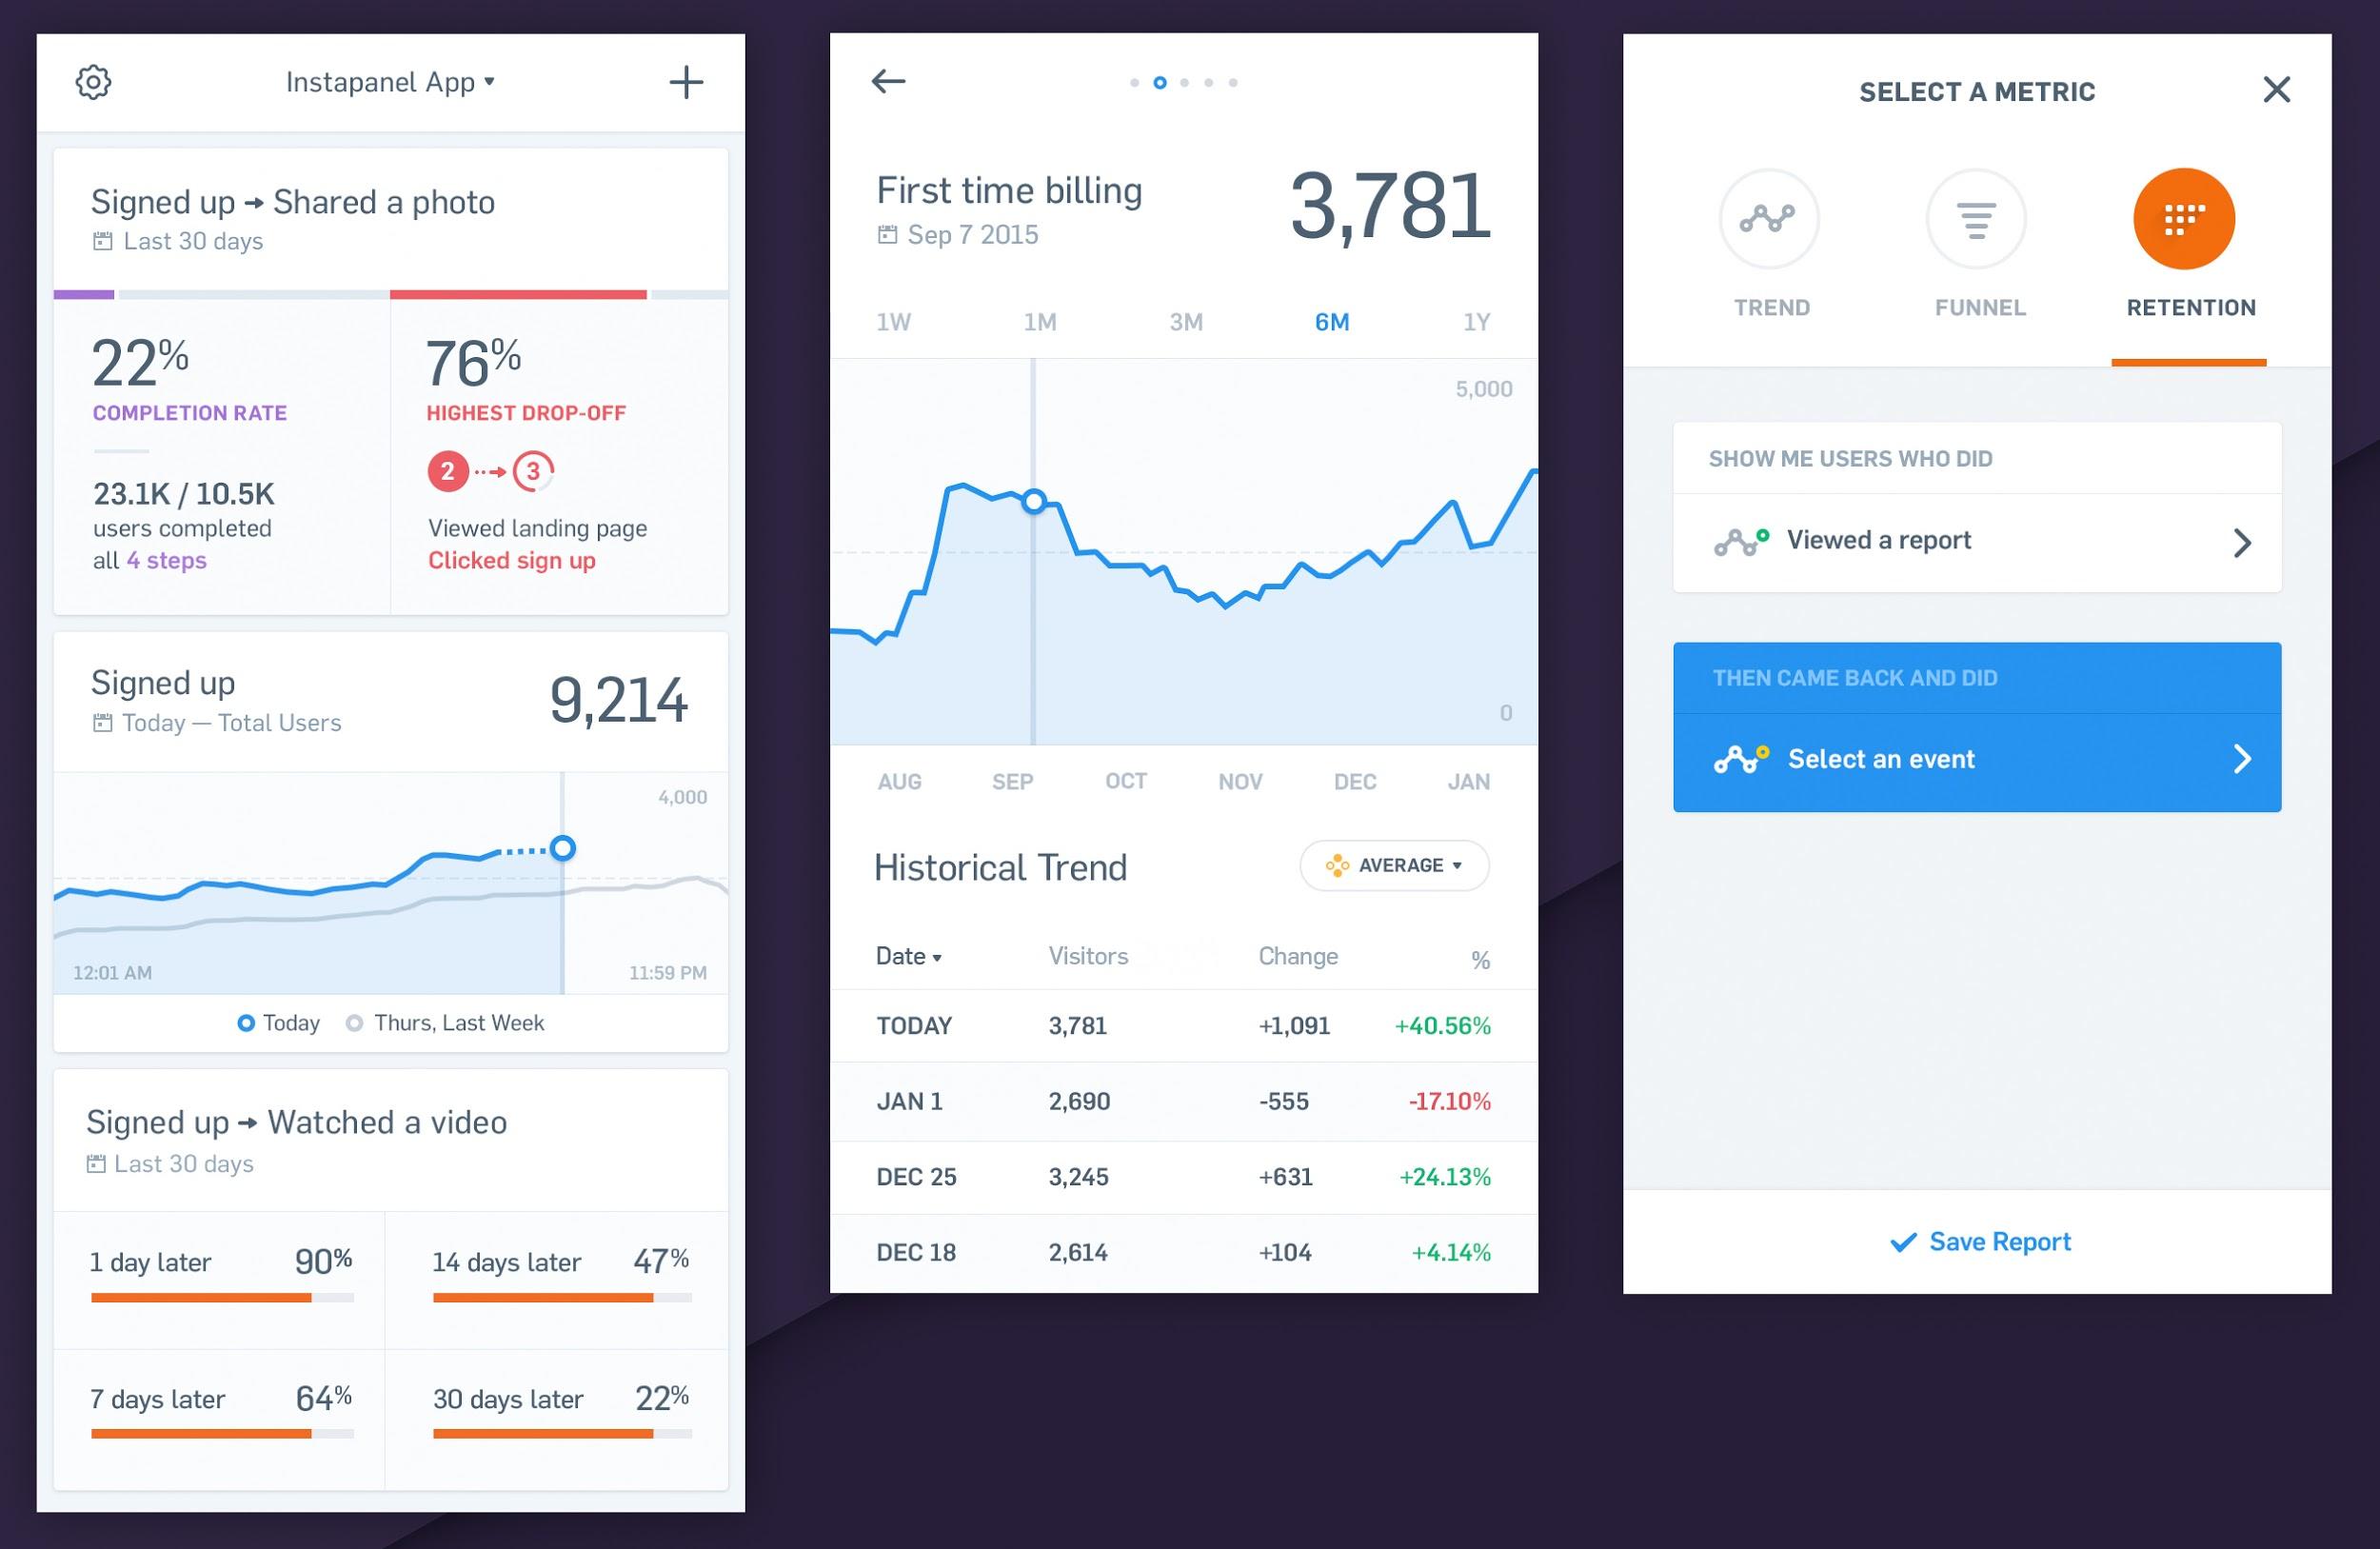
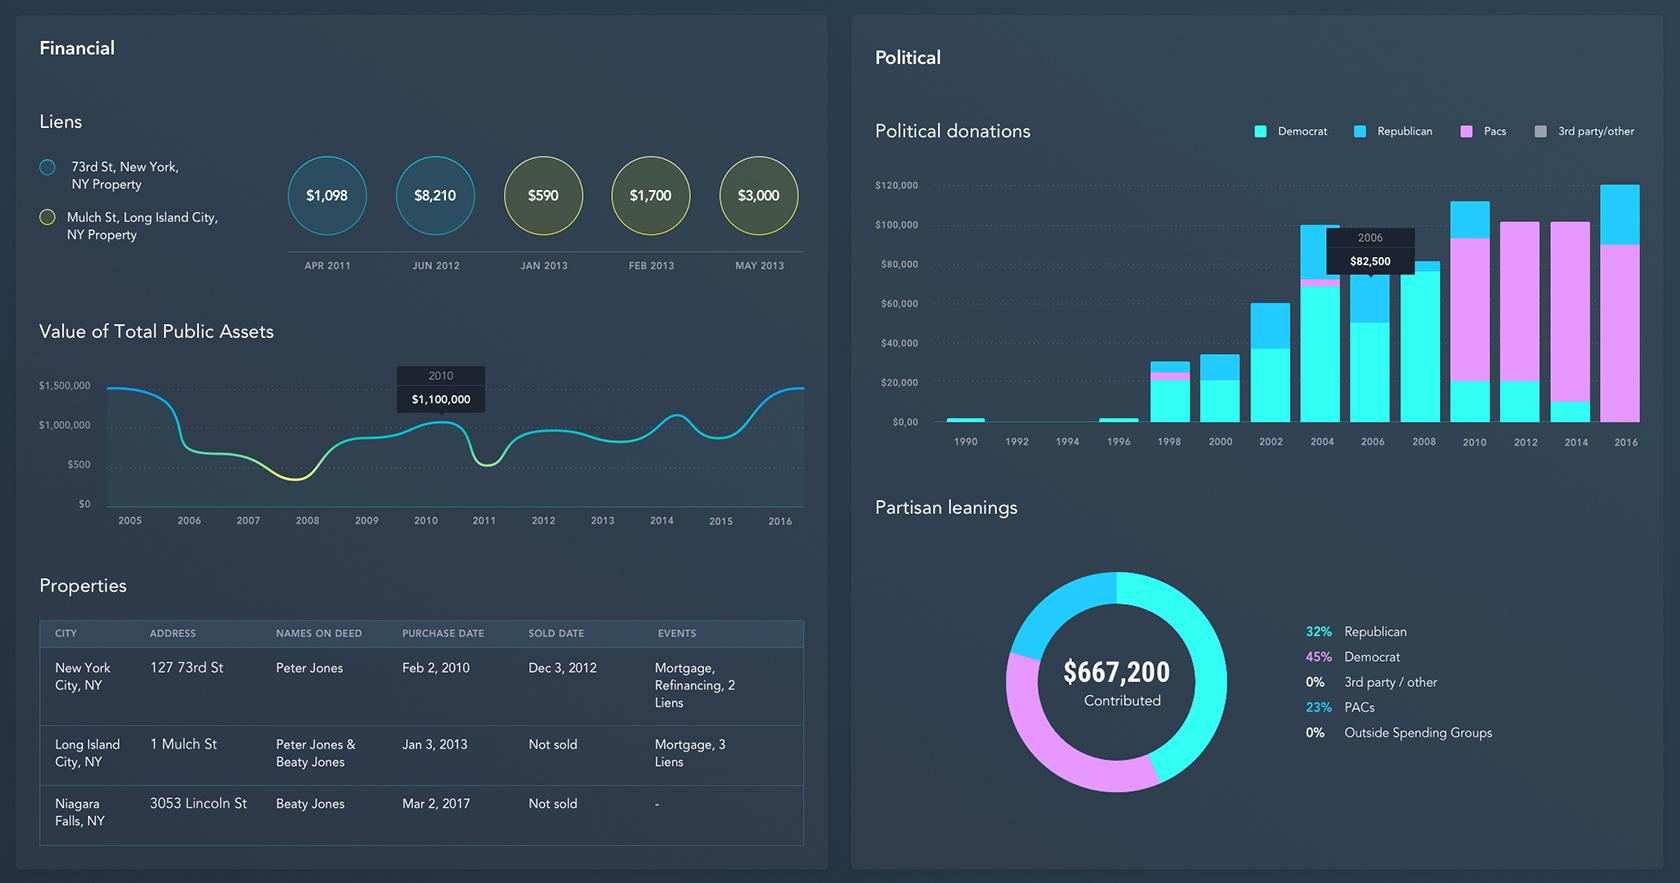
Dashboards are a unique and powerful way to present data-based intelligence using data visualization techniques that display relevant, actionable data as well as track stats and key performance indicators (KPIs). The dashboard layout should be designed to present this data in a quick, easy-to-scan format with the most relevant information understandable at a glance.
The term was born from the traditional automobile dashboard, and they have evolved to serve the same function in the digital world. In his book, Stephen Few put it best:
A dashboard is a visual display of the most important information needed to achieve one or more objectives; consolidated and arranged on a single screen so the information can be monitored at a glance.
In this article, we outline strategic, analytical, operational, and informational examples as well as the fundamental principles that lie at the heart of the best dashboard design, regardless of its type.
Having the right approach to data visualization is a key feature in laying the foundation for designing dashboards. Data visualization is the presentation of data via graphics and pictures—its primary objective is to help decision makers identify patterns or understand difficult concepts that may go undetected in text-based applications.
In their book, Data Visualization, Noah Iliinsky and Julie Steele state:
The designer’s purpose in designing a data visualization is to create a deliverable that will be well received and easily understood by the reader. All design choices and particular implementations must serve this purpose.
Key Characteristics of Great Dashboards
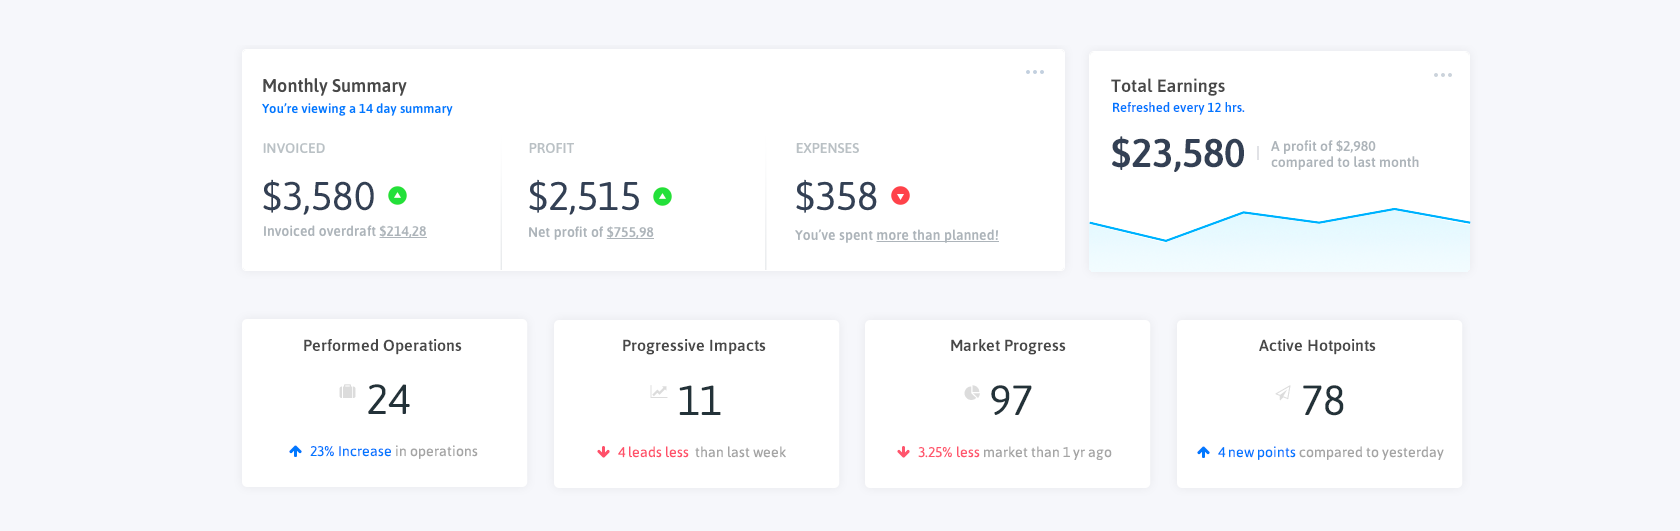
An effective dashboard shows actionable and useful information at a glance. It simplifies the visual representation of complex data and helps stakeholders understand, analyze, and present key insights.
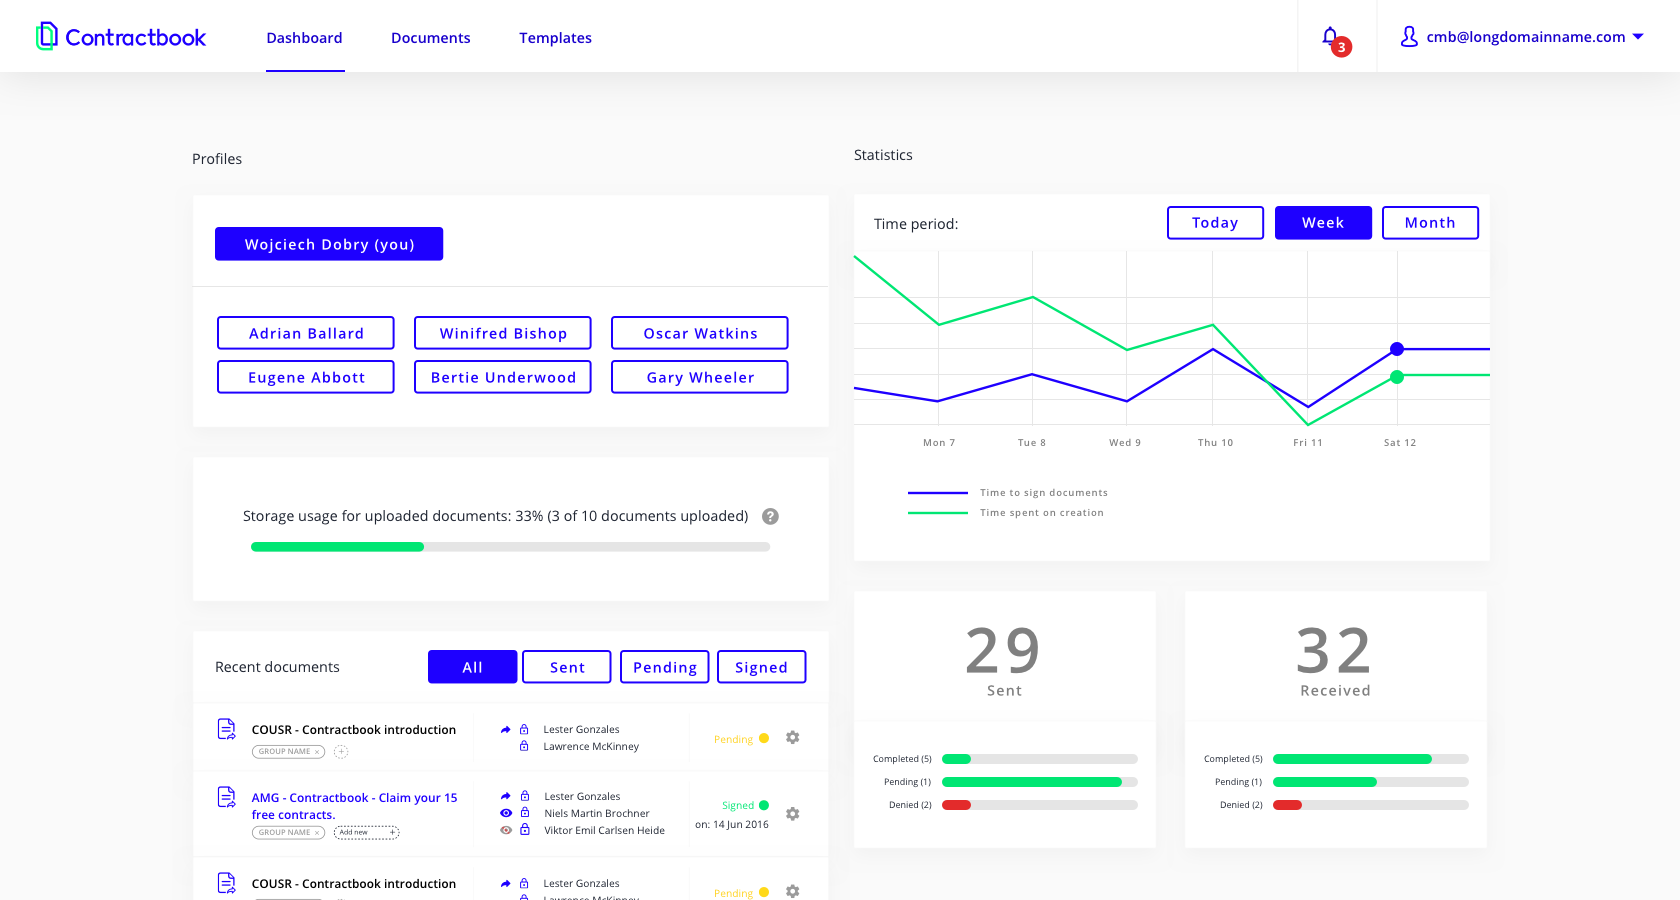
Great dashboards are clear, intuitive, and customizable.
- They communicate information quickly.
- They display information clearly and efficiently.
- They show trends and changes in data over time.
- They are easily customizable.
- The most important widgets and data components are effectively presented in a limited space.
An initial customization of visual data and information to key user requirements will help improve usability and eliminate the need for different user personas.
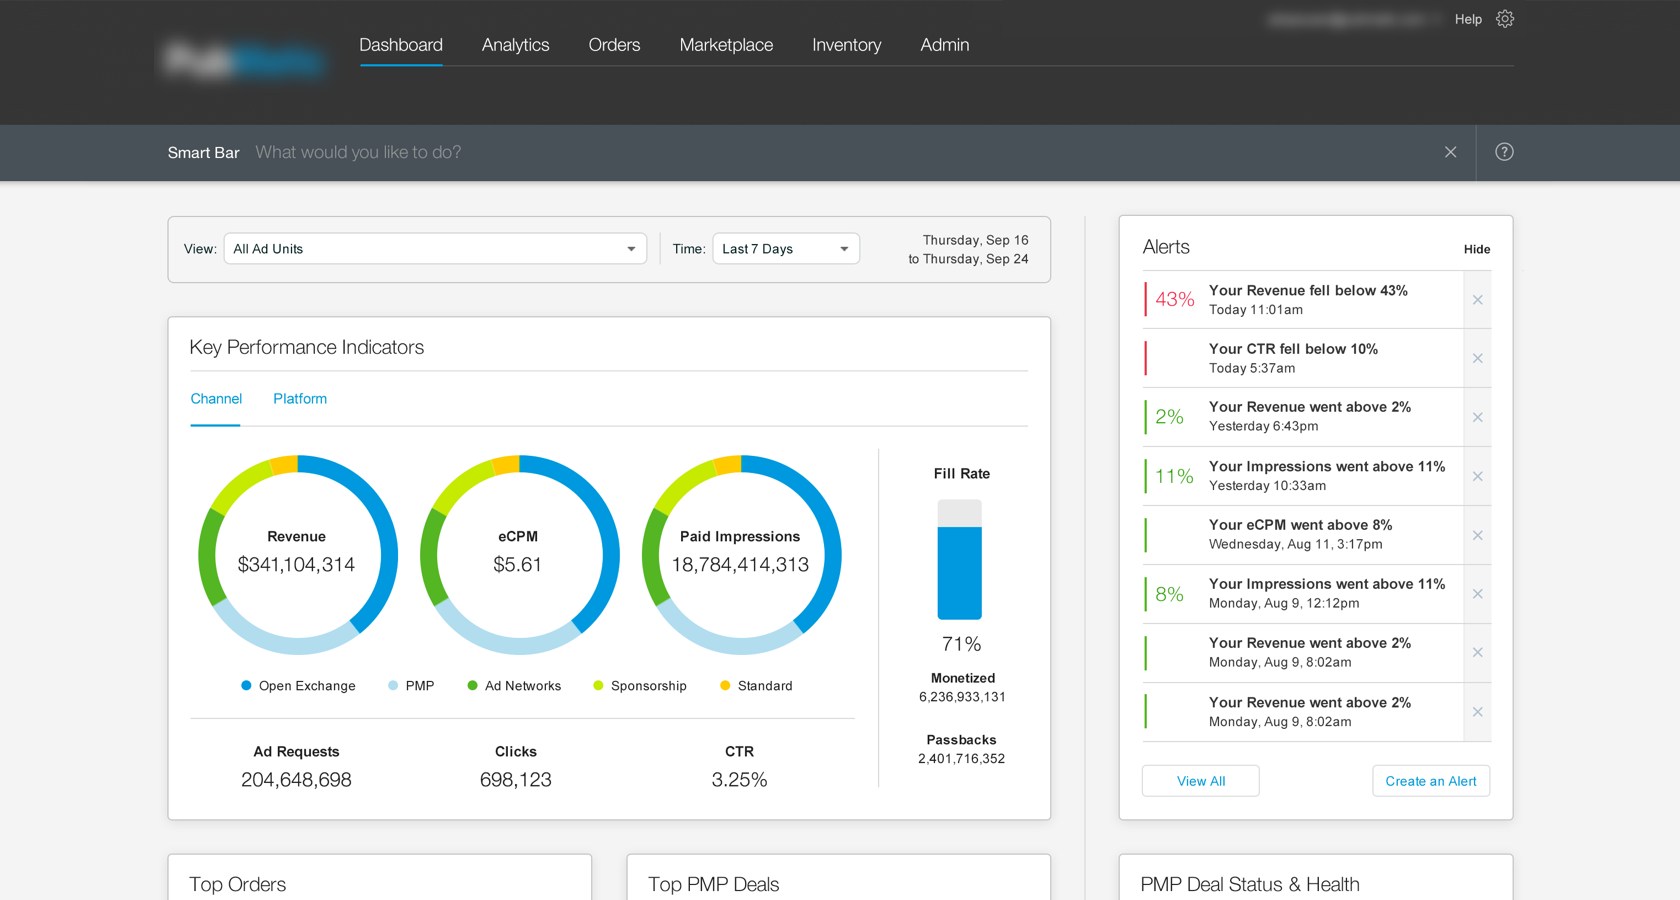
Great dashboards provide everything one click away.
- All essential information is immediately accessible.
- Data is prioritized.
- Information is displayed clearly in a visual hierarchy on one screen.
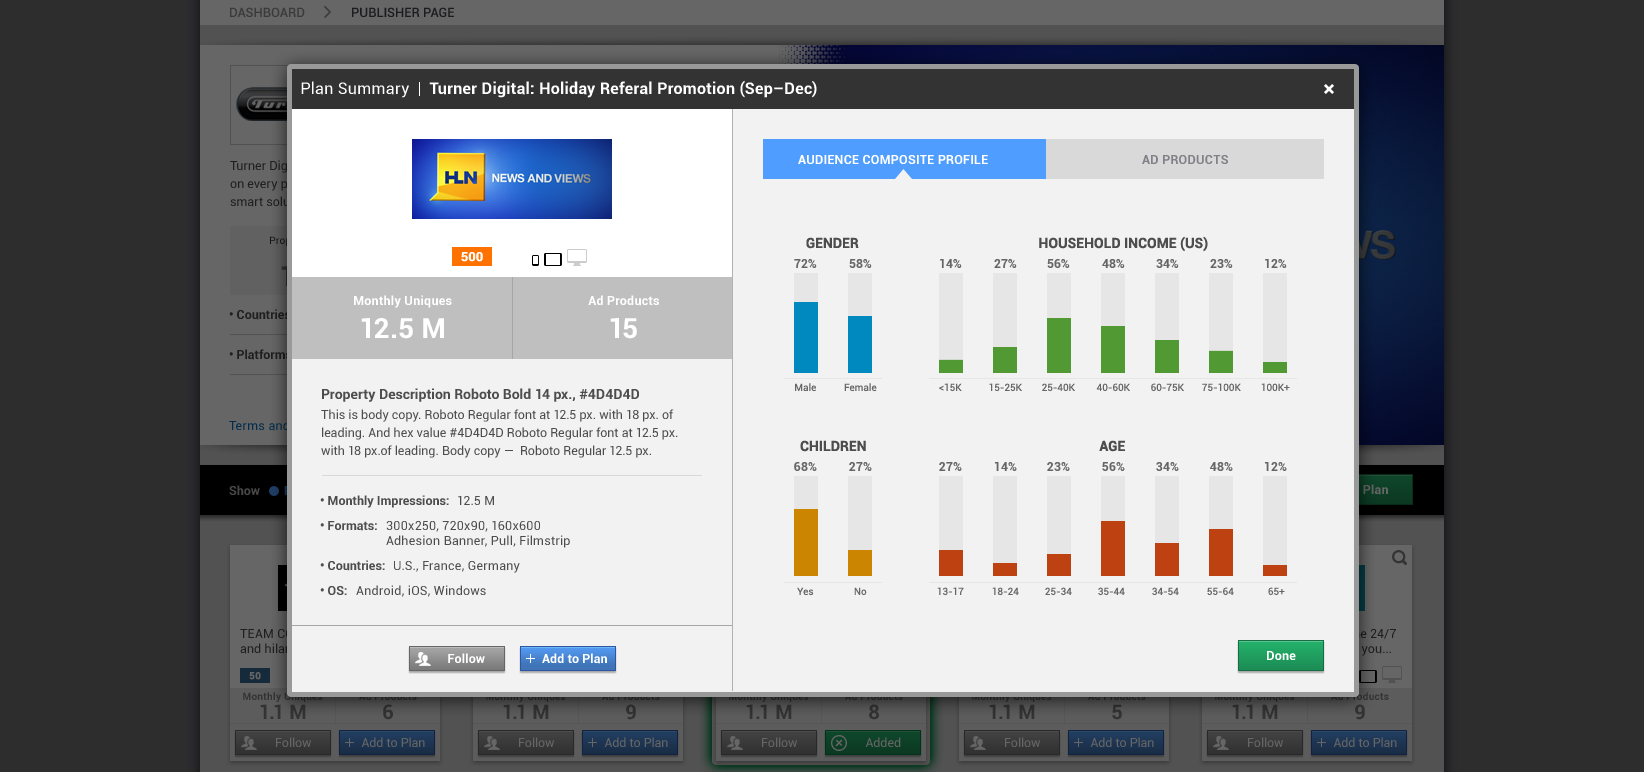
- The design provides a coherent overview that includes sparse, clear initial data with additional opportunities to drill down for more.
- Elements (chart, table, form) are displayed in a minimized view with the ability to bring up more details in a modal window or go to a page with more detail.
- The design improves usability with filters allowing users to customize how data is displayed and filters content using labels, categories, and KPIs.
Reduced Complexity Provides Clarity
In a world overwhelmed with data, providing clear information is one of the most difficult things to accomplish. Presenting only the most relevant data on dashboards is essential—the more information we display, the harder it is for users to find what they need.
When faced with too much data to select from, designers should display only the most relevant subset. We need to prioritize and carefully remove misleading and unclear metrics.
Effective dashboard design decisions should be guided by:
- the project goals
- the nature of the data
- the needs of users
When reading a visualization (or any other kind of communication), your reader has a limited amount of brainpower to dedicate to the problem. Some of this brainpower will be dedicated to decoding the visualization; any brainpower that is left may then be used to understand the message (if the reader hasn’t yet given up in frustration). Noah Iliinsky and Julie Steele (Data Visualization)
The core objective of a dashboard is to make complex information accessible and easy to digest. Therefore, the interface presenting the data should be clean and straightforward in order to minimize users’ cognitive load and time spent searching.
The information architecture should present the essential data first while allowing access to supporting or secondary metrics. A progressive drill-down system should be designed that starts with a general overview and then goes into more detail—it facilitates data prioritization, and creates clarity.
Determining Dashboard Goals and Displaying Appropriate Data
When designing dashboards, successful dashboard designers start with a well-defined set of goals focusing on the problem to solve and the key, actionable insights people need to take away from the data.
Good design goals promote efficient and precise execution. Employing the S.M.A.R.T framework for goal setting puts the focus on specific, measurable, actionable, realistic, and time-based objectives.

A few key questions to ask when determining dashboard design goals:
- How many steps do users need to take to achieve a specific goal?
- Is the interface intuitive enough for the user to reach their goal on their own?
- What information does the user need to successfully achieve their goal?
To determine what the goal of a specific dashboard design may be, define it by asking, “What specific problem is this design going to solve for the user?” The answer will provide insights on what metrics, properties, values, visuals, and data are of consequence.
Goal-centric design focuses on solutions to real problems and is the foundation for all great dashboard design. Start with a clear understanding of business objectives, consider user goals, and then convey the key information that needs to be communicated.
Context in Dashboard Design
One of the biggest challenges of dashboard design is serving multiple personas. Once each user role is defined, it becomes critical to understand where their needs overlap and where they diverge.
Effective communication is the underlying principle of every successful dashboard design. Foreseeing potential scenarios in which users may find themselves will contribute to a better understanding of the user’s circumstances.
Always keep users context in mind when designing—identify their technical knowledge, their familiarity with the system overall, their goals, and so on.
Be sure to ask the following questions when trying to determine user behavior and context:
- Does the design consider the direction the visitor is used to reading in?
- Does interaction with the dashboard require technical knowledge?
- Will users manage to accomplish most of the actions in just a few clicks?
- Does the design align with user context by creating drill-down menus; does it use suggestive iconography and color palettes?
The color palette used in a dashboard’s design should also be considered as a context. Many business-to-business SaaS product dashboards are designed in a dark-themed UI because they are used for several hours straight.
Dark-themed UIs can help reduce eye strain and support visual clarity within the interface. However, taking this approach requires a careful evaluation of the design direction—the advantages, disadvantages and potential pitfalls as outlined in a previous design blog article: Dark UI Dos and Don’ts.
Better Dashboard Design with User Research
User research helps create an environment in which users are presented with data that is relevant, clear, and concise. This helps them think about the content and the data they’re looking for, rather than how to use and access it.
Some dashboards have to work—or be effortlessly customizable to users of different roles looking at the same basic dashboard. User research is important because it helps determine the user’s goals, mental models, environmental context, and pain points. These are factors that greatly influence the final dashboard design.
User experience designer, researcher, and author Mike Kuniavsky notes that it is “the process of understanding the impact of design on an audience.”
A designer has to define the different user types and understand where their goals are the same, and where they differ. What information is most actionable to one user type vs. another? They must consider if there needs to be a different layout from one user type to another, or if there is a solution for a more general use case.
Taking this in mind, it’s a good idea to start with rudimentary wireframes and move on to prototypes that can be tested with actual users during a user research phase. Truly valuable insight can come out of a short user research phase with just five users—and it will save an enormous amount of time down the line.
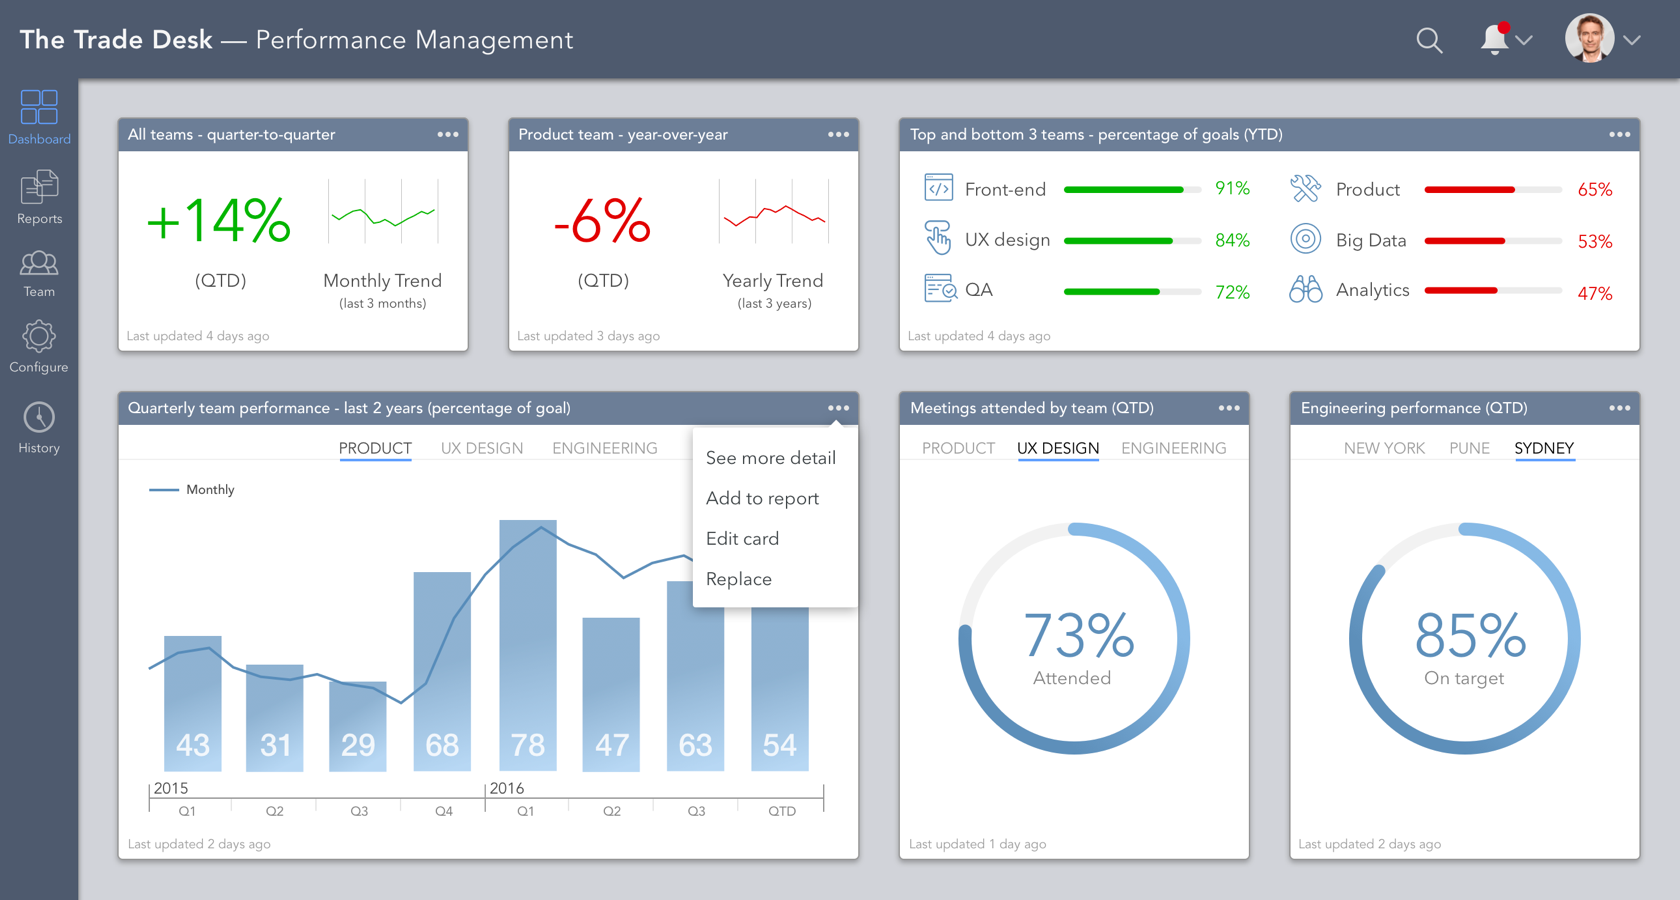
Progressive Disclosure in Dashboard Design
Progressive disclosure is a technique used to maintain a user’s attention by reducing clutter. Creating a system of progressive disclosure assists in creating a user-centric environment, which helps prioritize user attention, avoid mistakes, and save time. It also allows users to focus on the key features that matter to them and not be forced to go through all of the features—including the ones they don’t need or are not interested in.
Progressive disclosure is a dashboard design best practice that will also reduce error rates considerably; it will improve efficiency and help users improve their understanding of dashboards when a system is based on feature prioritization.
Progressive disclosure defers advanced or rarely used features to a secondary screen, making applications easier to learn and less error-prone. – Jakob Nielsen
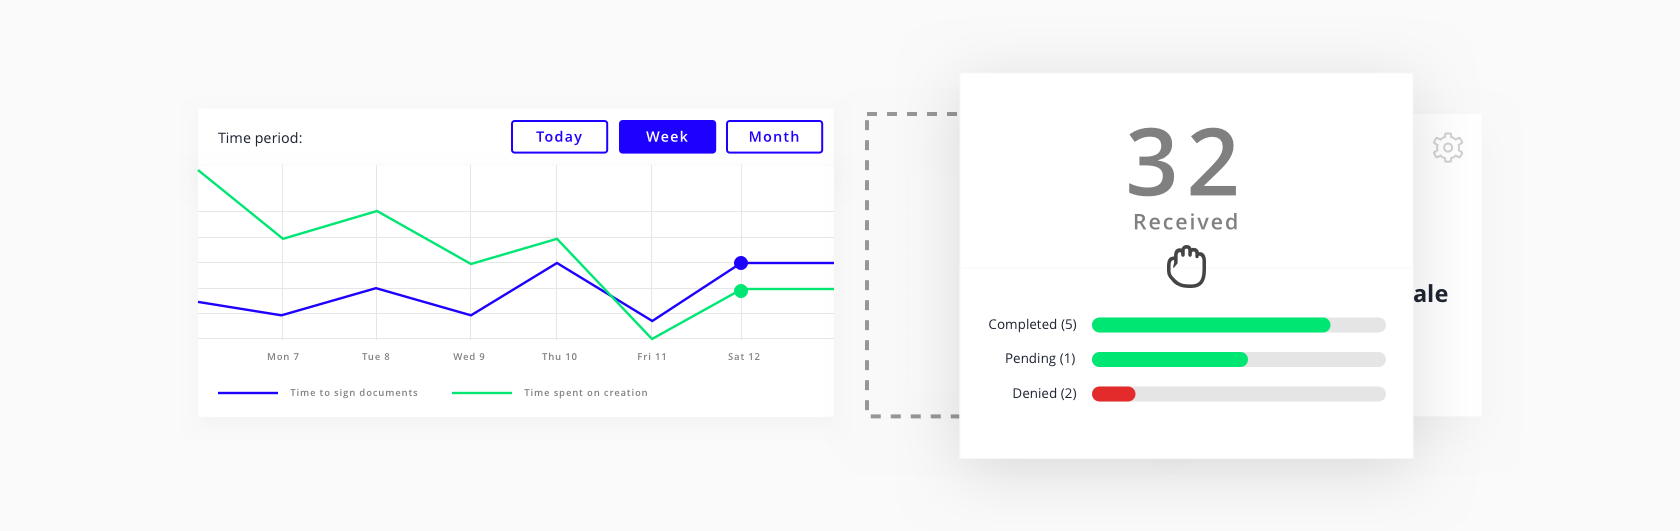
Animation is a great way to satisfy a variety of user needs while also fulfilling multiple functions. It a great option to use while data and visuals are being loaded and is an advanced progressive disclosure solution.
Animation is the process of creating the illusion of motion; it is a dynamic that creates a sense of progress and constant feedback, thereby reducing user uncertainty and increasing perceived performance.

Advantages of using progressive disclosure in dashboards:
- Reducing user uncertainty and anxiety (by displaying signs of progress, the users are assured that everything is working as intended)
- Providing users with something to look at (partial display of data) rather than make them wait
- Providing users with a clear expectation of the upcoming steps, and creating an understanding of the way information is presented hierarchically
Potential issues with progressive disclosures and loading of data includes:
- Using indicators and disclosures in an inappropriate manner. Short loading times and useless steps will create distraction and work against usability principles.
- A lag in the retrieval of data without a clear indicator of progress can lead to user uncertainty and higher bounce rates.
- Using static progress indicators is a solution with little meaning, and does not offer enough information about progress, which can also lead to user uncertainty and higher bounce rates.
Summary
Dashboards are a powerful way to communicate data and other information, especially with a user-centered, goal-centric design that follows dashboard design best practices and proper data visualization. Although every dashboard is different and has its own goals, requirements, and limitations, following these fundamental principles and seeing them applied with examples of dashboard layouts will help in creating outstanding designs regardless of the specifics:
- First and foremost, empathize with your user types and understand their goals.
- Convey a clear story to users by making use of suggestive visuals, labels, progressive disclosure techniques, and animation.
- Make the complex things easy by applying user research techniques.
- Reveal data and information at the appropriate time, in a drill-down system.
- Use data visualization to express information in a meaningful way.
Further Reading on the Toptal Blog:
- E-commerce UX: An Overview of Best Practices (with Infographic)
- Empty States: The Most Overlooked Aspect of UX
- Anticipatory Design: How to Create Magical User Experiences
- Heuristic Principles for Mobile Interfaces
- The Importance of Human-centered Design in Product Design
- Designing an Intuitive Mobile Dashboard UI: 4 Best Practices
London, United Kingdom
Member since February 23, 2017
About the author
Stelian is a UI designer with over seven years of experience in designing and building projects of different scales from the ground up.