Equity Levels of Value: The Logic Behind Premiums and Discounts
Business value is much more than just the sum of discounted future cash flows. There are strategic elements related to equity control that also determine true worth. These factors manifest through control, liquidity, marketability, and synergistic discounts and premiums.

Business value is much more than just the sum of discounted future cash flows. There are strategic elements related to equity control that also determine true worth. These factors manifest through control, liquidity, marketability, and synergistic discounts and premiums.

During his two-decade career in Asia and the US, Nathan has consulted in strategy, valuations, corporate finance and financial planning.
Expertise
PREVIOUSLY AT

Traditionally, when a business is valued, it is appraised primarily on its ability to generate future cash flows, with the subsequent present value of them determining worth to investors. However, on its own in the real world, such exercises do not paint an accurate picture of the business’ value. There are situational and circumstantial elements of a transaction that are not represented in the financial statements, which also need to be accounted for.
The marketability (liquidity) and the degree of control that the investor will have through equity ownership are the two components that determine the levels of value in a transaction. Their resultant calculations will add a premium, or a discount, to the financial valuation of the asset and result in the fair market price.
In this article, I am going to explore the levels of value and introduce the individual factors that are appraised.
Levels of Value: The Hierarchy
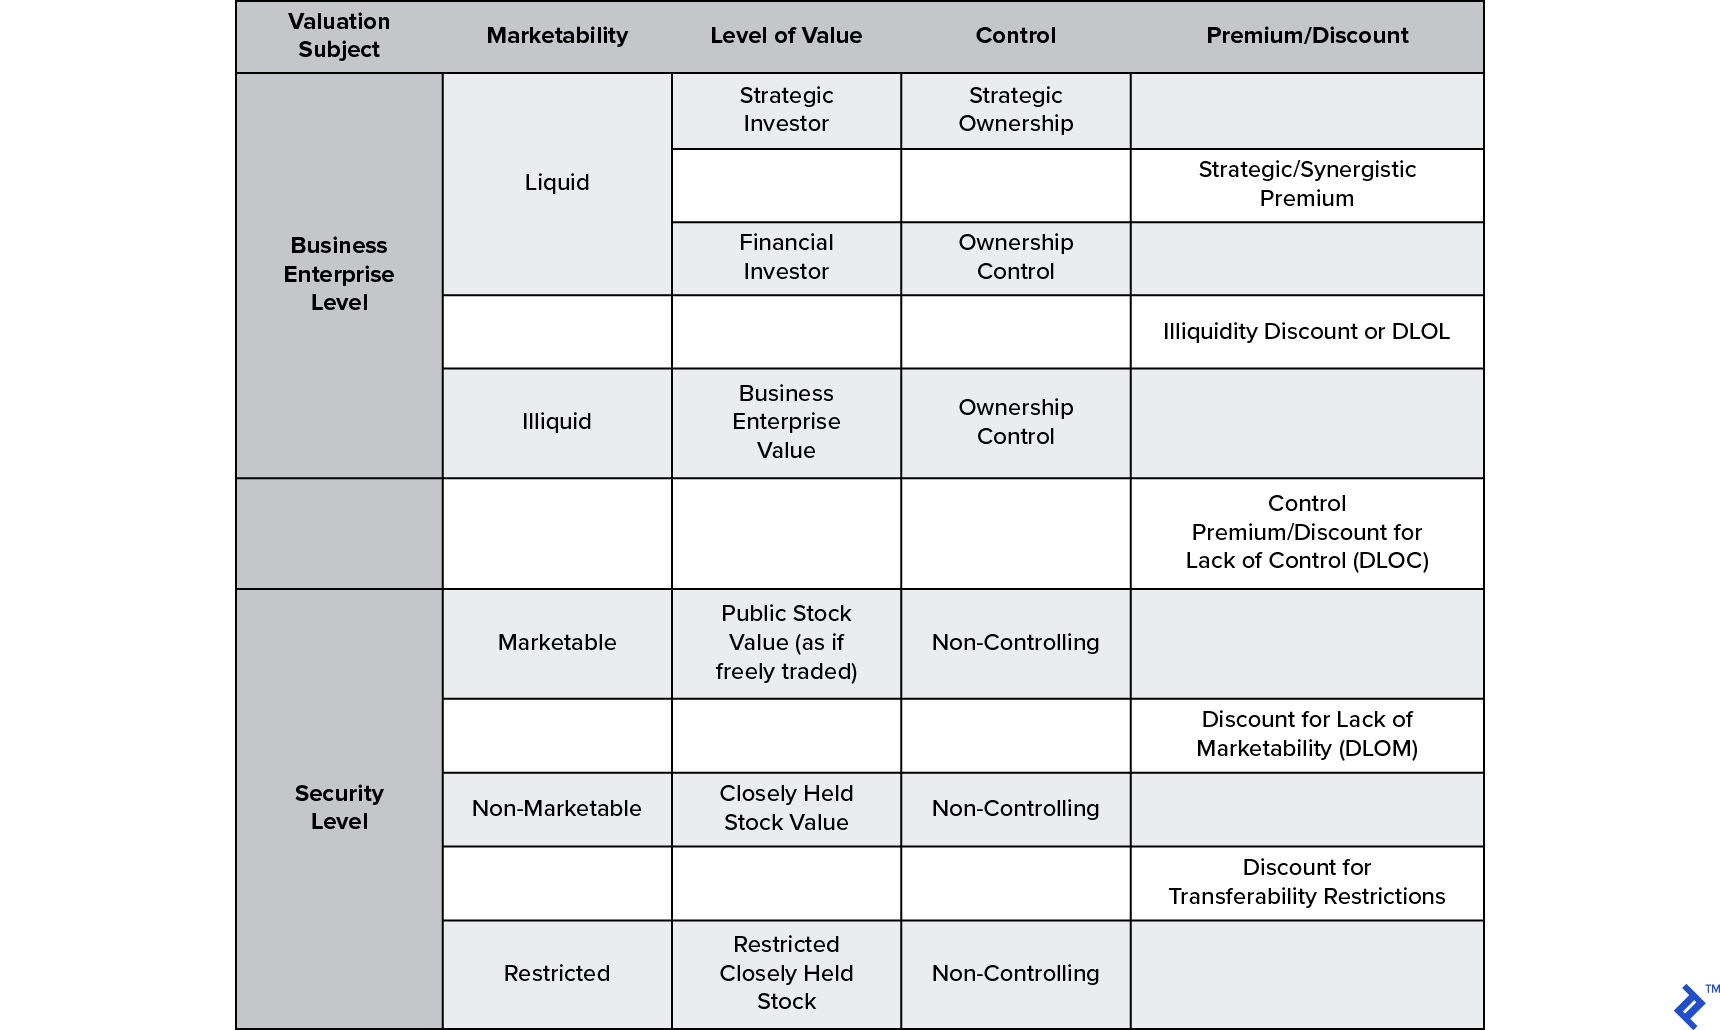
The levels of value define what kind of claim on the asset that the equity investor holds. They are demonstrated in the hierarchy of the table below. The strategic investor is the highest level of value and is a term often seen in the press to designate significant investors, whose presence in a large enterprise can be game-changing in terms of their financial, reputational or operational clout. At the other end of the scale is restricted, illiquid equity held with a non-controlling stake. The progression down (or up) the hierarchy is based on discounts (premiums) for appropriate enterprise-level or security level restrictions (autonomy).
Applying Through the Valuation Process
A typical valuation process will start with using inputs (observable data points) from the market, which results in a price that would be equivalent to that of a minority share in public stock. At this juncture, the levels of value can then be applied in order to bring the valuation in line with the marketability and control scenarios in play.
With regards to how to apply the discounts and premiums, the following are my high-level recommendations:
- It is always advisable to apply the discounts/premiums from the level next to the one you are appraising. For instance, after arriving at the public stock level, use the control (DLOC) and then the liquidity (DLOL) discounts, respectively.
- The discounts should be applied to the value and not blended into the time value-based discount rates. For example, use a 30% discount for DLOC on the public stock level, instead of adjusting the discount rate upward by 3%.
- Any discount can be converted into a premium using the following equation to inverse it.
Discount = 1 – (1/(1+premium)) - Relate the inputs used to the levels of value in question. For instance, if the inputs used are cash flows to minority shareholders for DCF, then no DLOC will be required because control is irrelevant at this point.
Now the discussion will move to each of the discounts/premiums applied to each level of value; this will start from the lowest level (restricted stock). Each section will introduce the adjustment, why it is necessary, and some empirical examples of benchmarks that are commonly applied by practitioners in live environments.
Discount for Transferability Restrictions
Equity shares become less valuable to their holder when there are restrictions on the transferability of them. Such constraints ultimately limit liquidity potential by shrinking the pool of potential buyers and/or making timings to sell more arduous. For instance, in comparison to a closely-held public company, a private limited company has a higher restriction on the transferability of shares due to statutory limits that shareholders are bound to under their shareholder agreement. Any valuer of a private company should carefully read the target’s governing bylaws, articles of association or partnership agreement to fully understand the restrictions better.
In many private company articles, transferability restrictions manifest via provisions related to the right of first refusal (ROFR) or right of first offer (ROFO), which both take precedent before shares can be sold to external parties. You may already be familiar with these terms, which I have provided brief descriptions below:
- Right of First Refusal (ROFR): When a third party makes an offer to buy a shareholding, holders of a ROFR are given to the option to match the bid before any external sale can be made.
- Right of First Offer (ROFO): When a selling shareholder must first offer their asset to the holder of a ROFO, if an offer is made, the owner can only sell to another third party if its bid is higher than that of the right holder.
In addition, transferability can be hindered by processes related to the actual valuation of the asset. This could be through insistence on a board-appointed valuation agent, or for a predetermined formula-based valuation approach. All of these provisions can act as an additional barrier to the transfer of shares and thus require the buyer to have a separate discount for transferability restrictions.
Discount for Lack of Marketability (DLOM)
A Discount for Lack of Marketability (DLOM) is defined as “an amount or percentage deducted from the value of an ownership interest to reflect the relative absence of marketability.”
Marketability relates to the saleability (not necessarily the liquidity) of the asset. The same NAVCA glossary defines this characteristic as “the ability to quickly convert property to cash at a minimal cost.” It should also be noted that this must also take into account the transaction risk of anticipated proceeds actually being realized.
In terms of the actual theory behind how to calculate DLOM, most valuers refer to a set of prescriptions known as the Mandelbaum Factors. These arose from a prominent tax case in 1995 ruling, where Judge David Laro of the US Tax Court outlined several factors to be considered for determining marketability discount. These came to be named after the case’s petitioner, Bernard Mandelbaum:
- Private vs. Public Sales of Shares
- Financial statement analysis
- Company dividend policy
- Nature of the company (e.g., its history, position in the industry, and economic outlook)
- Company management
- Amount of control in transferred shares
- Restrictions on transferability of shares
- The holding period for stock
- Company redemption policy
- Costs associated with making a public offering
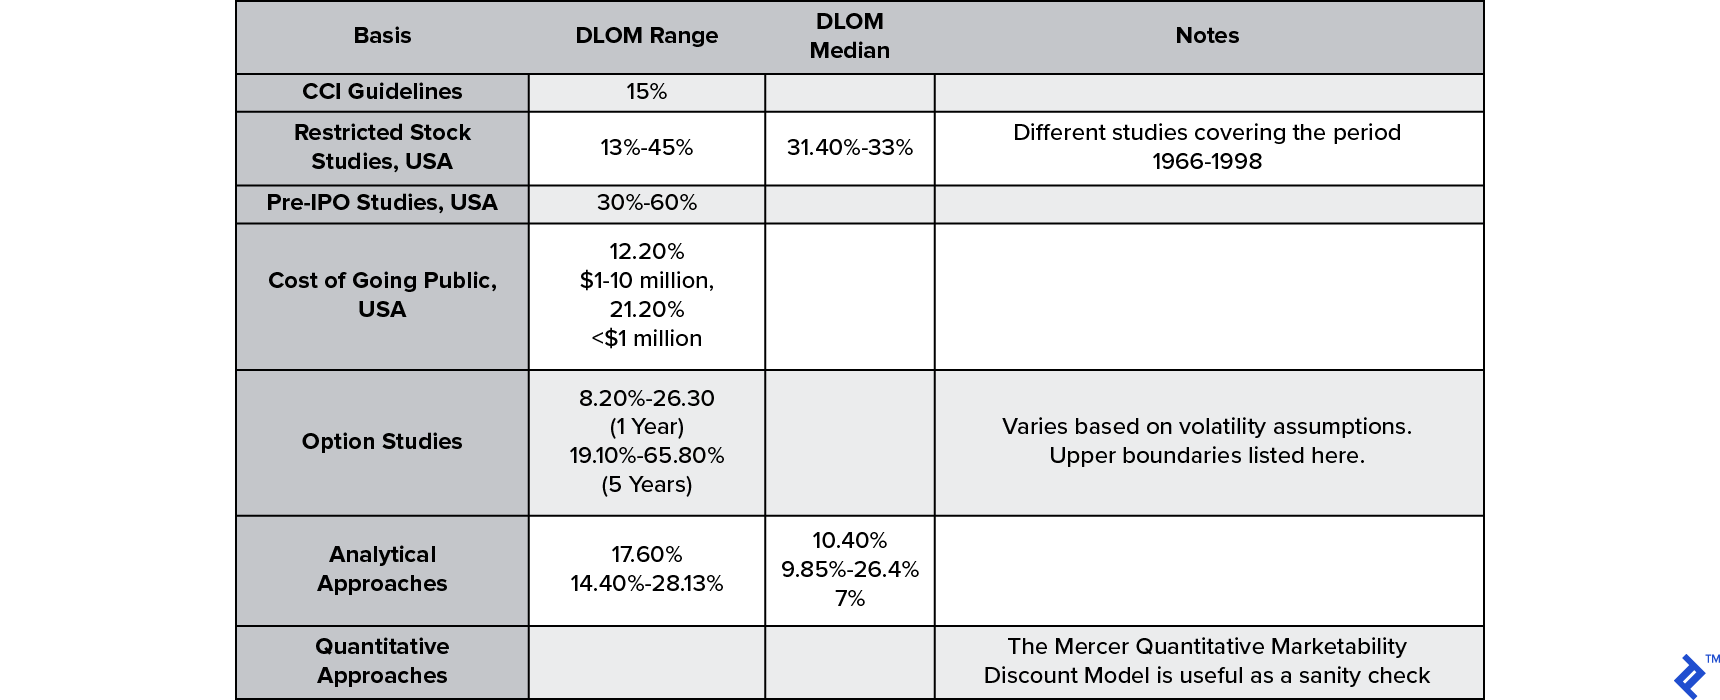
These tests, which were created for the purpose of taxation, now form the basis of assessing marketability discounts/premiums. Regulatory and professional body standards around the world (i.e., RICS Red Book and US IRS) provide a number of acceptable approaches for reaching a DLOM figure. They range from pre-IPO studies of stock performance to the costs of going public and using option pricing methodology.
Below is a summary of the median ranges that can be expected depending on the exact approach used.
Discount for Lack of Control or Control Premium (DLOC)
The element of control is a critical dynamic of investing. It provides malleability to shape the direction of the asset throughout its holding period and those that hold the tools to exert control have an advantage here.
In terms of what factors in a company’s articles implicate on its control, look for what events will require an ordinary or special majority from shareholders. In addition, the power to appoint a director to the board, or the ability to control it through such appointments, will impact investment, financing, and operating decisions. Share classes and the super-voting rights provided to certain investors (most notoriously, with the founders) are also important considerations to take into account.
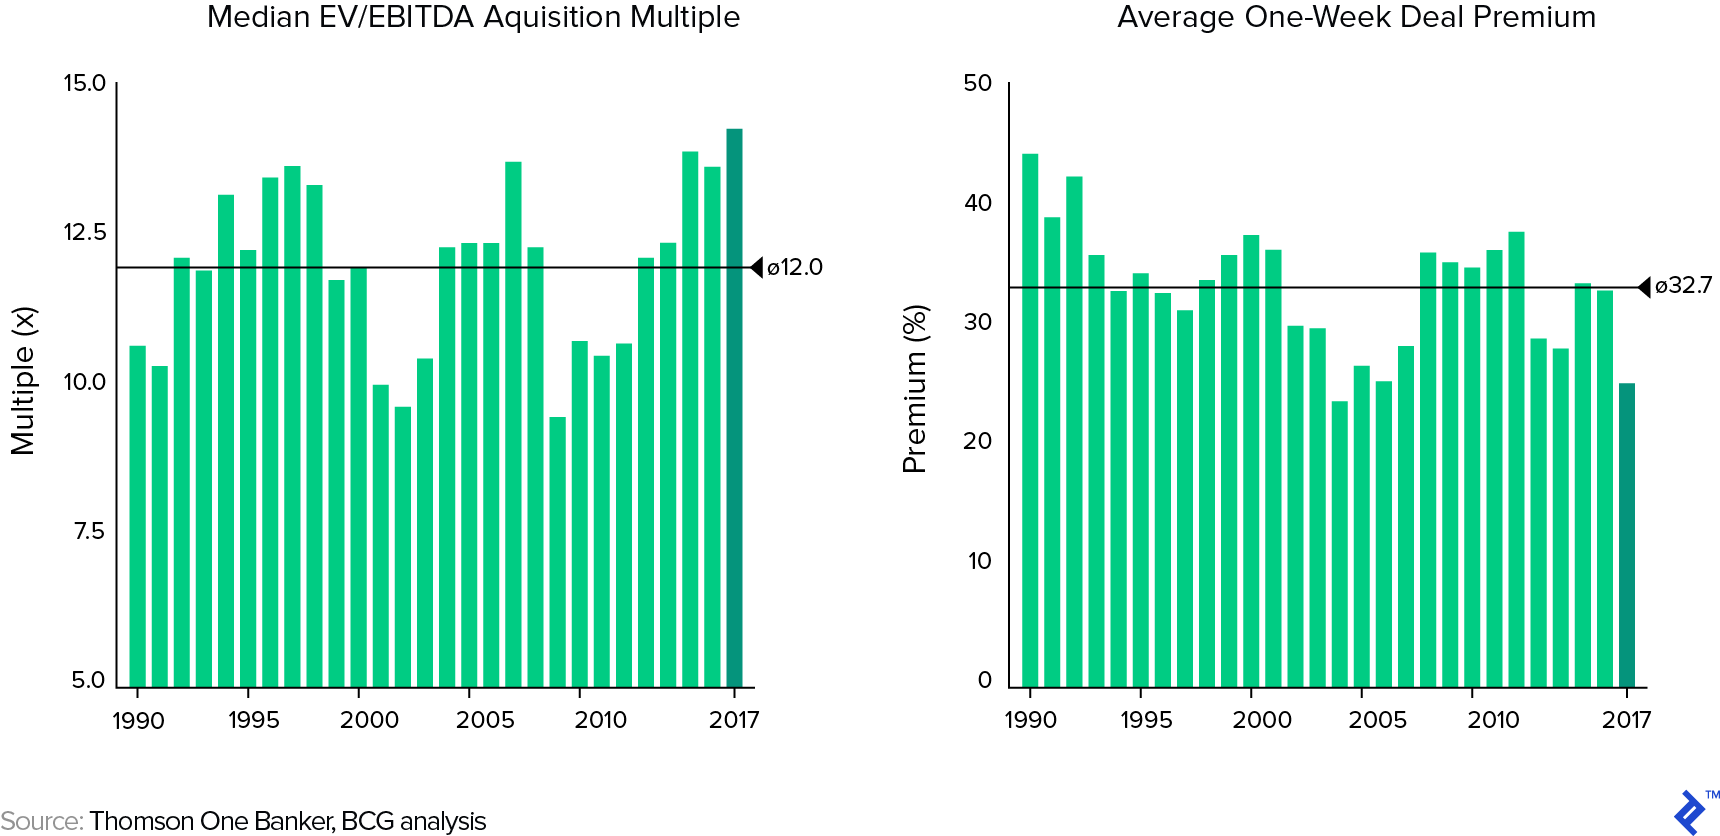
Discount for lack of control (DLOC) benchmarks are primarily determined through observing the control premiums offered during recent takeover or tender offers. Such premia will depend on the country and industry in question and will have a degree of mutual exclusivity with the valuation multiple of the transaction. The following analysis from BCG showed that most recent US acquisition premiums were averaging out at 24.8%, which was below the long-term average of 32.7%.
Discount for Lack of Liquidity or Liquidity Discount
Liquidity is the ability to readily convert an asset into cash without significant loss of principal. NYU professor Aswath Damodaran explains it as the cost of buyer’s remorse: the loss hit of reversing a trade immediately after making it. Even the most liquid assets are illiquid to the extent that there is a trade execution cost. Liquidity discount can be broken down to the tangible and intangible:
- Brokerage or transaction costs (visible and with a small impact).
- Bid-ask spread of the market price, e.g., how wide the mark is between buying and selling prices (visible and larger impact).
- Market impact, also known as “blockage discounts.” This is the impact of having the trade out in the open and what effect third parties will have on its progress (invisible and larger impact).
- Delayed and missed trades (internal/opportunity cost and largest impact).
Benchmarks for liquidity discounts can range massively, as they are dependent on the markets that exist for the asset and the size of the shareholding that needs to be sold. As a general rule of thumb for illiquid investments, Damodaran recommends a range of 20-30%.
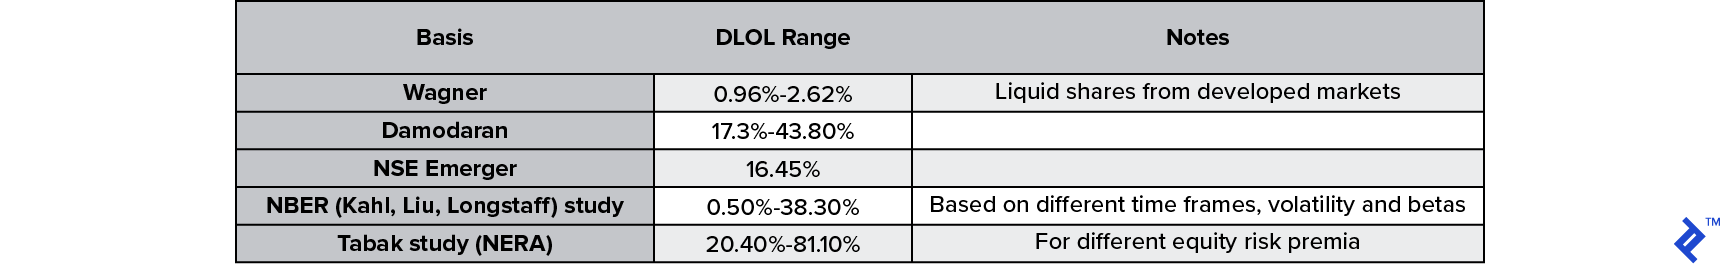
A summary of various researchers’ finding into DLOL ranges are shown in the table below, with each providing a wide range of upper and lower boundaries. One method of particular interest is NBER’s calculation, which uses a Black Scholes option pricing model to measure the maximum impact of a number of liquidity restrictions. These include the standard beta, volatility, and timing considerations, but also a “fraction of wealth” variable, which represents the proportion of the asset’s value to the total illiquid wealth of the investor.
Synergy Effects
Synergy is a word commonly used by executives to justify an M&A deal, yet it is equally a term that can be derided as a chimera. With two thirds of public M&A deals destroying value for acquirers, synergies are often just based on hubris over sound economic rationale.
Warren Buffett once went into great detail comparing them to fairy tales in one of his annual letters:
"Many managers are apparently over exposed in impressionable childhood years to the story in which the imprisoned handsome prince is released from the toad's body by a kiss from the beautiful princess. Consequently, they are certain that the managerial kiss will do wonders for the profitability of the target company.
Such optimism is essential. Absent that rosy view, why else should the shareholders of company A want to own an interest in B at a takeover cost that is two times the market price they'd pay if they made direct purchases on their own.
In other words, investors can always buy toads at the going price for toads. If investors instead bankroll princesses who wish to pay double for the served many kisses, those kisses better pack some real dynamite. We've observed many kisses, but very few miracles. Nevertheless, many managerial princesses remain serenely confident about the future potency of their kisses even after their corporate backyards are knee-deep in unresponsive toads"
– Warren Buffett, Letter to the Shareholders (1981).
Before looking at the reasons for the supposed cynicism held by valuers when considering synergies, it is first essential to look at what synergies actually are. There are three sources of synergies, which all arise from the visible components of free cash flow (FCF) and the weighted average cost of capital (WACC).
- Revenue synergies. When two combined entities profit from having better access to customers. There are a wide range of ways this can be achieved, but broadly come down pricing, market, and distribution advantages.
- Cost synergies. Moving below the revenue line, when through economies of scale and sharing, a combined entity gains margin expansion through cost reduction.
- Financial synergies. When tax, debt, and cash flow profiles can be combined in a financially advantageous way.
Revenue synergies tend to play out in the product markets and are subject to forces beyond the control of the firm. Hence, it is the least predictable and the least reliable of the three to model when valuing a business. Conversely, cost synergies are primarily under the control of the combined entity and occur on a recurring basis; thus, they are quite reliable to plot. One-time cost elimination activities (such as a site closure) also have a high degree of certainty and are the buyer’s prerogative in terms of whether they will be enacted upon.
Financial synergies are the less “romantic” option and are often easy to understand, but hard to realize. Tax benefits have a degree of uncertainty due to the limitations imposed on carried forward losses and ownership changes. Debt synergies also may appear straightforward on a spreadsheet when costs of borrowing fall and absolute capacity rises, but raises a question about whether this actually means it is a synergy? For example, If the investor could achieve the same result by optimizing its own balance sheet then the acquisition is hardly a unique necessity.
True debt synergies are when borrowing power rises, which shifts optimum debt capacity and subsequently lowers WACC. Typically, this result is achieved through diversification or combining two entities with less than perfectly correlated cash flows to achieve a more stable total cash flow.
Synergies may also arise in the form of real options. These are the advantages managers have to make choices (options) on the future direction the business will take, due in part to the physical assets that it holds. An acquisition may bring more real options into play. Some examples are shown below:

There are various ways to value real options; these should be applied to determine the synergies that exist within a transaction and the subsequent price considerations for the deal.
The Artistic Part of the Science of Valuation
It is often repeated that valuation is both an art and a science. Which of its aspects are science or art is sometimes not clear, and when they are mixed up, the valuer can make unforgivable errors. The process of building a discount rate and valuing cash flows deviates toward the science-side of the spectrum, while the application of discounts/premiums for marketability, illiquidity, control, or synergies are more art, due to their reliance on the valuer’s judgment.
The goal of this article was to enlighten valuers to the best practices available when determining the levels of value in a transaction, which I hope will enhance decision-making situations!
Understanding the basics
What is the difference between marketability and liquidity?
Marketability is saleability while liquidity is how fast the sale can occur at the current price. An asset being illiquid does not mean non-marketable; it may still be saleable but not quickly or without loss of value. For instance, a sufficiently large tract of land is marketable, but not necessarily liquid.
Nathan Krishnan S
Kochi, Kerala, India
Member since March 24, 2017
About the author
During his two-decade career in Asia and the US, Nathan has consulted in strategy, valuations, corporate finance and financial planning.
Expertise
PREVIOUSLY AT