Logstash Tutorial: Using Logstash to Streamline Email Notifications
Toptal engineer Jurgens du Toit looks at the possibility of using Logstash to regain control of your inbox and make your error emails manageable again, all without changing a single thing in your app.
Logstash can effectively leverage the power of Elasticsearch and Amazon SNS to streamline email notifications and save time.
As an expert full-stack developer with a deep knowledge of the internet and web applications, and an ability to meet client requirements.
PREVIOUSLY AT

Apps that use emails as the main mechanism to report errors and exceptions always seem like a good idea at first. As Java Developers we think, “hey, I’ll immediately know when something goes wrong!”
However, at some point you are bound to realize that the error emails are getting away from you and you need to clean up your email inbox. You can ignore 404s (most of the time), and it can be nice to receive notifications of new signups, but at the end of the day it may become a bit too hectic or time consuming.
Sooner or later, distinguishing “actionable” emails from pointless notifications becomes difficult. You can set up rules and filters on your mail, but even these can start to become unmanageable.

This Java tutorial will look at the possibility of using Logstash to regain control and clean up your email inbox and make your error emails manageable again, all without changing a single thing in your app.
Logstash Setup And Input
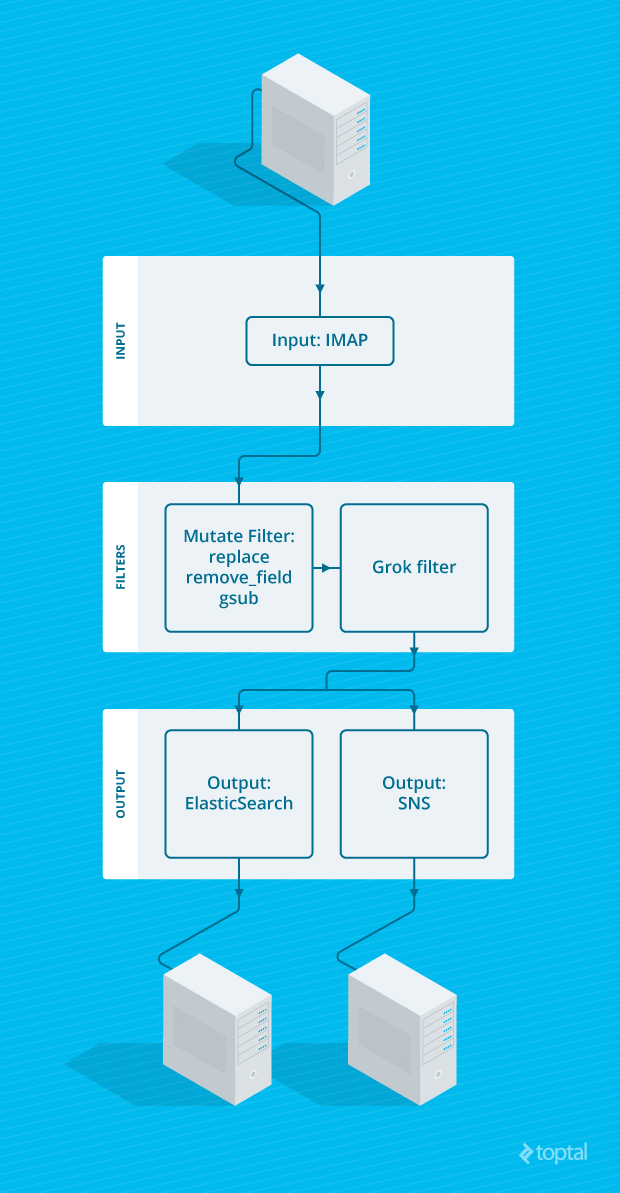
The first step in our Logstash tutorial is to ensure that all the email you receive from your system goes to one folder. Since we’re moving all of the sorting and managing out of your inbox, it won’t matter that it’s one big folder anymore. Go ahead and remove all the folders and filters you already have set up, and reduce it to one folder and one filter.
Move all email from “system@my-awesomeapp.com” to the folder “MyAwesomeAppEmails”. If you have a separate mailbox for these emails, then it will be even easier.
Now we can set up Logstash to poll that folder and parse the mails using the IMAP plugin. Version 1.4.2 only supports pulling emails from the Inbox, but there’s a relatively simple fix that has been applied in version 1.5 to allow polling a specific folder. If you don’t have a separate mailbox, please apply the patch to the IMAP plugin in your Logstash instance before continuing.
# /etc/logstash/conf.d/01-imap-input.conf
input {
  imap {
	host => "imap.yourmailserver.com"
	user => "username"
	password => "password"
	secure => true
	fetch_count => 15
	folder => "MyAwesomeAppEmails" # This line will only work if you apply the above mentioned patch
  }
}
This will start checking new emails and parsing them into Logstash events.

Logstash Filter
A lot of useful data is parsed from emails into different event properties - notice that the email timestamp is used as the “@timestamp” for the event. Even further, from the headers alone we can do things like identify the host that the error originated from:
filter {
  mutate {
	replace => [ "received", "%{[received][-1]}" ]
  }
  grok {
	match => [ "received", "from %{HOSTNAME:hostname} \(%{HOSTNAME:full_hostname} \[%{IP:ip}\]\)" ]
  }
  mutate {
	remove_field => [ "received" ]
  }
}
This, however, is not enough to tame your error emails. We need a bit more, specifically the following three steps describing:
- The type of the error
- The severity of the error
- Any error details included in the email
Let’s assume you placed the name of the error, e.g. “Widget Failed”, as well as the severity of the error “ERROR” in the subject of the email like this: “ERROR: Widget Failed in /var/www/myapp/foobar.php 20”.
We will use this to set several properties of the event:
filter {
  grok {
	match => [ "subject", "%{WORD:severity}: %{DATA:type} in %{PATH:path} %{POSINT:line}" ]
  }
}
Logstash comes with a number of predefined patterns that you can expect to see in logs, and other various places. Use these to build up your Grok patterns and make them easier to read. We’ve used “WORD” (a single word), “DATA” (non-greedy catchall), “PATH” (a Unix or Windows file path) and “POSINT” (a positive integer). You can also use the Grok Debugger to debug your Grok patterns. Messages that don’t match the pattern will be tagged with the “_grokparsefailure” tag.
That takes care of the type, severity, source file, and line of the error - basically all relevant meta data of the event. Now onto the details.
Fine Tuning Logstash
You may have previously added a nice header or footer signature to your email, being the courteous person that you are, but now it’s in the way. Let’s remove it from the message, as well as any trailing whitespace so that we can parse the rest of the email for the error stacktrace:
filter {
  mutate {
	# gsub takes 3 elements per substitution: field, regular expression and substitution
	gsub => [
  	"message", "Your Dev Team", "",
  	"message", "More error details:", ""
	]
  }
  mutate {
	strip => "message"
  }
  # Split the message into an array of lines, each containing a line of the stacktrace
  mutate {
	split => [ "message", "\n" ]
  }
}
The “gsub” mutation uses the standard Ruby Regexp object, so all the options and features are available in logstash as well.
Output via Elasticsearch and Amazon SNS
Let’s apply this to our Elasticsearch instance using Logstash Elasticsearch output so that we can easily search and quantify the data we’re collecting:
output {
  if "_grokparsefailure" not in [tags] {
	elasticsearch { }
  }
}
We’re excluding all messages that didn’t Grok properly by checking for the “_grokparsefailure” tag. The assumption is that only emails whose subject matches the specified subject should be interpreted as error emails. Otherwise, it’s simple and straightforward.
Logstash comes with a plethora of outputs, so let’s enhance this even more using SNS output to notify us of significant errors using Amazon’s Simple Notification Service (SNS). We’ll assume that all errors of type “notifiable” need to generate a notification. If you’re not on an EC2 instance, you’ll need to specify an AWS key and secret.
output {
  if "notifiable" in [tags] {
	sns {
  	region => "us-east-1"
  	arn => "arn:aws:sns:us-east-1:1234567890123456:mytopic"
  	access_key_id => "AWS ACCESS_KEY" # Only specify these if you're not on an EC2 instance
  	secret_access_key => "AWS ACCESS SECRET" # Only specify these if you're not on an EC2 instance
	}
  }
}
Tagging errors as “notifiable” is up to you. You can do that by looking at either the severity of the error or looking at the type of the error.
Now you can actually read important emails again, and you can be sure that you won’t miss important error emails. You can also make informed decisions on what errors to fix, as you can see how often an error occurs and when it occurred last. Searching for a specific error is also easier and faster, thanks to the awesome searching powers of Elasticsearch outlined in this Logstash tutorial.
Jurgens du Toit
Johannesburg, Gauteng, South Africa
Member since November 19, 2014
About the author
As an expert full-stack developer with a deep knowledge of the internet and web applications, and an ability to meet client requirements.
PREVIOUSLY AT


