Growing Growth: Perform Your Own Cohort Analysis with This Open Source Code
But this isn’t just another article about cohort analysis. If you already know the importance of the topic and want to skip the introduction, you can jump to the simulator, where you can either simulate startup growth based on retention, churn, and a number of other factors, or analyze your own PayPal logs with the code I’ve open sourced.
If, however, you don’t realize that these are some of the most important metrics around–continue reading.
Alejandro is an engineer and entrepreneur as well as an unmatched growth hacker with a ruthless drive to accelerate company growth.
Expertise
Alejandro Rigatuso is the founder of Postcron.com, an easy way to schedule posts on Facebook and Twitter. You can contact him at alejandro@postcron.com.
Cohort analysis, retention, and churn are some of the key metrics in company building.
But this isn’t just another article about cohort analysis. If you’re a seasoned data scientist that already knows the importance of the topic and want to skip the introduction, you can jump to the simulator, where you can learn how to do cohort analysis and simulate startup growth based on retention, churn, and a number of other factors, or analyze your own PayPal logs with the software I’ve open sourced.
If, however, you don’t realize that these are some of the most important metrics around–continue reading.
Introduction to Cohort Analysis
First, lets understand what we’re talking about here with a cohort analysis definition. Briefly, a cohort is a group of subjects with a common defining characteristic. Maybe it’s their age, maybe it’s their nationality, maybe it’s their city of birth, etc.
Age is a particularly good example. Often, we refer to those born between the 60s and the 80s as members of “Generation X” and those who were born between the 80s and 90s as members of “Generation Y”. Each cohort, each generation, has its own defining characteristics.
Similarly, any company can group and analyze their customers by cohort. A common and very useful way to analyze your customers is to group them by the date at which they started to use your service.

What if I were to ask you: “How much of your revenue last month came from customers who started to work with you a year ago?” Any at all? New users may look good, but signups alone don’t equate to revenue. Do you know the answer? If not, it’ll be helpful to learn about cohort analysis.
Cohorts, retention, and churn analysis
If you analyze your revenue by cohorts, you can deduce (on a monthly basis) how much of your revenue comes from new users and how much comes from old users. Plus, you can take the next step and predict future revenue attributed to retention and accounting for churn with a significantly higher degree of precision.
Ok, so we’ve established that a cohort is a group of people with a common defining characteristic. From here, we’ll proceed by example, examining the metrics of our new hip cloud computing startup. Let’s start by analyzing just a single cohort. In this case, we’ll look at the customers that started working with us in January 2012.
The first important metric that we need to calculate is retention: how many of our new January users were still with us in February? Say we had 100 subscribers in January, and only 20 decided to cancel their subscriptions, leaving us with 80 subscribers remaining in February. Basic retention analysis tells us that’s an 80% retention rate. Now, let’s say that 8 customers decided to cancel in February. So in March, we have 80-8=72 users. Since 72/80 = 90% we had a 90% retention after 2 months for our January 2012 cohort.
Some people calculate retention as a function of the initial size of the cohort, but I prefer to calculate retention as a function of the previous month of each cohort.
Churn rate is another essential metric. It’s can be defined in terms of retention: churn = 1 - retention. So 80% retention implies 20% churn. In words, it’s the rate at which customers are leaving your service.
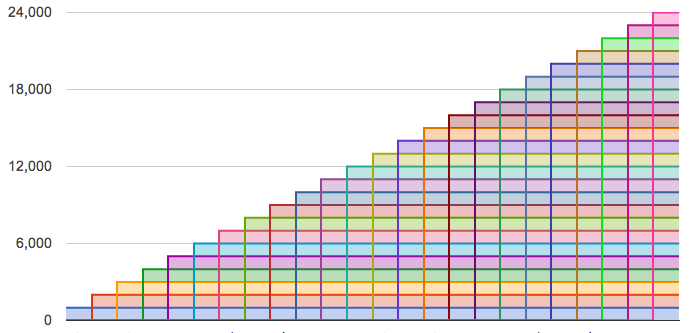
Returning to our cloud computing startup, let’s analyze an ideal (read: unreal) case: 100% retention rate. That means that none of our customers leave the service–no one cancels whatsoever. Lets say our company gets 1,000 new customers per month. After 24 months, this company has 24,000 active customers. Not too bad. Unfortunately, this scenario is basically impossible–100% retention only exists in startup paradise.

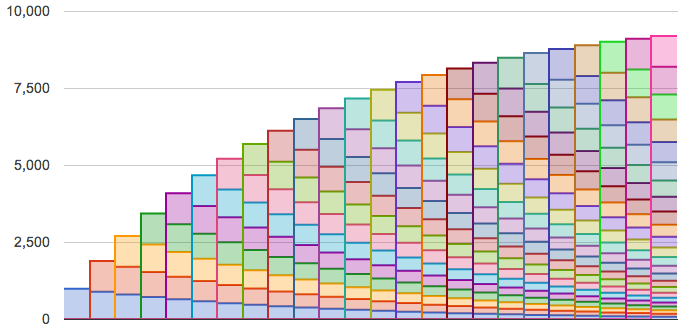
Now, let’s be slightly more realistic and say that our company has a 90% retention rate. In other words, each cohort loses 10% of its customers every month. Again, we’ll assume 1,000 new customers every month.
In this case, after receiving 1,000 new users in January 2012, we lost 100 customers in February, 90 in March, 81 in April, and so on. Let’s see what this graph looks like.

If you look at the previous cohort graph you will realize that the total number of active users is reaching a saturation point around 9,000. It can be demonstrated mathematically that this company will no longer grow beyond 9,000 users, even when it’s receiving 1,000 users per month.
With 1000 new users per month at a 90% customer retention rate, we have around 9,000 monthly active users after 24 months. Compare this to 100% retention, and we have just 37.5% of the ideal case (24,000 customers).
Put simply: a 10% drop on the retention rate caused a 62% decrease on the total number of active users after 24 months.
The key takeaways here: low retention rates limit growth, and using software for cohort analytics is useful for understanding your retention rates.
Growing growth
Now, you might be thinking: “But Alejandro, wait! If every company has a churn rate, and churn rates limit growth, how do some companies achieve hockey stick growth?”
To which I would respond: “Because their growth is growing.”
There are several ways to increase growth: increasing the marketing budget, optimizing conversions, and creating referral programs can all contribute to viral growth. Let’s analyze the case of viral grow, in which the number of new customers is affected by the company’s total number of active customers. In other words: more customers on the system equals more people referring new customers equals more new customers.
Let’s say that the company is growing virally with a constant (K) factor of 0.20 and that the formula we have applied to calculate the number of new customers is:
New customers (month) = k * Total number of Customers (month-1)
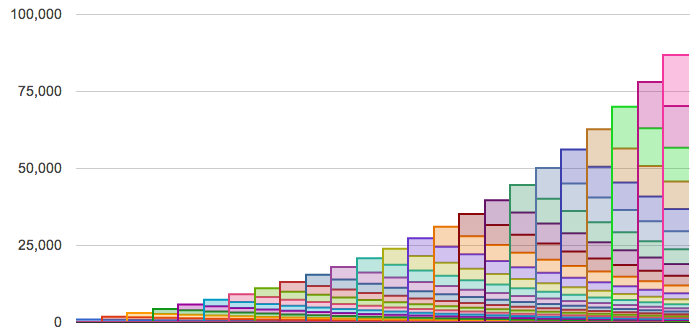
Now, let’s visualize the same example as before (1000 new users per month @ 90% retention), but this time, we’ll throw in some viral grow (with K = 0.20).

From this cohort analysis graph, there are two key takeaways: firstly, a constant factor of 0.20 has caused a 1000% increase in the total number of active customers (~90,000) after 24 months; and secondly, the system is still growing after 24 months–it didn’t reach a saturation point.
So, to compensate for our 90% retention rate, we need to create mechanisms to grow our growth every month.
Now, at this point, you might be saying: “Wow, Alejandro: viral growth is clearly more important than retention. Look at how it’s affected our customer base!”
To which I would respond: “Not so fast.”
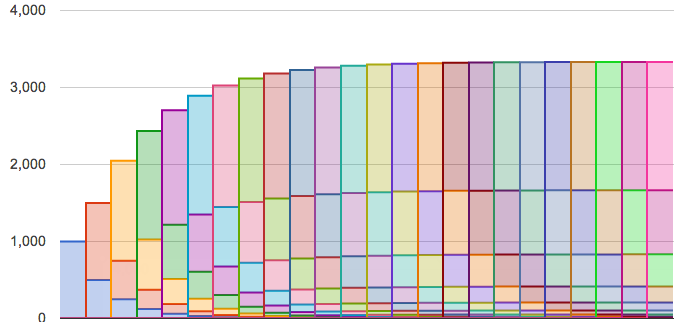
Let’s analyze one more case. Our good ol’ cloud computing startup, but with a 50% retention rate. We’ll stick with 1,000 new users per month and a viral growth rate K = 0.20. But regardless of the virality, our company is performing really badly, losing 50% of our customers on every cohort, every month.

After 24 months, our company only has 3,000 active customers instead of 90,000–that’s a 30x difference! Retention truly is key.
But why does retention have such a powerful effect? In short: Because viral growth depends on the number of active customers, so if we keep our users for longer, we’ll have more referrals.
To recap:
- Generally speaking, churn limits growth.
- Retention increases viral growth.
- Good retention and viral growth are prerequisites for scaling a company to millions, or even billions of users.
A final word on churn rate analysis
It’s pretty common to see more customers cancel a service during the first month of use than later on. That’s why in the following simulation, I provide you with two retention rates: the First Month Retention Rate and the Long term Retention Rate. Using these parameters in our calculations will lead to more precise results.
Conclusion
The purpose of this cohort analysis tutorial wasn’t to give you a detailed class about metrics and cohort analytics; in fact, others discussed the complexity of these statistics in far more depth. Instead, I want to awaken you to the importance of this type of analysis and, more importantly, to show readers their own revenue cohort analysis examples and churn rates with my open source cohort analysis software solution.
If there is just one question to wake you up, it’s the following:
How much of your actual revenue comes from users that started working with you a year ago?
How to do your own cohort analysis
Now it’s your turn! There are two ways to analyze your own business’s retention and churn:
- Upload your PayPal Data to the tool I’ve deployed. For full disclosure, please note that by using this tool, your log file will temporarily be placed on a server for processing (deleted as soon as the data is displayed). However, if you prefer, you can always…
- Download the open source code and deploy the tool yourself. The README contains detailed instructions for how to do so. If you don’t have a PayPal account, you can hack the code easily to analyze other types of accounts.
Alternatively, you can play around with our simulator and visualize startup growth based on all the parameters discussed above.
Thanks for reading!

