Adventures in GPS Programming and Development: A Geospatial Tutorial
This post explores some of the more common types of GPS tracking errors to expect with low-end GPS devices, providing an understanding of what causes them as well as some approaches for correcting them. The techniques outlined can provide users of low-end GPS devices with a reasonable level of automated improvement of the accuracy of their GPS tracks.

This post explores some of the more common types of GPS tracking errors to expect with low-end GPS devices, providing an understanding of what causes them as well as some approaches for correcting them. The techniques outlined can provide users of low-end GPS devices with a reasonable level of automated improvement of the accuracy of their GPS tracks.

Tomo is a Java, Android, and Golang developer with 13+ years of experience. He has worked on telecom, and banking systems.
PREVIOUSLY AT

This all started on a hiking trip to Žbevnica more than 10 years ago. I had my new GPS with me and a friend of mine had a GPS connected to a Windows ME phone. The hike was great, but when we returned to our cars, we were surprised to see that one GPS claimed we had walked 6.2km, while the other reported 6.7km. One claimed our elevation gain (i.e., the sum of all uphill parts of our hike) had been 300m, while the other reported it as 500m.
Being a programmer (and eventually a GIS programmer), I was immediately intrigued by the problem. I said to myself, “this should not be that hard to fix with a simple script.” After all, GPS tracks are just a list of tuples in the form of (latitude, longitude, elevation), right?
Well, not really.
And thus began my excursion into the fascinating world of GPS tracks, tracking errors, and, more generally, GIS programming.
Geospatial Information Systems (GIS) is a huge and complex domain, encompassing map projections and geodetic datums)), raste and vecto data processing, and remote sensing. A comprehensive introduction to this domain would be well beyond the scope of this article. And since focusing on a specific problem can often be a useful way to introduce oneself to a new domain anyway, I’ll present a few specific GIS challenges I encountered and some possible solutions; namely:
- How to recognize, understand, and programmatically correct GPS tracking errors
- How to compute and derive additional useful information from GPS tracks
For starters, GPS tracks are not just a series of (latitude, longitude, elevation) tuples. Many GPS-enabled devices will also provide metadata like time, heart rate, and so on. Some GPS devices will even provide information on how accurate the data is; a.k.a., “dilution of precision”. But, unfortunately, most GPS devices – especially the lower-end ones that dominate the market – won’t provide this information and we are left with the challenge of deducing the accuracy of the device on our own (and ideally correcting accordingly, where possible).
Let’s start with one possible algorithm to detect low-end GPS devices (like most smartphones) which usually have low-quality GPS data.
Elevation errors and idiosyncrasies
If you live in certain parts of the world you may have noticed something strange about GPS elevation accuracy when you record tracks with your smartphone. When you check the elevations they are consistently recorded as higher or lower (by a constant value) than the right elevation. For example, I live in Višnjan (Croatia) and my Android keeps telling me that I’m roughly 35-40 meters above the actual elevation.
For example, here’s a GPS elevation graph from a short hike I took a few months ago:
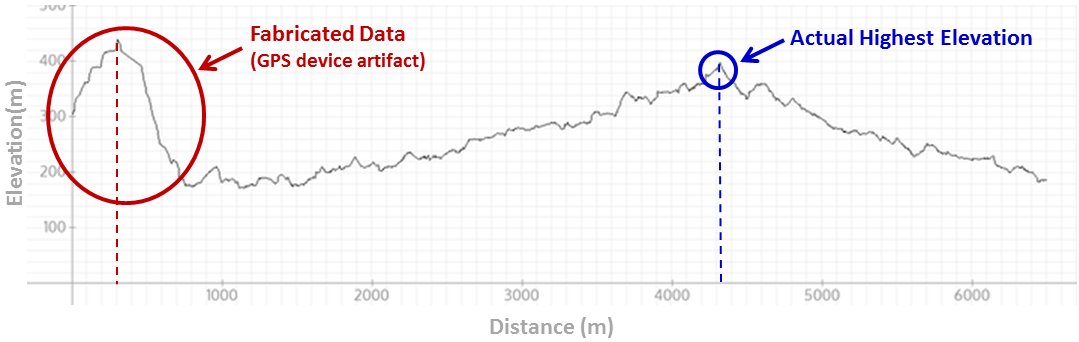
Two things to note here.
First, the “hill” in the first part of the recorded GPS data was completely fabricated by the device. Whereas the graph would seem to indicate that the highest point in our hike was just a few hundred meters from the start, in reality it was around 4km later.
Second, what is perhaps more important (and not visible on the graph) is that the entire graph is inaccurate. The altitude values were consistently reported as being roughly 30-40 meters higher than they were in reality, as we’ll discuss in more detail further on in this article.
These are the kind of things that can happen with cheap GPS devices. And when we can detect that the track has these errors, we can deduce that the device is probably a low-quality GPS which can therefore be expected to have other errors as well – not just elevation errors – that are common to such devices.
Startup elevation errors
There are essentially two techniques that GPS devices employ to determine elevation: “GPS altitude” (as reported to the device by the GPS satellite system) and “barometric altitude” (calculated by the device based on barometric pressure readings). Neither is perfect.
GPS altitude values can have many small errors (typically in the range of +/- 10m), which can be particularly problematic if we later decide to compute the cumulative elevation gain. Barometric altitude, on the other hand, is sensitive not only to altitude but also to weather conditions, which can introduce its own set of inaccuracies.
Some devices therefore employ a hybrid approach, using barometric readings to record elevation but using GPS readings to help (re)calibrate those values, to help account for weather (pressure) changes and so on. With such devices, when starting the track, the barometric elevation can be completely wrong, but then by recalibrating it with more and more GPS satellite data, the elevation data becomes more reliable. It is therefore not uncommon with such devices to encounter the type of “fake hill” startup error that we observed earlier on our elevation graph.
Ongoing GPS elevation inaccuracies
To explain the consistent error in altitude reporting, we need to return to our elementary school geography. Geography teachers usually explain that the Earth is not a sphere but an ellipsoid. If this were, in fact, strictly true, altitude would be easy to compute mathematically. But it’s not. The Earth is irregular; in reality, it’s more like a potato resembling an ellipsoid than a perfect ellipsoid, which means for GIS development you need a detailed altitude dataset for almost every point on the earth. In geodesy, this reference ellipsoid (a.k.a. datum) is a mathematically-defined surface that approximates the geoid, the “truer” figure of the Earth.
Moreover, it’s important to recognize that even these datums are merely approximations of the actual shape of the Earth’s surface. Some work better in certain parts of the world, and others work better in others. As an example, the image below (generated using my Ruby library) shows how the Earth differs from one of the most commonly used ellipsoid models (the WGS84 datum). Black portions represent parts of the Earth above, and white represents parts of the Earth below, the ideal ellipsoid (continental and island contours shown in red).

You can see that India is below the WGS84 ellipsoid with the southern part being the absolute minimum (almost -100 meters!) and Europe is above it.
Since low quality GPS devices don’t employ any such datums, they are really just computing the elevation assuming a perfect ellipsoid. Hence, their consistent inaccuracy.
Detecting and correcting GPS elevation errors
In GPS app development, detecting that a device that recorded our track has these types of errors can be done using the Earth Gravitational Model EGM2008 dataset, also sometimes referred to as the “geoid undulations” dataset. With EGM2008, we can approximate the difference between the actual earth surface and the ideal ellipsoid.
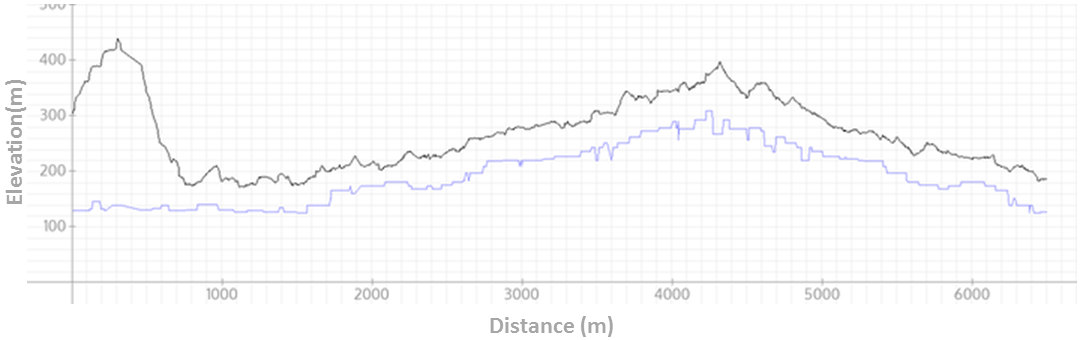
But to know if our GPS track has this error we need one more thing – the real elevation. A public database that can be helpful for this purpose is the Shuttle Radar Topography Mission (SRTM). SRTM is a raster-based database that provides elevation values at a resolution of roughly every 30m (at the equator) for the USA and every 90m for the rest of the world. For example, when computing SRTM values for points in the above track, a different graph (the blue line) emerges:
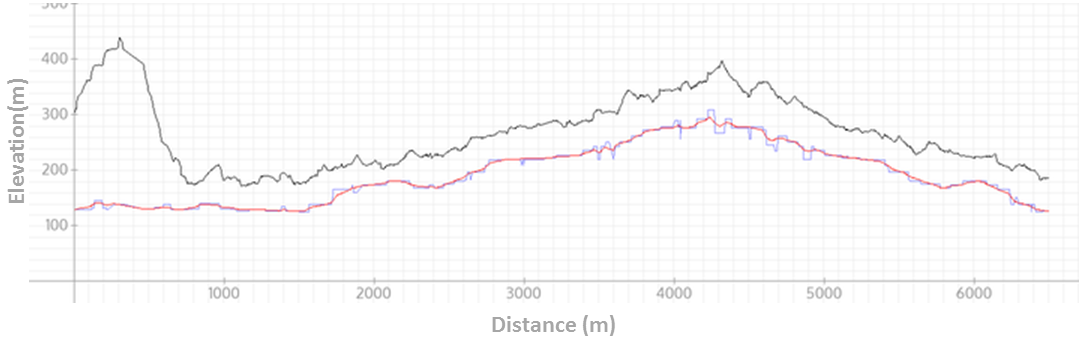
A small annoyance here is the rough edges of the the graph, but this is easily smoothed. Note that by smoothing we lose little (if any) precision, since SRTM itself is only providing discrete points at equidistant positions, between which we need to interpolate in any case. Here’s a version of the preceding graph with a red line overlay representing the smoothed SRTM data:
All of this can be done easily, incidentally, using my GPS Python libraries:
- srtm.py: a python parser for Shuttle Radar Topography Mission (SRTM) elevation data
- gpxpy: a simple python library for parsing and manipulating GPX files (GPX, the GPS Exchange Format, is a lightweight XML data format for GPS data)
For Ruby users, there’s also my Geoelevations.rb parser library for SRTM and EGM2008 undulations.
Having detected these anomalies, depending on the type of software we are working with, we can either (a) auto-correct the errors ourselves or (b) simply inform the user that inaccuracies have been detected in their elevation data.
Also, since there are different algorithms that can be used to programmatically correct for these GPS elevation errors, we may want to give the user the option to select which algorithm to employ (e.g., does the user want us to just use the smoothed SRTM data “as is” or does the user want us to use the SRTM data to help correct the elevations reported by the device).
Smoothing the track and removing outliers
If a football player were to wear a GPS device and record a game, the resulting track would be a mess. The playing field would be densely filled with a track consisting of lots of sharp turns, accelerations, and decelerations.
Fortunately, most cases where people use GPS will not have this same pattern – GPS track lines (and accelerations) will be relatively smooth. In such cases, erratic points in our track can be presumed to be error-induced and such outliers can therefore be reasonably removed with a smoothing function.
As a GIS developer, smoothing is most commonly achieved by iterating through the points and changing the coordinates based on the values of the neighboring coordinates. For example, we can change every latitude and longitude with an algorithm such as the following:
points[n].latitude = points[n-1].latitude * 0.3 + points[n].latitude * .4 + points[n+1].latitude * .3
points[n].longitude = points[n-1].longitude * 0.3 + points[n].longitude * .4 + points[n+1].longitude * .3
The bigger the coefficient, the bigger the impact of the corresponding neighboring point o the modified location of the current point. The coefficients I use in this example (0.3, 0.4, 0.3) are somewhat arbtitrary, but in most cases you will want their sum to equal 1.0. (A more sophisticated approach, for example, would be to use the distance between points and then, the closer the point, the bigger the corresponding coefficient.)
Here is an example of a track with lots of random errors:
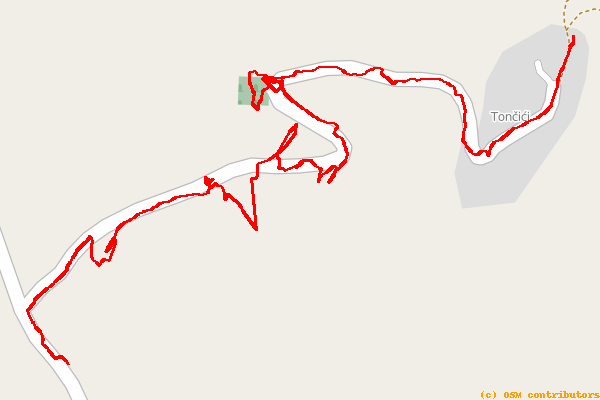
Note how the track does not follow the path well, has lots of sharp and jagged turns, and sometimes veers entirely off the expected path.
After a few “smoothing” iterations, this same track is transformed to:
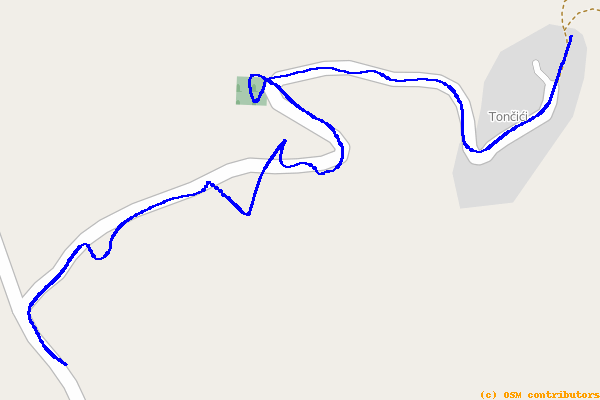
While that’s much better, it is still admittedly imperfect. Note that there are still places (particularly near the middle of the path) where the track still veers off the road.
There are other things you can try. In certain regions, and for certain GPS applications, you can also use the OpenStreetMap (OSM) data to try to guess the right path and then “snap” the points to this new line. While this can often be helpful, it can also be imperfect, such as in cases where the OSM data contains two parallel lines (for example a highway and nearby road) or many close paths.
In such cases, a possible solution would be to try to detect the type of the activity, using some of the techniques discussed further on in this article. If we can deduce, for example, that the track was a hiking track and have an option to snap to a highway or a nearby path, we can safely assume that the hike was along the path and not the highway.
Also note that, while this example demonstrates smoothing of surface coordinates (i.e., longitude/latitude), smoothing can be an equally valid technique for eliminating aberrations in elevation or temporal data, or even in heartrate and bicycle cadence data.
Examples of additional benefits and uses of smoothing could include:
- Computing total elevation gain. To compute the total elevation gain in a track it is not enough to just sum all the small “jumps” uphill because they will often contain small errors. Smoothing the elevation before doing the sum can often help alleviate this issue.
- Outlier removal. After “smoothing”, points which are too far away from the track can be more easily detected. These can often then be assumed to be outliers and the user can be prompted to ask if they should be removed.
There is one kind of problem where this algorithm falls short: in some cases the GPS will record a smooth path, but the path will be “shifted” by a constant difference in some direction. In such cases, smoothing may further smooth the line but won’t correct this shift error.
An additional less obvious, yet significant, issue with the simplistic smoothing technique we’ve described is that the transformation modifies all (or almost all) points in the path, even those which may not be in error. Although this simpler approach tends to be a reasonable solution for the average GPS user, more sophisticated smoothing algorithms are certainly employable in GIS programming. In some cases, it may even be better to simply remove outliers without performing any smoothing depending on the user, device, and application.
Detecting maximum speed
Detecting the maximum speed of a track is fairly simple if we have the coordinates and timestamps of all points on the route. Just compute the speeds between points and find the highest value. Seems straightforward.
But remember, we’re dealing with low-end GPS devices and we don’t fully trust the data, which can have significant ramifications for our calculation. If a device records a location every 5 meters and at one point makes a mistake by misplacing the point by 10 meters then that part of the track may seem to be 3x faster than it was!
One common approach in the GIS development world is to extract all the speeds between points, and then just remove the top 5% (i.e. use the 95th percentile) hoping that the eliminated 5% represent the majority of the errors. But this is admittedly unscientific and does not ensure correct results. In my experimenting with this technique, I tried different values for percentiles and found that some worked well for one GPS device some worked well for others. Some work well for hiking and others for bicycling. But in most cases, the results just didn’t feel right to me.
After trying many algorithms, what did work for me was simple: to add another filter to remove extremes, not only by speed, but also by distance, as follows:
- Sort points by distance between neighbors and remove the top 5%.
- (Optional:) Smooth the track (horizontally and/or vertically).
- Sort points by speed between neighbors and remove the top 5%.
From my experience, this algorithm yields fairly credible results, even for tracks from cheap GPS devices with random errors.
Deducing activity type
In many cases, average speed is sufficient to determine the activity type. If the average speed is 5kmh, for example, it is probably a walking/hiking track, whereas if the average speed is 30kmh, it is probably a cycling track, and so on.
But if the average speed is 12kmh, you can’t be certain if the user was mountain biking or running. In such cases, the maximum speed can sometimes help differentiate between the two types of activities. Specifically, we can use the fact that runners rarely reach a speed more than twice their average, while cyclists do so regularly (e.g., while going downhill on a not-too-challenging path).
Accordingly, a track with an average speed of 12kmh and a maximum speed of 18kmh was probably recorded while running, whereas a track with an average speed of 12kmh and a maximum speed of 30kmh was probably recorded while mountain biking. (Of course, we must be sure that our calculated maximum speed is right, in order for this to work reliably.)
Percentage of visible sky: A clever proxy for GPS error detection
The precision of each GPS measurement (i.e. latitude, longitude, and elevation) very much depends on the number of satellites which were visible at the moment of recording. So if we could somehow determine how many satellites were “in view” at the time of each recording, we could use that as a way of approximating the accuracy of that recording. If we somehow knew, for example, that all needed GPS satellites were in view, we could assume a high degree of accuracy for the corresponding GPS data. Conversely, if we somehow knew that no GPS satellites were in view, we could assume the data to be error-prone.
But before you get too excited, consider the complexity of attempting to solve such a GIS problem. First of all, you would need to know which GPS satellite system(s) your device was capable of communicating with. There’s the original USA-based Global Positioning System, the European Gallileo, and the Russian GLONASS system. Some devices work work with all of these satellite types, but many do not. And many devices don’t even report which system(s) they use.
But there is a clever way to circumvent this complexity and achieve a crude approximation of the number of satellites in view: use the percentage of visible sky as a proxy for the number of visible satellites. Less visible sky means that our GPS can “see” (or be seen) by fewer satellites. But how can we calculate the percentage of the visible sky on any point on Earth? The solution is actually quite simple: we can calculate the horizon line around us using the SRTM data discussed previously.
For example, this is the horizon if You are in the valley bellow Triglav (the highest peak of Slovenia) as computed using SRTM:
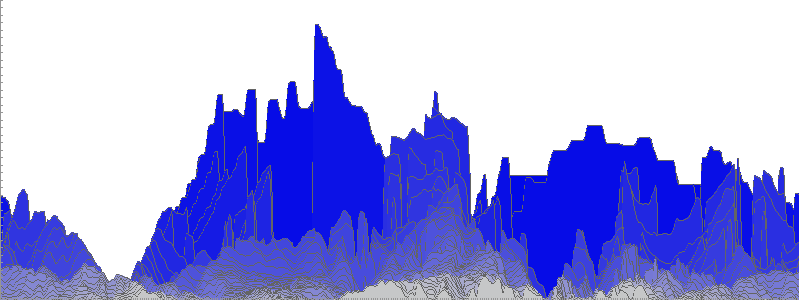
(For those interested, my code to create this image can be found here.)
This image is basically made of layers of equidistant elevation graphs as seen from a central point. The darker the blue area, the more distant the elevation layer; the lighter the blue area, the closer the elevation layer. The highest points drawn represent the horizon line. If a GPS satellite is below this line in the sky, our device probably can’t see (or be seen) by it. (Note, though, that although the image is drawn as flattened rectangle, in reality you would need some basic knowledge of spherical geometry to properly compute the area below the horizon.)
Another thing to keep in mind is that this is no silver bullet for detecting GPS elevation errors. First of all, most parts of the Earth are not mountainous and, even when they are, it is in our psychology to overestimate elevations; the actual percentage of the visible sky is greater than 75% in the vast majority of inhabited regions. But nonetheless, this method can be helpful in certain situations, such as mountain hiking where you may go from being in a deep canyon (with poor GPS reception) to being on a mountain ridge (where the satellite reception is probably much better). While this method is not an absolute measure of how many errors the track has, it can be a useful indicator of which parts of your track may be more error-prone than others.
Wrap up
We’ve discussed some of the more common types of GPS tracking errors to expect with low-end GPS devices. We’ve provided an understanding of what causes them as well as some GIS programming techniques for correcting them.
In some cases, we can correct the track with a high degree of confidence. In other cases, we can at least alert the user to portions of the track that appear questionable. In cases where we are unsure, there is always the option of enabling the user to fix the track himself, aided by aerial imagery and maps. Our probabilistic guesses can help highlight those portions of the track where we’ve detected a higher probability of errors.
In many cases, the techniques we’ve outlined can be a satisfactory “80% solution”, providing users of low-end GPS devices with a reasonable level of automated improvement of the accuracy of their GPS tracks.
Tomo Krajina
Poreč, Croatia
Member since February 5, 2014
About the author
Tomo is a Java, Android, and Golang developer with 13+ years of experience. He has worked on telecom, and banking systems.
PREVIOUSLY AT