Android DDMS: A Guide to the Ultimate Android Console
There is no way around application diagnostics. No matter how good your code is, you will need to be able to monitor and study system behavior. This is where Android’s DDMS shines.
In this article, Senior Android Engineer Gilad Haimov explains how veteran Android developers leverage the potential of DDMS to improve app stability and performance, test new features, diagnose, and debug their code.

Gilad has 19+ years of Android experience in developing mobile, server-side, and communication systems.
Expertise
PREVIOUSLY AT

Developing is a tricky business. The target keeps moving, new technologies and domains periodically come to life, new tools pop every now and again, and languages change in what seems to be managed havoc.
Still, even with all these changes, the fundamental rules stay the same. One of the most important of these underlying rule states that to create really awesome software, you must gain deep, ongoing and detailed introspection into your executing system. Diagnostics, debugging, and profiling are terms sometimes used in this context, but the rule goes deeper. A top-notch developer literally “feels” his system. He knows what will cause is to chunk waiting for more memory to release, what will run its threads into CPU starvation, which actions will result in extensive I/O or network access hence will slow its entire operation.
There’s really no way around it. You could be a very smart developer writing awesome code, but, until you will not have the above skill, namely being able to monitor and study the details of your system’s runtime behavior, you will still fail behind when it comes to delivering really top notch applications.
In fact, after gaining some experience, you will detect a whole category of “code diseases” which can be traced to neglecting the rule of introspection: Briefly put, writing code (sometimes smart code) without continuous monitoring of its effects on the actual platform.
DDMS in Android: My Weapon of Choice for Introspection
Fortunately for us, the Android community had managed to deliver so many top notch introspection tools. Facebook’s Stetho is amongst the best, AT&T’s ARO (“Application Resource Optimizer”) is a somewhat older but still top-notch, with probably the best network monitoring console out there, while LeakCanary takes a way more limited approach concentrating (and doing great at it) on runtime memory leak detection library. Long story short, there is no shortage of Android debugging tools out there.
Still, the diamond in the crown, the introspection tool to trust when crucial, accurate, and well formatted data needs to be extracted regarding the runtime behavior of your app is still the good old Dalvik Debug Monitor Server (DDMS) in Android Studio, which has been with us (alas underused by so many teams) since the days of the Eclipse Android plugin.
How important is DDMS in Android development? Well, knowing what I know now about DDMS and mobile app monitoring in general say 5-6 years ago, as a less experienced Android developer, would have saved me a lot of headaches and nights of debugging.
And the thing is that DDMS is so simple to master!
Of course, a large portion of using it correctly, as with any other software tool, comes with experience. You need to hone your professional skills for some time until you become really good at runtime performance monitoring. But even in a matter of hours, say after reading this article, if you follow my suggestions and apply them on your next app, the results will be amazing! Profiling and tuning even complex systems is not that hard. It can be fun as well!
A question often gets asked regarding the difference between novice and master-level mobile developers. Mastering DDMS in Android—or in general terms, application profiling and introspection capabilities—is one such major difference.
Note: A major portion of becoming a top notch developer is using the best libraries available in your domain. In a prior Toptal article, I listed some of the best developer libraries available for Android. In a sense, this article is a sequel to the “library” article and covers one of many Android tools. Needless to say, if you aim to improve your Android developer skills, read it now!
A Quick Guide to DDMS in Android Studio
And now, without further ado, let us now delve into the description of DDMS, one of the ultimate Android developer tools.
When weighing effort against benefit, probably no other tool can improve the quality of your app and help you in locating the really messy and elusive bugs it may contain. But still, for some reason (laziness, anyone?), so many teams fail to use DDMS.
Let’s start with a crash course in DDMS:
DDMS is accessible via Studio > Tools > Android > Android Device Monitor and clicking the DDMS button on menu. You can also place is as a shortcut icon (I do) in your upper panel.
Once opened, this is what you’ll see:
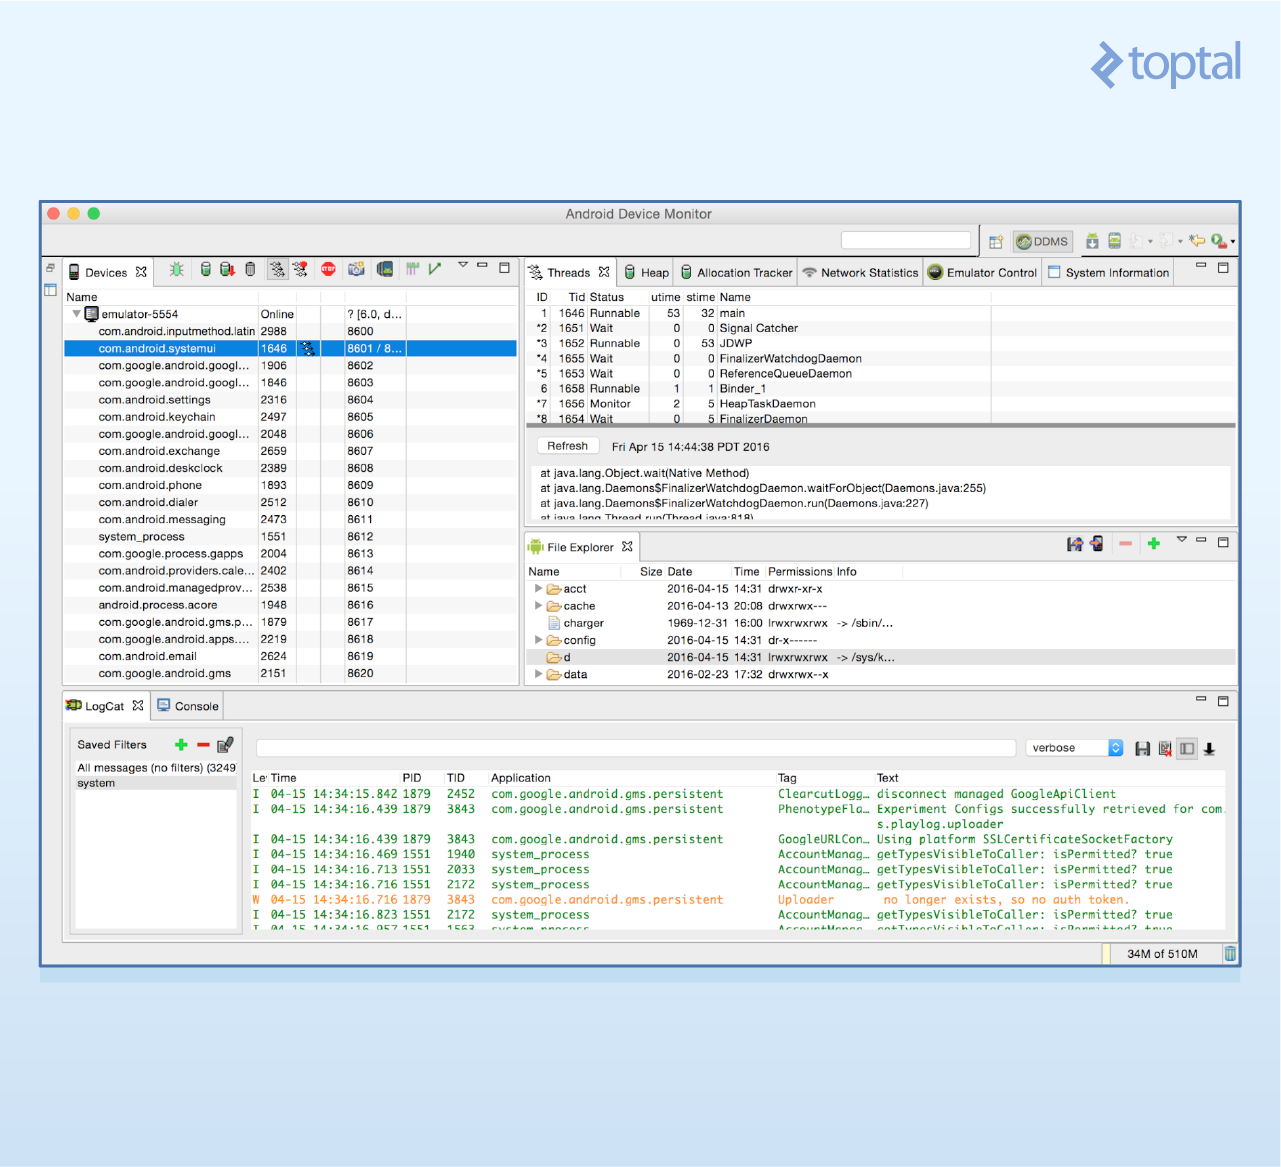
The left panel allows for device/app selection and the right console provides you will multiple views, each in its own tab, each exhibiting a specific view of your app.
The main services provided by Dalvik Debug Monitor Server are:
- App memory usage statistics (total heap and object allocation statistics)
- App thread statistics
- Device screen capture
- Device file explorer
- Incoming call and SMS spoofing
- Location data spoofing
- Logcat
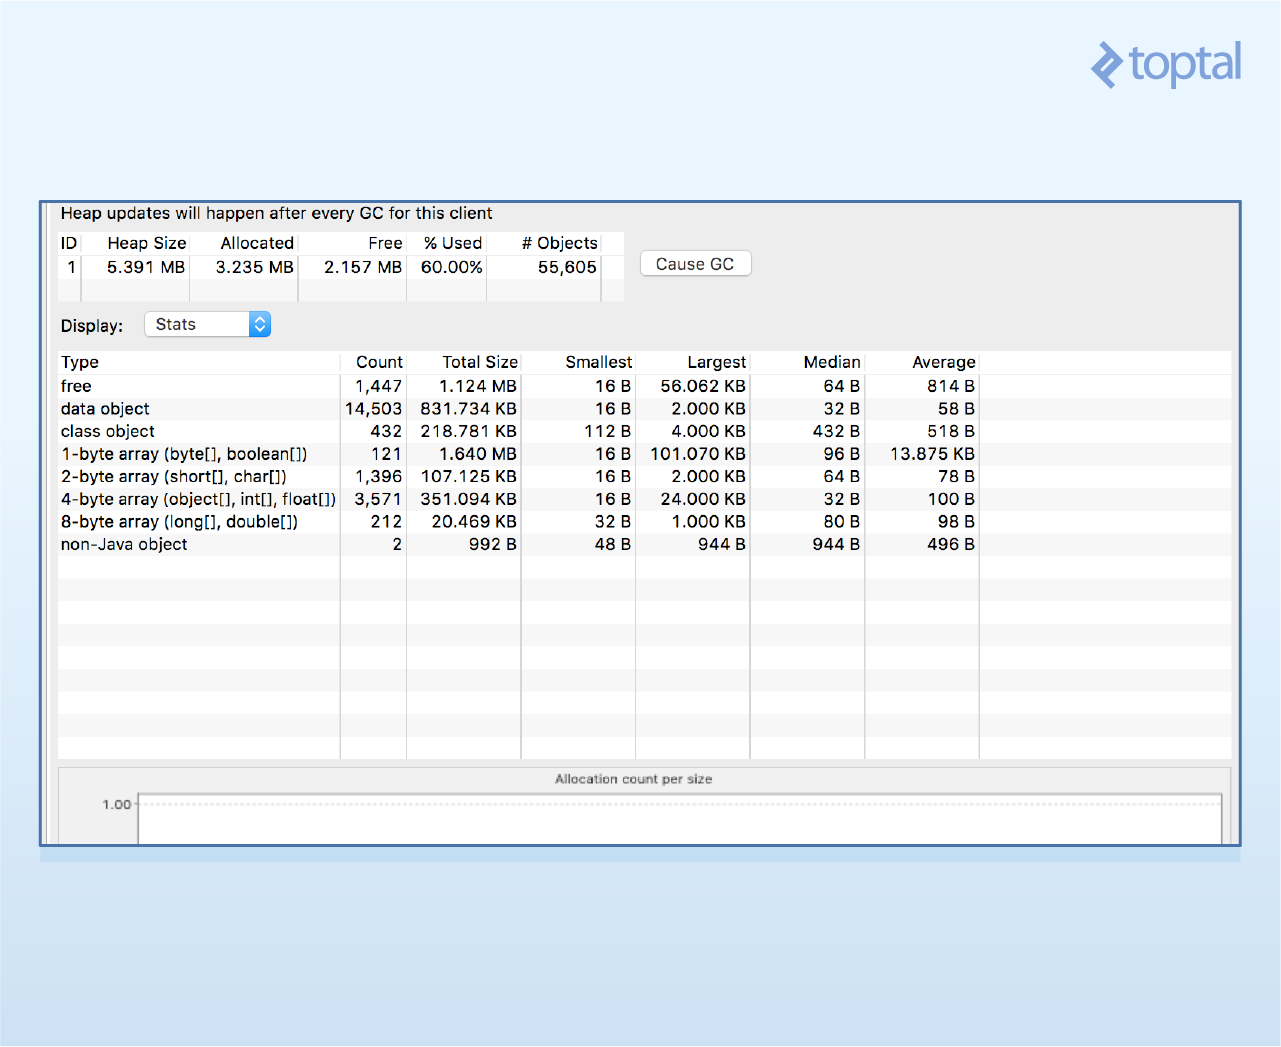
To obtain the current heap memory value used by your app, simply do as follows:
- Connect the device on which your app is running
- Click the Update Heap button to enable heap stat gathering
- Open the Heap tab
- Click “Cause GC” to force a GC run. Only after such run will the heap data collection commence
- Keep the tab open, continue working on your app, and periodically re-click “Cause GC” to refresh heap stats data
This last line probably requires additional explanation. Memory usage is one of those analytical values where its dynamics are way more important than the initial value. For most apps, we will not care much about the initial heap usage value. We will care very much about the progress of this value, as it will provide us with a clear indication of one the true nightmares awaiting mobile developers—Android memory leaks:
My usage of the heap stat module is simple; as part of the lifecycle of developing the app, after introducing changes which should impact heap usage, I will activate the module, “Cause GC” to init stat gathering, activate (usually more than once) the heap-intensive positions of my app, and periodically “Cause GC” to refresh. If the heap usage keeps growing, I have a memory leak on my hands and I need to solve it (details on how - below). If not, and regardless of the actual heap size, I’m good.
If a memory leak is detected, the next tool I will use is the Object Allocation Tracker. Let’s see what it can do for memory management in Android.
Object Allocation Tracker
The allocation tracker, simply put, will provide you with the information required to figure out who’s the party to “blame” for the current heap size. This module will tell you from which threads and methods did the allocation commands came from in a real-time manner, making it invaluable for memory analysis in Android.
To commence tracking, do as follows:
- Select the relevant device/process as before
- Switch to the Allocation Tracker tab and click Start Tracking to begin.
- From here on all new allocations will be tracked
- Click “Get Allocations” to get a list view of all latest allocations (latest since last “begin”)
- To find out who the allocation authority is, click a specific line in the list

Now, from my own experience, performing allocation-intensive actions on your app followed by clicking “Get Allocations” to view allocation counters should typically direct you to the leak in a straightforward manner; sometimes, either when the leak is non-linear (i.e., happens every now and again) OR when your app contains multiple leaks that might not work. In such cases, and I have not encountered many of these, you will need to resort on manually creating a dump HPROF file and analyzing it. Memory analysis and Android memory management will not be covered in-depth in this article. See here for some leads.
Thread Info Console: Android CPU Usage Made Easy
Well known to any developer, synchronous paths of executing logic are grouped into threads, each making up one serial flow of execution within your app. Literally all apps use more than a single thread of execution. Some of them use dozens.
An overall examination of potential problems when using threads is way out of the scope of this article. Let us concentrate then on a single one, namely thread starvation, which is the main problem you would visit the thread info console for.
In all mobile applications, different threads will compete for CPU time. There are simply not enough of those to go around. What happens if, for any reason, one or more if these threads will not get the execution time that they need? Usually bad things. The system will not behave as you planned it to behave, which is always a bad idea. Potential reasons for this problem could be setting low priority, other threads simultaneously executing setting themselves with overly high priority, spending long time on synchronization monitors, and more. All notoriously hard to detect by code review alone.
Android DDMS thread console to the rescue!
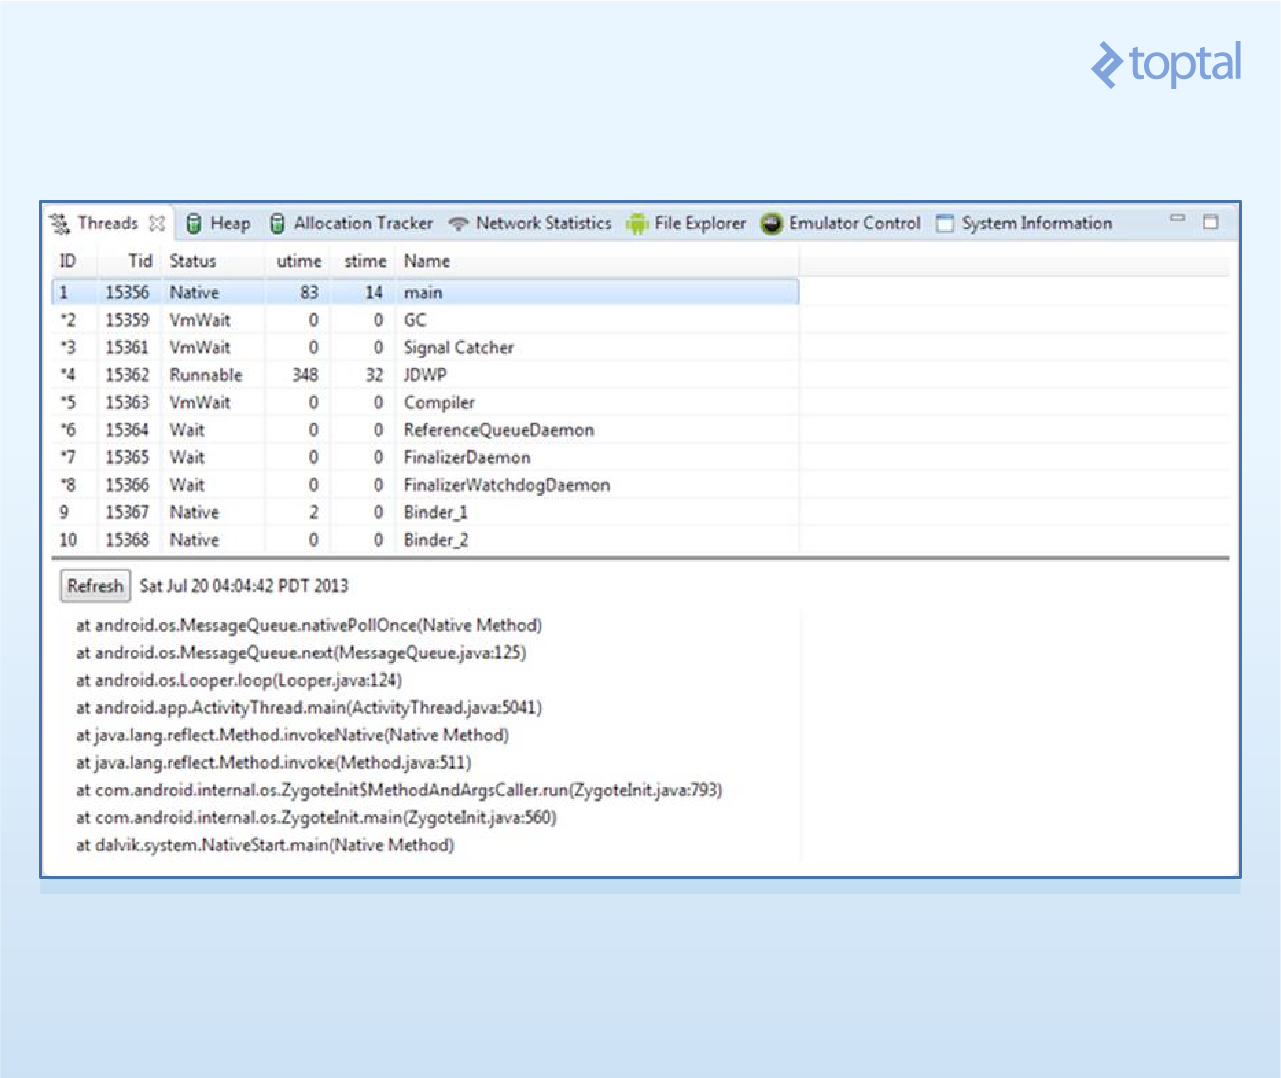
As you enter the thread view, you will see a list made up of thread records, each containing the thread’s name and ID, and two additional counters called utime and stime. Utime measures the total time spent by the thread executing user code (think your functions and third-party libraries), while stime measures the total time spent on system code (sleep, synchronize, system calls—the lot). The pfirst one—utime—will usually be more interesting for us, though I can think of problems that will mostly manifest themselves by the stime counter.
OK, we have our code running, including several threads, and we want to make sure all of our threads get their share of CPU time. For this, we first let our system run for a while, and then open the thread tab and start looking for “peculiar” utime values. Zero can certainly represent a problem—the thread got literally no CPU time and no CPU utilization. But overly high values might represent a different aspect of the same problem: namely, threads whose priority is so high as to cause others to starve.
Note that for one type of threads, zero or near zero utime value will not indicate a real problem. These are the I/O bound threads, threads that mostly do networking or disk (or database) access. These threads should spend most of their time either waiting for data to arrive or blocking on pending system calls, neither of these actions increases the utime counter. Know your threads!
Tip: Never use thread’s default name. It means nothing and you will typically fail to detect it in the DDMS views. instead, whenever creating a thread or fetching it from a thread pool, start your interaction by assigning it with a self-explanatory name. This will make your life way easier than debugging/profiling your system. I usually prepend the app’s name so to distinguish between Android generated thread and those spawned by my own code, example: MyApp-server-connector, MyApp-db-interactor, etc.
Tip: A thread’s priority denotes (loosely speaking) the amount of CPU time it will be granted by the scheduler. The priority assigned to your worker threads are of critical importance to the overall performance and “smoothness” of your app, and in many cases can be the difference between slick fast behavior and a bumpy slow one. The rule here is simple: The default priority assigned by Android, which is NORMAL=5, is almost always not the one you want to use. Instead, for most worker threads, you want a way smaller impact on overall CPU usage. To do this, at a thread’s startup, set its priority to a lesser value, I usually go with priority=3.
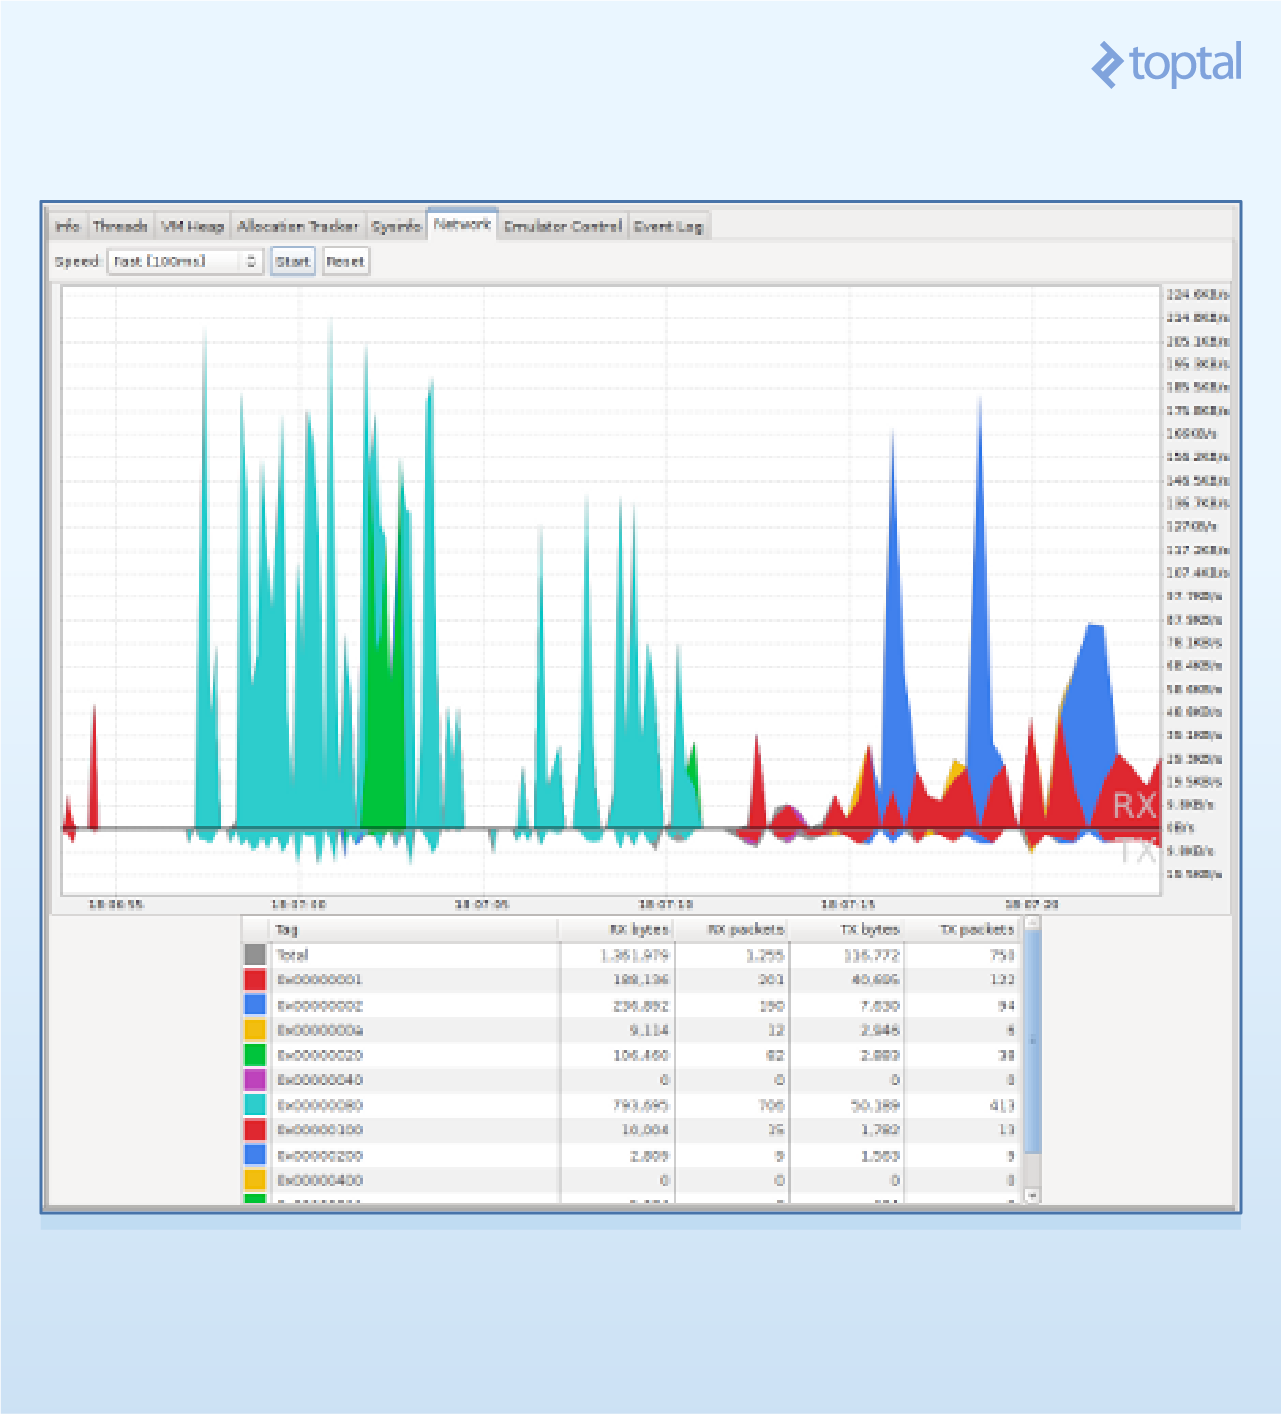
Network Statistics Console
Network statistics is about allowing you to monitor both incoming and outgoing communication channels to your app in a reasonably human-readable manner.
The y-axis in the network chart represents the transmission’s transfer speed measured in KB/second, while x-axis represents elapsed time in seconds. Therefore, to obtain a quick estimate of the transmission’s size, try to estimate the area of the relevant spike. After a while, this becomes rather easy.
Note that, after this console is entered, you will need to click the upper “enable” button for network measurements to start appearing.
Before the network console had matured to the level it is at now, developers usually had to resort to using sniffer apps (some still do) to obtain similar information.
The great thing about this console is the way it visualizes one of the major battery draining behaviors—that of ongoing small-packet size communication. As many of you know, what will make your app a battery drainer is not the five minutes of intensive networking that it does, but rather the long periods of short, repeating networking e.g., for the sake of keepalive, diagnostics, or status updates.
Once such a pattern is detected, and the visual packet display of the network console makes it ever so easy, immediately think batching. Can I batch multiple small transmission into a single large one? The battery impact of this change is bound to move apps from a battery-drainer to a well-behaved category!
Tip: Never load an image into memory as is. This is an out-of-memory crash waiting to happen. Instead, perform scaled-down loading, or even better, use a third-party library to manage the scaling for you.
Although you will rarely use this information, note that the DDMS relies on the Android Debug Bridge (ADB) stack to pass data back/from the device. If the DDMS fails to show your app, or freezes in the middle of a DDMS session, your best bet will be to open a console and type:
adb devices
to make sure your device is accessible and authorized with ADB. If the is not the case, in many instances, restarting your local ADB server should solve the problem:
adb kill-server
adb devices     #  restarts the adb server and displays all detected devices
If you’re still having problems and your app is installed on a physical device, try to disconnect all emulator instances. Why? Because DDMS connects itself to both physical devices device and emulator instances, the default being the latter.
Example of real life DDMS Usage: An app halts (not crashes, just halts). The user immediately rushes to nearby workstation, connects to USB, and opens DDMS in thread view to find out the thread stack » failed thread » stack trace—in my case, due to synchronization deadlock that, once detected, was easily solved by switching.
Tip: If the standard RAM memory allocated to your app by Android is not enough, as might happen for, e.g., media intensive apps, note that you can gain some 15-20% additional memory on most devices by raising the _largeHeap manifest flag: https://developer.android.com/guide/topics/manifest/application-element.html_
Device State Emulation in Android DDMS
As a rule, mobile apps are not linear constructs. Instead, they deploy awareness strategies that allow them to monitor and react to changes in the device’s state. An app can, for example, listen to incoming call or text messages, can realign its state according to the network state, and can track and react to changes in the device’s location.
A trivial example for the latter would be a GPS app. Most of us do not develop such apps (alas, the market is not big enough…) but still, in many cases, we do deploy logic, which is location dependent, whether it’s a simple map view of the user’s current position, route tracking, or a location-sensitive data display.
Testing for such state sensitive conditions is notoriously complex, sometimes more so than writing the actual code. If you have a physical device with SIM you can, of course, issue and receive calls and SMSs. Changing your device’s telephony status is way harder but still can be done. Test location changes could be trickier, though strolling around town with your laptop is an option…
But still—how would we handle emulator instances? How can we test them for these changes?
DDMS to the rescue, once again. One of the stronger yet often overlooked features of the DDMS is its ability to issue (“spoof”) mock events into a running emulator instance. DDMS can issue a call from a specific number to the emulator, send an SMS, change telephony status data, and more.
Once arriving into the emulator, all these spoofed events will no longer be distinguishable from “real” events, i.e., as if received by the underlying hardware sensors. Specifically, all of your relevant app’s receivers will be activated in the same manner they would have upon receiving a real call/SMS message.
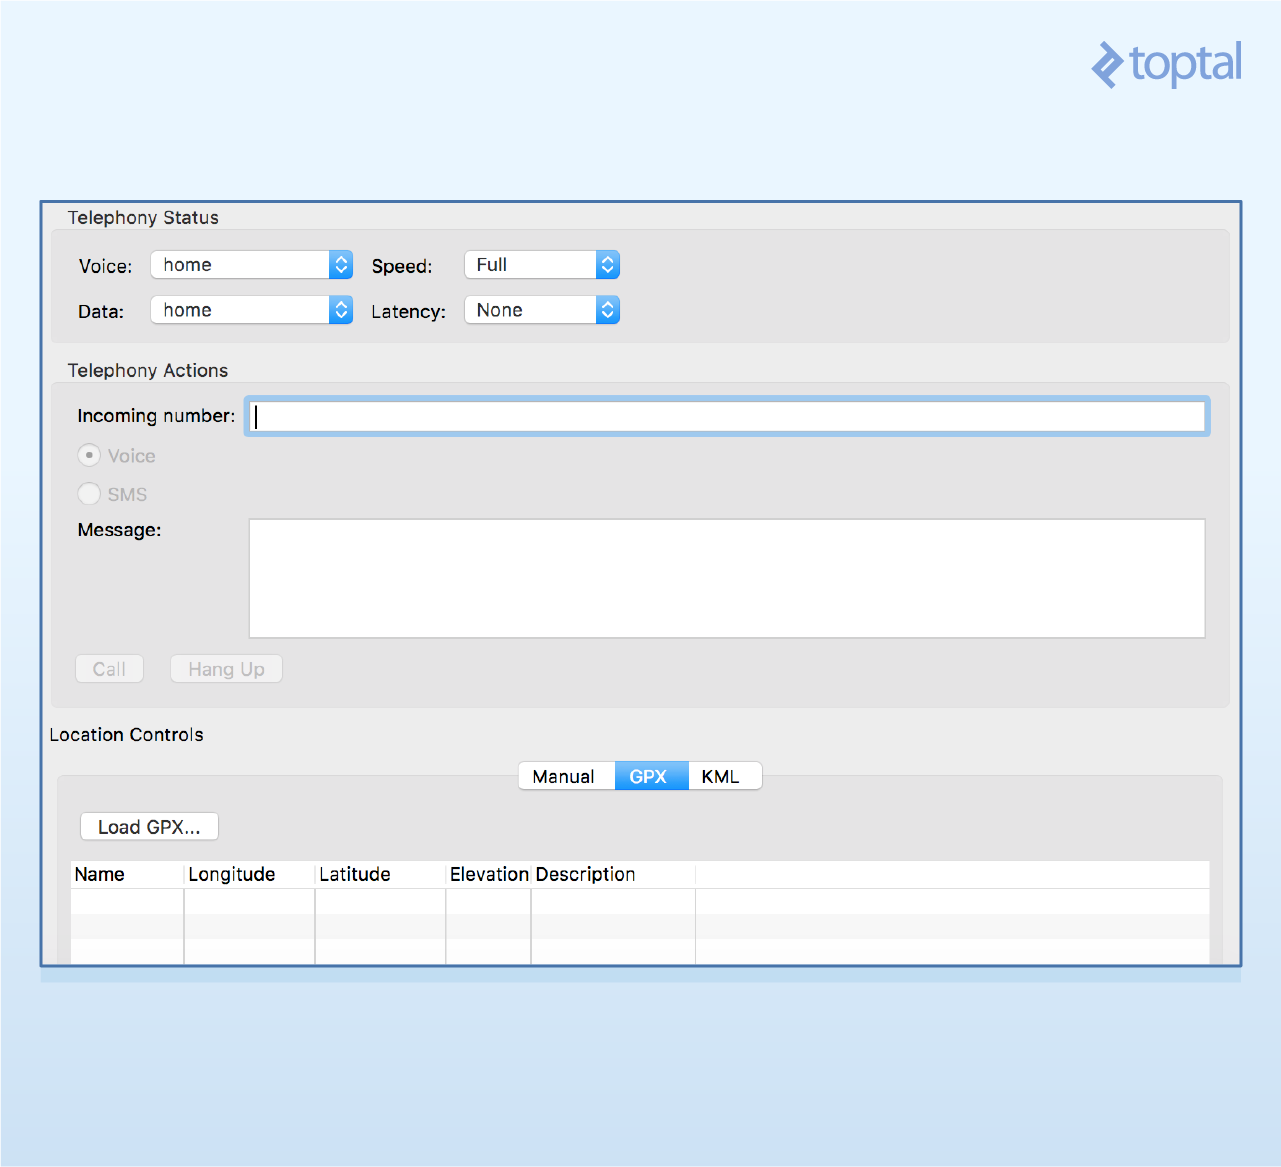
Activating the telephony status and actions is rather straightforward:
To test your app for cases of low network connectivity (which you should in any network-centered app) go to Telephony Status section and set the speed and latency values to the desired values. I usually go with the GPRS value for both as an effective way for emulating low connectivity, but feel free to set your own values.
To simulate phone calls or SMS, go to Telephony Action section, set the origin phone number, add a textual message if needed, and fire away. This tool is especially effective when you have set a dedicated code route for calls from abroad and want to test it on budget.
Things gets more interesting when it comes to mocking a new location.
If all you aim for is setting a new location for your emulator instance, choose Manual, set the desired latitude/longitude values, and hit Send.
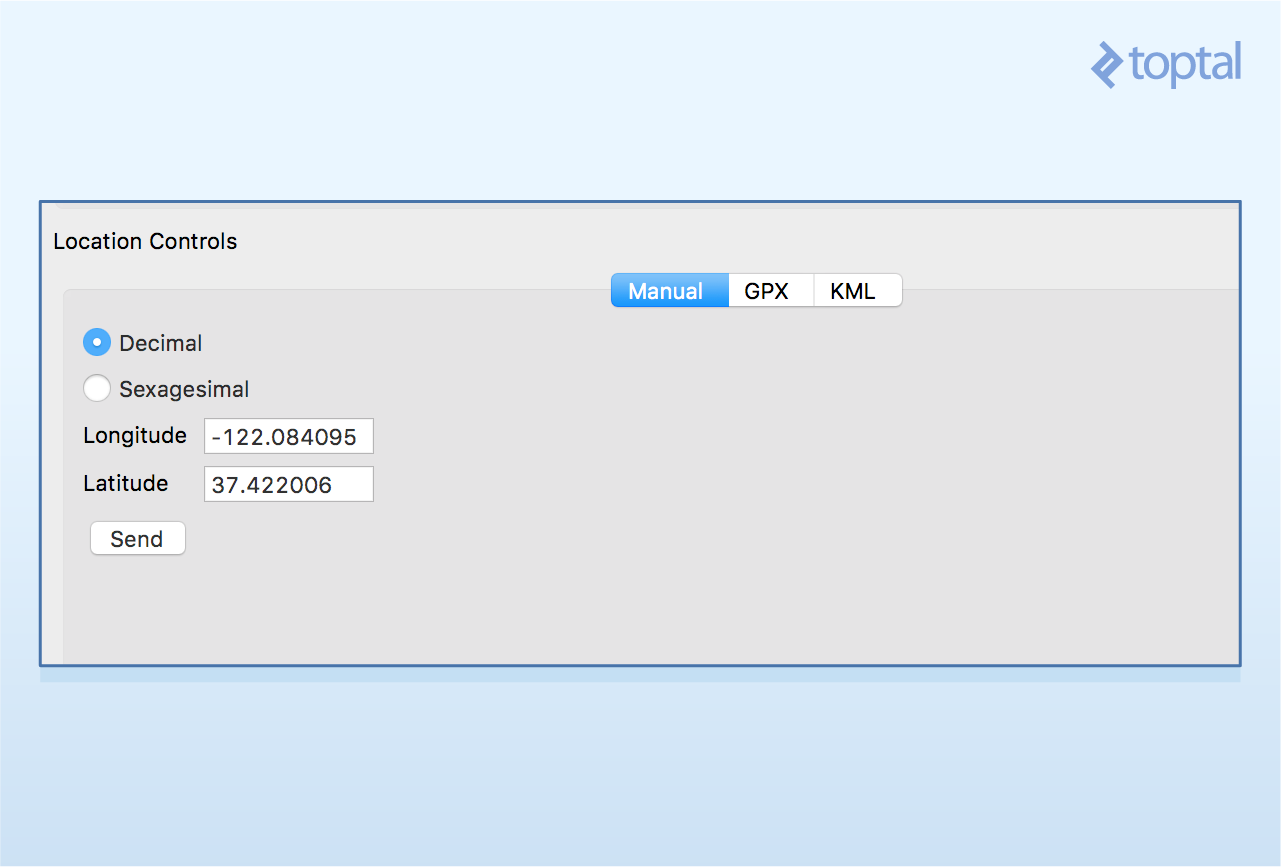
But what if, instead of setting one fixed location, you want your app to go through a pre-set route—say, examine its behavior as the user is traveling from one city to another? Such a test can have great value for any map-backed app as well as other location-sensitive apps which set their data window per user location. Here, you will want to see that location shifting at different speed will keep the displayed data window up to date.
For this, we will use a special format called KML, which was specifically developed to be used with Google Earth, and which represent routes, or paths, as a set of connected points in space, which can be by GPS enabled devices.
GPX is an alternative path format supported by DDMS. For all practical purposes, these two should be considered interchangeable when used for mobile location spoofing.
Let us now walk through the stages of setting a mock route into the emulator.
- Create a route. By far the simplest way would be to use Google Maps direction option setting the appropriate origin and destination.
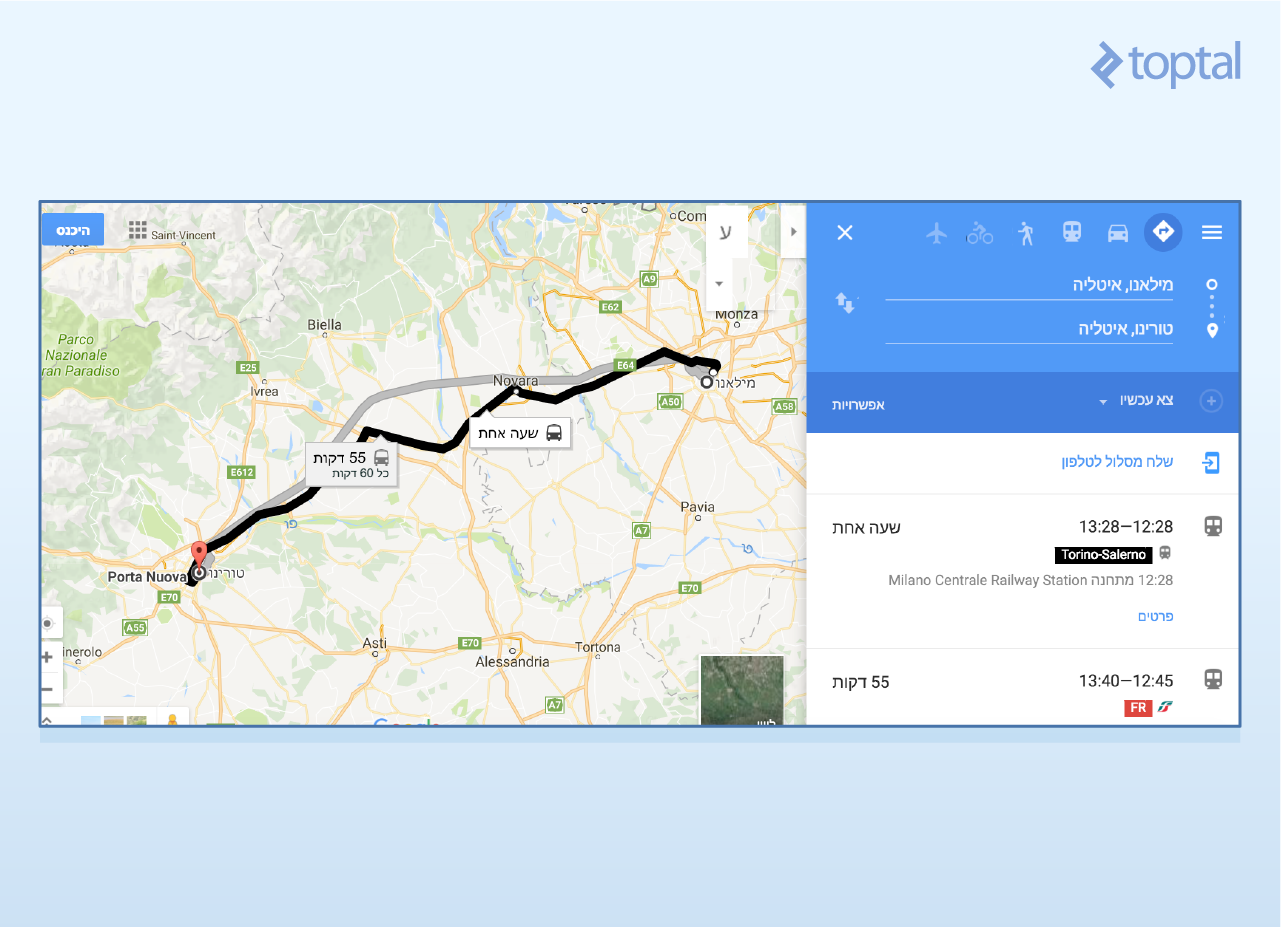
-
Once the route is displayed over the map, go to the address line and copy the URL
-
With the URL in the clipboard, go to the GPS Visualizer, paste it into the “Provide URL” text box, and click the Convert button:
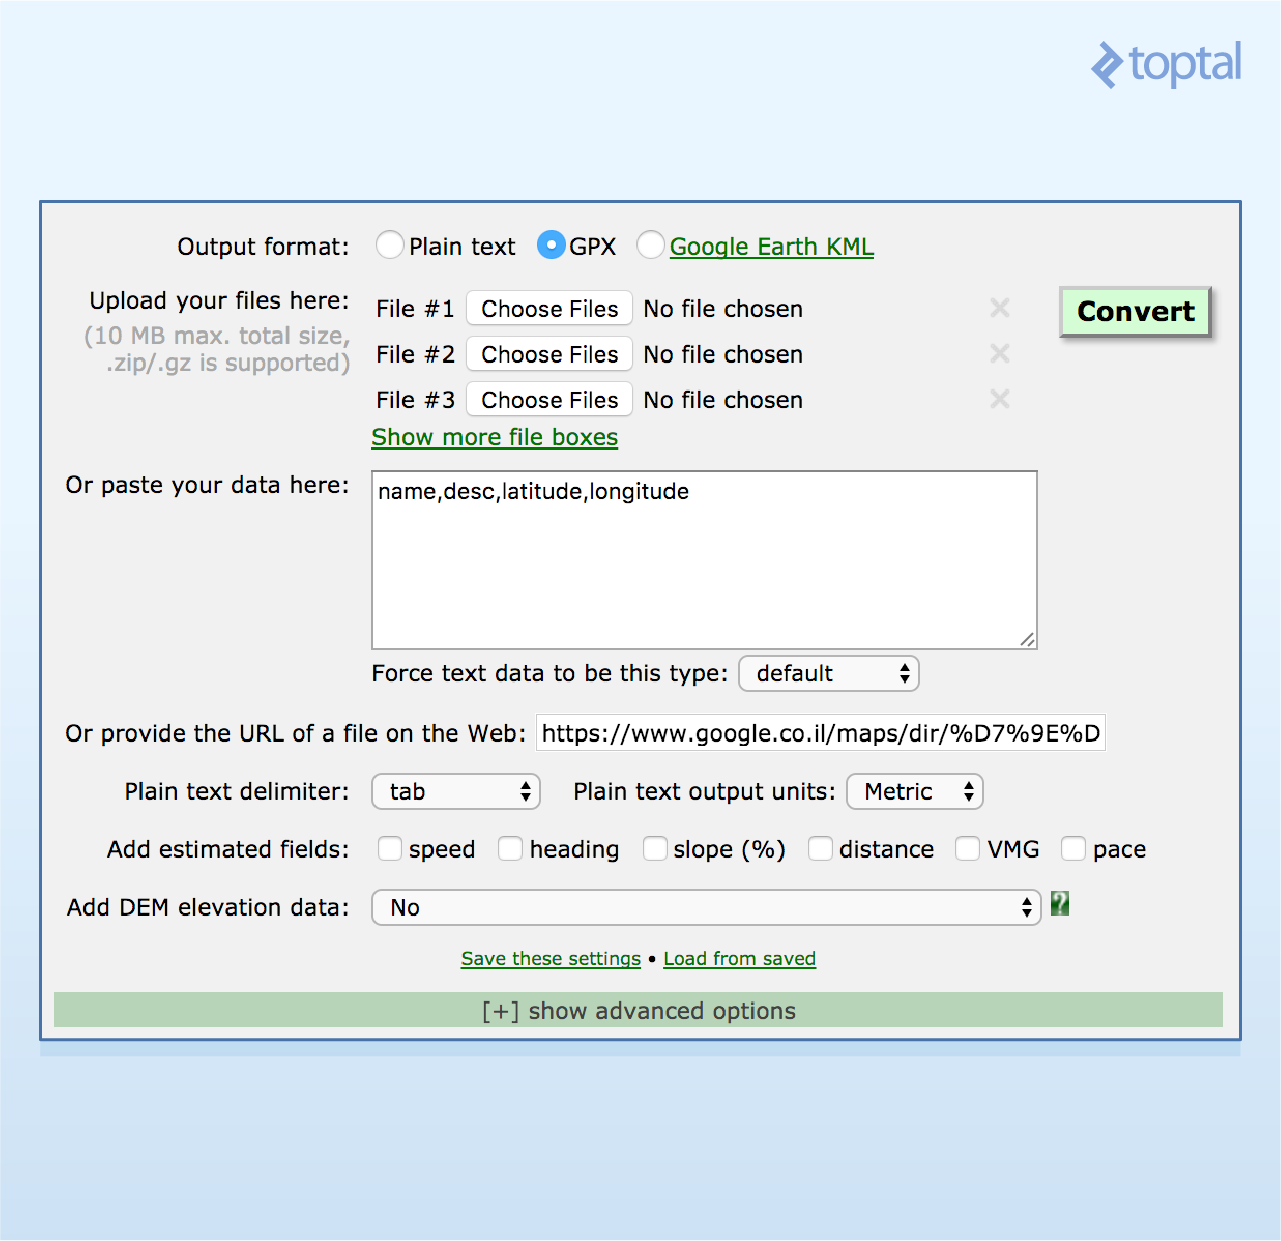
and click to download the resulting GPX file (with a somewhat messy name e.g., 20170520030103-22192-data.gpx)
- Going back to DDMS Location Control, open the GPX tab, click Load GPX and select the newly downloaded file
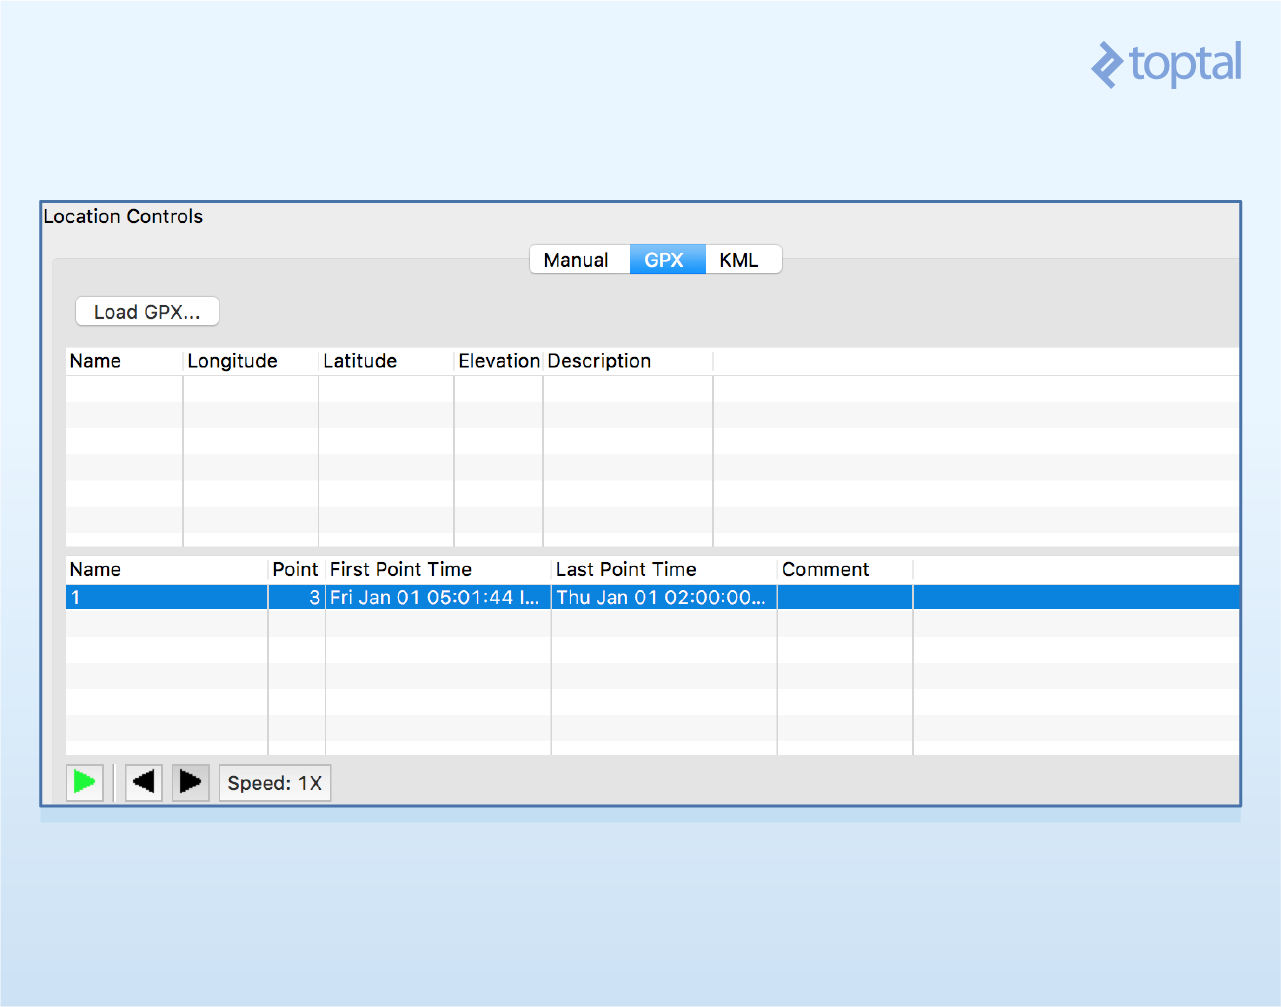
- We’re done! You can now navigate between the different route locations by clicking the back and forward buttons, or by clicking the Play button to automatically to through the route at a set speed.
You do not need to create your own route. Plenty of routes to download from site such as OpenStreetMap (see ‘GPS Traces’ section).
Finally, please note that unlike older DDMS versions, where route file loading was a breeze, newer versions might require some trial and error when loading a specific route.
For example it appears only GPX 1.1 is supported by DDMS. New GPX versions might require some manual adjustment.
Additionally, GPX waypoint format is no longer supported. Instead, use the GPX Track format:
<trk>
      <name />
      <cmt />
      <trkseg>
        <trkpt lat="27.0512" lon="-80.4324">
          <ele>0</ele>
          <time>2017-02-02T08:01:41Z</time>
        </trkpt>
      </trkseg>
   </trk>
Debugging Android: An Hour a Week Makes a Difference!
Enough theory! It’s now time for some practice. I suggest, assuming you are an Android developer, that starting on your next project you will dedicate just one hour a week for gaining introspection into your app’s performance via DDMS.
You will be surprised from the amount of quality information (i.e., information which may be used to immediately improve the state of your app) this will provide you with!
Android DDMS, as I’ve witnessed time and again with novice developers, is a tool that can greatly improve a developer’s capabilities, provided it is mastered and properly employed. The ability of an Android developer to deliver top-notch systems will literally go up a notch or two once they tap the full potential of DDMS in Android development. Therefore, setting aside a few hours to make good use of DDMS sounds like a clever investment, as it can greatly improve Android performance and efficiency.
Be one of the smart guys. Use it.
Understanding the basics
What is the use of DDMS in Android?
As part of Android Studio, DDMS is one of the most significant introspection tools available to Android devs. It’s used for debugging, diagnostics, and profiling.
What is Android Device Monitor?
The Android Device Monitor provides a user interface for multiple debugging tools. It’s a lightweight, standalone tool, so users aren’t required to install Android Studio or any other IDE.
What is Android Debug Bridge?
Android Debug Bridge (adb) is a command line tool designed to facilitate communication with an Android device. It’s used for debugging, installing apps, and accessing a Unix shell to run commands on the device.
What is the Android Device Manager used for?
ADM is used to to locate, ring, or wipe your device via a web console.
What is a Logcat in Android?
Logcat is Android’s internal log system for both apps and system modules.
Gilad Haimov
Tel Aviv-Yafo, Israel
Member since July 27, 2015
About the author
Gilad has 19+ years of Android experience in developing mobile, server-side, and communication systems.
Expertise
PREVIOUSLY AT