When Does it Make Sense to Use Google BigQuery?
What do you do when you come across a dataset that’s simply too big to allow fast queries? Google BigQuery could be part of the solution, though it’s no silver bullet.
In this article, Toptal Java Developer Maksym Goroshkevych explains how BigQuery can drastically improve query performance, and when you should and should not use it.
Maksym is an expert in back-end Java development and building up the front with Angular. He enjoys tackling complex, challenging projects.
Expertise
PREVIOUSLY AT

Over the course of my career, I have had to write complex analytical queries for different kinds of reports and charts. Most often, it was some chart which displayed data aggregated by date, week, quarter, and so on. Usually, such reports are created to help clients identify trends and illustrate how their business is performing at a high level. But what happens when data scientists and engineers need to create a much more extensive report, based on a big data set?
In case the report is based on the small set of data, the task can be solved by writing an SQL query under a relational database. In this step, it is important to know the basics for writing queries and how to make them faster and efficient. However, sometimes the report depends on a larger set of data (e.g. millions and more rows in a table), but the report is not dependent on input variables (parameters), or you may find the number of values is quite small. In such scenarios, an SQL query can be slow, so it would not be optimal for users to wait until the query is executed. The most common practice in such cases is to run a query ahead of time–before the client requests a report.
Also, it requires implementing some caching functionality, so the client can take data from the cache instead of running a query in real-time. This approach works perfectly, provided you don’t need to show real-time data. It can show data calculated an hour or even a day earlier. So, the actual report/chart is shown using cached data, not based on real-time data.
Turning to Google BigQuery
While I was working on an analytical project in the pharma industry, I needed charts which were taking the zip code and drug name as input parameters. I also needed to show some comparisons between drugs in specified regions of the United States.
The analytical query was very complex and ended up running around 50 minutes on our Postgres server (quad-core CPU with 16 GB RAM). I was not able to run it ahead of time and cache the results, as the query was taking zip codes and drugs as input parameters, so there were thousands of combinations, and it was impossible to predict which one client would pick.
Even if I wanted to try to execute all input parameter combinations, my database would have most likely crashed. So it was time to choose a different approach and pick some easy to use solution. That chart was important for the client, however, the client was not ready to commit to making big changes in the architecture or migrate to another DB entirely.
On that particular project we tried a few different approaches:
- Vertical scaling of the server (adding RAM and CPU to the Postgres server)
- Using alternative DBs such as Amazon Redshift and others.
- We also researched a NoSQL solution, but most of them are quite complex and require a lot of changes in architecture, many of which would have been too big for the client.
Finally, we tried Google BigQuery. It met our expectations and allowed us to get the job done without making huge changes that the client would be reluctant to approve. But what is Google BigQuery and how does it perform?
BigQuery is a REST-based web service which allows you to run complex analytical SQL-based queries under large sets of data. After we uploaded the data to BigQuery and executed the same query as we had done Postgres (the syntax is eerily similar), our query was running much faster and took about a minute to complete. Ultimately, we ended up with a 50x performance boost just by using a different service. It is worth noting that other DBs were not delivering the same performance gain, and let’s be generous and merely say they were not even close. To be honest, I was truly impressed by the performance gain provided by BigQuery, as the figures were better than any of us had hoped for.
Despite this, I would not advertise BigQuery as the best database solution in the world. While it worked well for our project, it still has a lot of limitations, such as a limited number of updates in the table per day, limitations on data size per request, and others. You need to understand that BigQuery cannot be used to substitute a relational database, and it is oriented on running analytical queries, not for simple CRUD operations and queries.
In this article, I will try to compare using Postgres (my favorite relational database) and BigQuery for real-world use case scenarios. Also, I would provide a few suggestions along the way, namely my opinion on when it actually makes sense to use BigQuery.
Sample Data
To compare Postgres and Google BigQuery, I took public demographic information for each country grouped by country, age, year and sex (you can download the same data from this link).
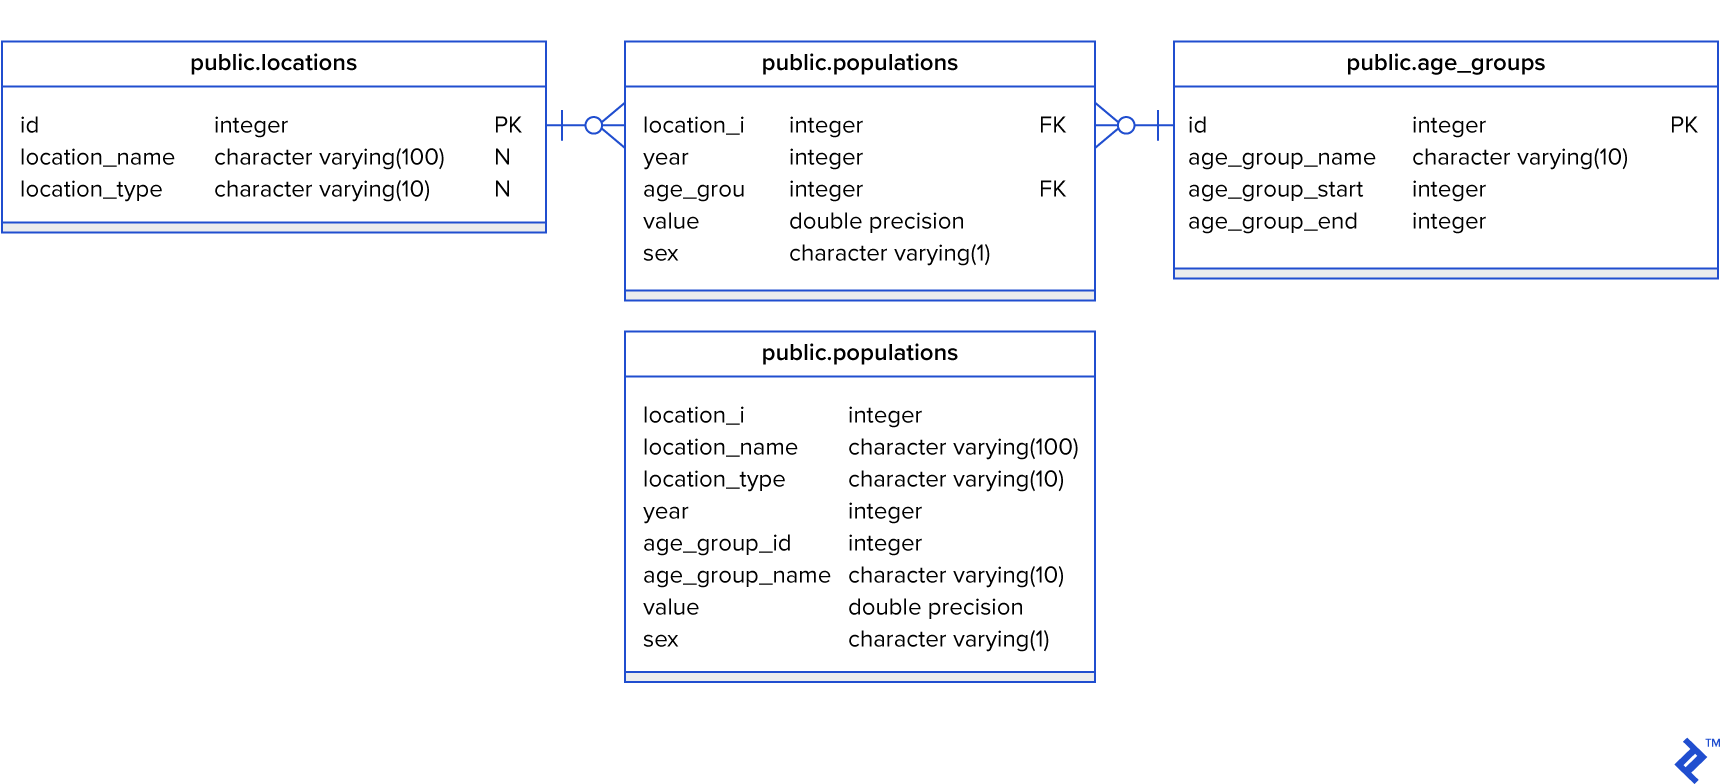
I added the data to four tables:
populationslocationsage_groupspopulations_aggregated
The last table is just aggregated data from the previous three tables. Here is the DB schema:

The populations table I ended up with contains more than 6.9 million rows. It’s not too much, but it was enough for my test.
Based on sample data, I tried to build queries that can be used for building real-life analytical reports and charts. So I prepared queries for the next reports:
- Population in the US aggregated by years.
- Population in 2019 for all countries starting from the biggest countries.
- Top five “oldest” nations per each year. “Oldest” denotes countries where the percentage of people over 60 to the total number of people is the highest. The query should give five results per each year.
- Top five nations aggregated by year, where the difference between male and female population is the biggest.
- Get median (average) age per country for each year starting from “oldest” to “youngest” countries.
- Find the top five “dying” countries per each year. “Dying” means countries in which the population is decreasing (depopulation is the highest).
Queries #1, #2, and #6 are quite easy and straightforward, but queries #3, #4, and #5 were not so easy to write–at least for me. Please note that I am a back-end engineer and writing complex SQL queries is not exactly a specialty of mine, so someone with more SQL experience could probably build smarter queries. However, at the moment we need to check how Postgres and BigQuery are processing the same queries with the same data.
I built 24 queries in total:
- 6 for Postgres DB, which are using non aggregated tables (
populations,locations,age_groups) - 6 for Postgres DB, which are using the
populations_aggregatedtable - 6+6 queries for BigQuery which are using aggregated and non aggregated tables.
Let me share BigQuery queries #1 and #5 for aggregated data so you can understand the complexity of simple (#1) and complex #5 queries.
Population in the US aggregated by years query:
select
   sum (value),
   year
from
   world_population.populations_aggregated
where
   location_name = 'United States of America'
group by
   2
order by
   year asc
Query for median age per country per each year sorted from oldest to youngest:
--converts age to number
with population_by_age_year_and_location as(
select
    sum (value) as value,
    cast (regexp_replace(age_group_name, '\\+', '') as int64) as age,
    year,
    location_name
from
    world_population.populations_aggregated
where
    location_type = 'COUNTRY'
group by 2,3,4),

--calculates total population per country per year
total_population_by_year_and_locations as (
select
    sum(value) as value,
    year,
    location_name
from
    population_by_age_year_and_location
group by
    2,3
),

--calculates total number of people in country per year
age_multiplied_by_population_temp as (
select
    sum(value * age) as value,
    year,
    location_name
from
    population_by_age_year_and_location
group by
    2,3
),

median_per_year_country as (
select
    a.value / b.value as median,
    a.year,
    a.location_name
from
    age_multiplied_by_population_temp a
    inner join total_population_by_year_and_locations b on a.location_name = b.location_name and a.year = b.year
)

select * from median_per_year_country
order by year desc, median desc
Note: You can find all queries in my bitbucket repository (link is at the end of the article).
Test Results
For running queries, I used two different Postgres servers. The first one has 1 CPU core and 4GB RAM, backed by an SSD drive. The second one has 16 CPU cores, 64GB RAM and was also using an SSD drive (the second server has 16x the CPU and RAM potential).
Also, take note that there was no load on the databases during running the test. I created them only for running queries. In real-life situations, queries will take longer, as other queries might run at the same time, and in addition, those queries running in parallel can lock tables. For checking query speed I was using pgAdmin3 and the BigQuery web interface.
In my test, I got these results:
| Postgres (1 CPU 4 RAM, SSD) | Postgres (16 CPU 64 RAM, SSD) | BigQuery | ||||
| Aggregated | Non-aggregated | Aggregated | Non-aggregated | Aggregated | Non-aggregated | |
| Query 1 (US Population aggregated by Years) | 1.3s | 0.96s | 0.87s | 0.81s | 2.8s | 2.4s |
| Query 2 (Population by Countries in 2019) | 1.1s | 0.88s | 0.87s | 0.78s | 1.7s | 2.6s |
| Query 3 (Top 5 Oldest nations by years) | 34.9s | 35.6s | 30.8s | 31.4s | 15.6s | 17.2s |
| Query 4 (Top 5 Countries with the biggest difference in male and female population) | 16.2s | 15.6s | 14.8s | 14.5s | 4.3s | 4.6s |
| Query 5 (Age median per country, year) | 45.6s | 45.1s | 38.8s | 40.8s | 15.4s | 18s |
| Query 6 (Top 5 "Dying" countries per year) | 3.3s | 4.0s | 3.0s | 3.3s | 4.6s | 6.5s |
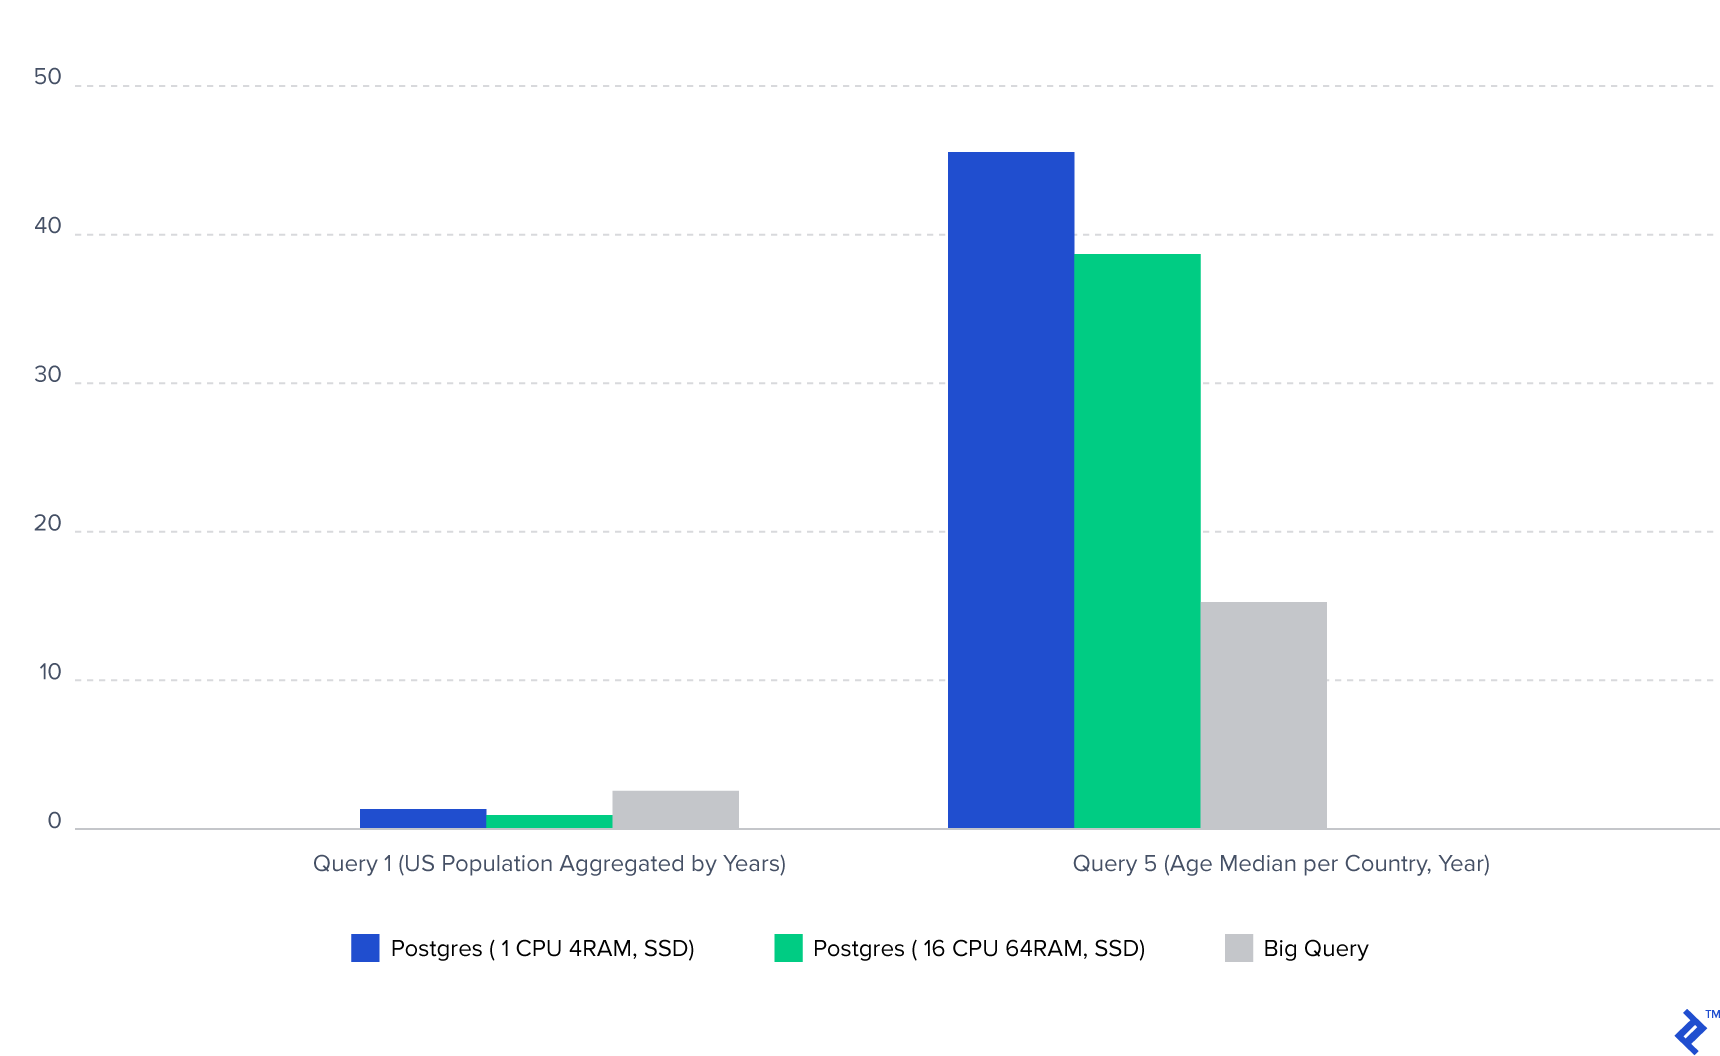
Let me show those results in a bar chart for query #1 and query #5.

Note: The Postgres database was located on US-based server, and I am based in Europe, so there was an additional delay in Postgres transmitting data.
BigQuery Performance and Conclusions
Based on the results that I got, I made the following conclusions:
- In case of scaling Postgres vertically, even at 16x times, it is giving only 10-25% of performance in running a single query. In other words, a Postgres server with only one CPU core and 4GB RAM was running queries with time very similar to the time that was needed for server with 16 CPU cores and 64GB of RAM. Of course, larger servers can process much larger datasets, however, this does not deliver much of an improvement in query execution time.
- For Postgres joins with small tables (
locationstable has around 400 rows andage_groupshas 100 rows) are not yielding huge difference in comparison with running queries under aggregated data located in one table. Also, I found that for queries which are running one to two seconds, queries with inner joins are faster, but for long-running queries, the situation is different. - In BigQuery situation with joins is totally different. BigQuery doesn’t like joins. The time difference between queries, which are using aggregated and non aggregated data, is quite big (for queries #3 and $5 it was around two seconds). It means that, for BigQuery, you can do as many subqueries as you want, but for good performance, the query should use one table.
- Postgres is faster for queries which are using simple aggregation or filtering or using a small dataset. I found that queries which are taking less than five seconds in Postgres are working slower in BigQuery.
- BigQuery is performing much better for long running queries. As the difference in data set size increases, so will the difference in the time these queries take to complete.
When It Makes Sense to Use BigQuery
Now, let’s get back to the core issue discussed in this article: when should you actually use Google BigQuery? Based on my conclusions, I would suggest using BigQuery when the following conditions are met:
- Use it when you have queries that run more than five seconds in a relational database. The idea of BigQuery is running complex analytical queries, which means there is no point in running queries that are doing simple aggregation or filtering. BigQuery is suitable for “heavy” queries, those that operate using a big set of data. The bigger the dataset, the more you’re likely to gain performance by using BigQuery. The dataset that I used was only 330 MB (megabytes, not even gigabytes).
- BigQuery doesn’t like joins, so you should merge your data into one table to get better execution time. BigQuery allows saving query results in a new table, so to create a new aggregated table, just upload all your data to BigQuery, run a query that will consolidate all data, and just save it in a new table.
- BigQuery is good for scenarios where data does not change often and you want to use cache, as it has built-in cache. What does this mean? If you run the same query and the data in tables is not changed (updated), BigQuery will just use cached results and will not try to execute the query again. Also, BigQuery is not charging money for cached queries. Note: Even cached queries take 1-1.2 seconds to return results.
- You can also use BigQuery when you want to reduce the load on your relational database. Analytical queries are “heavy” and overusing them under a relational database can lead to performance issues. So, you could eventually be forced to think about scaling your server. However, with BigQuery you can move these running queries to a third-party service, so they would not affect your main relational database.
Finally, a few more words on using BigQuery in real life. On our real-world project, the data for the reports was changing on a weekly or monthly basis, so we could upload data to BigQuery manually. However, if your data is changing frequently, syncing data between your relational database and BigQuery might be not so simple, and this is a caveat worth keeping in mind.
Links
You can find the sample data used in this article here, while the queries and data in CSV format are accessible here.
Understanding the basics
How do I access BigQuery?
You can use BigQuery web console under GCloud.
How do you query BigQuery?
You can use BigQuery web console under GCloud (https://console.cloud.google.com/bigquery). It contains query input. You can also use their REST API to run queries.
Does BigQuery use SQL?
Yes, BigQuery uses SQL. You can check out the details in the official documentation (https://cloud.google.com/bigquery/docs/reference/standard-sql/).
Why is BigQuery so fast?
Only Google knows how they make queries run so fast, but the basic idea is that they are using several machines to run every single query (horizontal scaling).
What is a BigQuery dataset?
A dataset is a container that organizes tables in BigQuery. It allows managing access to your tables and views. You can find more information here: https://cloud.google.com/bigquery/docs/datasets-intro
What language does BigQuery use?
BigQuery’s standard SQL is compliant with SQL 2011.
Maksym Goroshkevych
Chernivtsi, Chernivets'ka oblast, Ukraine
Member since July 16, 2014
About the author
Maksym is an expert in back-end Java development and building up the front with Angular. He enjoys tackling complex, challenging projects.
Expertise
PREVIOUSLY AT


