iOS Animation and Tuning for Efficiency
Smooth animations and flawless transitions are key to perceived performance in modern mobile applications. Without the right tools, tuning iOS animation for efficiency can be a challenge in itself.
In this article, Toptal engineer Stefan Progovac demonstrates the role of Instruments, a sophisticated set of performance profiling tools for iOS, discussing how they can help you understand animation performance bottlenecks and some strategies for working around them.
Stefan (MSc/Physics) is a highly skilled iOS developer who’s worked on apps used by millions for Target, Best Buy, and Coca-Cola.
Expertise
PREVIOUSLY AT

Building a great app is not all about looks or functionality, it’s also about how well it performs. Although hardware specifications of mobile devices are improving at a rapid pace, apps that perform poorly, stutter at every screen transition or scrolls like a slideshow can ruin the experience of its user and become a cause of frustration. In this article we will see how to measure performance of an iOS app and tune it for efficiency. For the purpose of this article, we will build a simple app with a long list of images and texts.
For the purposes of testing performance, I would recommend the use of real devices. If you’re serious about building apps, and optimizing them for smooth iOS animation, simulators simply don’t cut it. Simulations can sometimes be out of step with reality. For example, the simulator may be running on your Mac which probably means the CPU (Central Processing Unit) is far more powerful than the CPU on your iPhone. Conversely, the GPU (Graphics Processing Unit) is so different between your device and your Mac that your Mac actually emulates the device’s GPU. As a result, CPU-bound operations tend to be faster on your simulator while GPU-bound operations tend to be slower.
Animating at 60 FPS
One key aspect of perceived performance is making sure your animations run at 60 FPS (frames per second), which is the refresh rate of your screen. There are some timer based animations, which we won’t discuss here. Generally speaking, if you’re running at anything greater than 50 FPS your app will look smooth and performant. If your animations are stuck between 20 and 40 FPS there will be a noticeable stutter and the user will detect a “roughness” in transitions. Anything below 20 FPS will severely affect the usability of your app.
Before we start, it’s probably worth discussing the difference between CPU bound and GPU bound operations. The GPU is a specialized chip that is optimized for drawing graphics. While the CPU can too, it’s far slower. This is why we want to offload as much of our graphics rendering, the process of generating an image from a 2D or 3D model, to the GPU. But we need to be careful, as when the GPU runs out of processing power, graphics related performance will degrade even if the CPU is relatively free.
Core Animation is a powerful framework that handles animation both inside your app, and outside it. It breaks down the process into 6 key steps:
-
Layout: Where you arrange your layers and set their properties, such as color and their relative position
-
Display: This is where the backing images are drawn onto a context. Any routine you wrote in
drawRect:ordrawLayer:inContext:is accessed here. -
Prepare: At this stage Core Animation, as it is about to send context to the renderer to draw on, performs some necessary tasks such as decompress images.
-
Commit: Here Core Animation sends all this data to the render server.
-
Deserialization: The previous 4 steps were all within your app, now the animation is being processed outside your app, the packaged layers are deserialized into a tree that the render server can understand. Everything is converted into OpenGL geometry.
-
Draw: Renders the shapes (actually triangles).
You might have guessed that processes 1-4 are CPU operations and 5-6 are GPU operations. In reality you only have control over the first 2 steps. The biggest killer of the GPU is semi-transparent layers where the GPU has to fill the same pixel multiple times per frame. Also any offscreen drawing (several layer effects such as shadows, masks, rounded corners, or layer rasterization will force Core Animation to draw offscreen) will also affect performance. Images that are too large to be processed by the GPU will be processed by the much slower CPU instead. While shadows can be easily achieved by setting two properties directly on the layer, they can easily kill performance if you have many objects onscreen with shadows. Sometimes it’s worth considering adding these shadows as images.
Measuring iOS Animation Performance
We will begin with a simple app with 5 PNG images, and a table view. In this app, we will essentially load 5 images, but will repeat it over 10,000 rows. We will add shadows to both the images and to labels next to the images:
-(UITableViewCell*)tableView:(UITableView *)tableView cellForRowAtIndexPath:(NSIndexPath *)indexPath {
    CustomTableViewCell *cell = [tableView dequeueReusableCellWithIdentifier:[CustomTableViewCell getCustomCellIdentifier] forIndexPath:indexPath];

    NSInteger index = (indexPath.row % [self.images count]);
    NSString *imageName = [self.images objectAtIndex:index];

    NSString *filePath = [[NSBundle mainBundle] pathForResource:imageName ofType:@"png"];
    UIImage *image = [UIImage imageWithContentsOfFile:filePath];

    cell.customCellImageView.image = image;


    cell.customCellImageView.layer.shadowOffset = CGSizeMake(0, 5);
    cell.customCellImageView.layer.shadowOpacity = 0.8f;

    cell.customCellMainLabel.text = [NSString stringWithFormat:@"Row %li", (long)(indexPath.row + 1)];
    cell.customCellMainLabel.layer.shadowOffset = CGSizeMake(0, 3);
    cell.customCellMainLabel.layer.shadowOpacity = 0.5f;

    return cell;
}
Images are simply recycled while labels are always different. The result is:
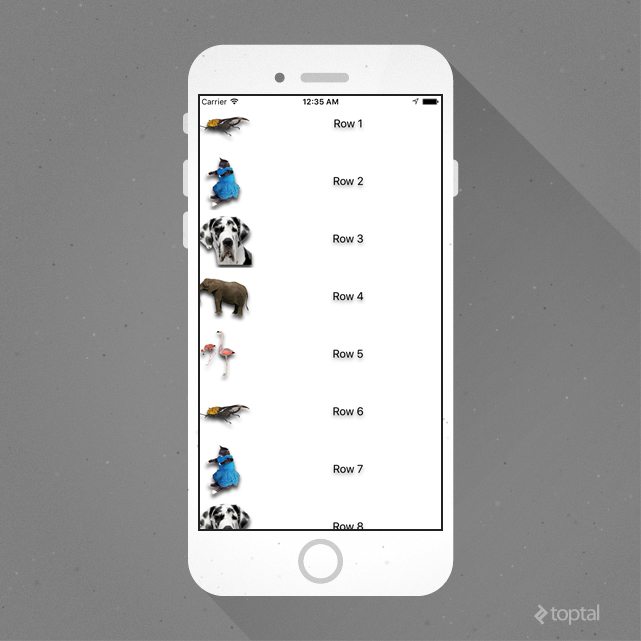
Upon swiping vertically, you are very likely to notice stutter as the view scrolls. At this point you may be thinking that the fact we are loading images in the main thread is the problem. May be if we moved this to the background thread all our problems would be solved.
Instead of making blind guesses, let’s try it out and measure the performance. It’s time for Instruments.
To use Instruments, you need to change from “Run” to “Profile”. And you should also be connected to your real device, not all instruments are available on the simulator (another reason why you shouldn’t be optimizing for performance on the simulator!). We will be primarily using “GPU Driver”, “Core Animation” and “Time Profiler” templates. A little known fact is that instead of stopping and running on a different instrument, you can drag and drop multiple instruments and run several at the same time.
Now that we have our instruments set-up, let’s measure. First let’s see if we really have a problem with our FPS.
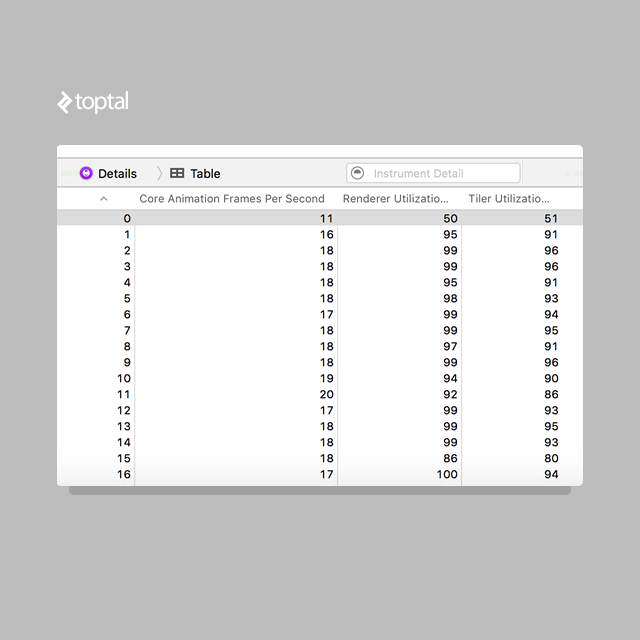
Yikes, I think we’re getting 18 FPS here. Is loading images from the bundle on the main thread really that expensive and costly? Notice our renderer utilization is almost maxed out. So is our tiler utilization. Both are above 95%. And that has nothing to do with loading an image from the bundle on the main thread so let’s not look for solutions here.
Tuning for Efficiency
There is a property called shouldRasterize, and people will probably recommend you to use it here. What does shouldRasterize do exactly? It caches your layer as a flattened image. All those expensive layer drawings need to happen once. In case your frame changes frequently, there is no use for a cache, as it will need to be regenerated each time anyway.
Making a quick amendment to our code, we get:
-(UITableViewCell*)tableView:(UITableView *)tableView cellForRowAtIndexPath:(NSIndexPath *)indexPath {
    CustomTableViewCell *cell = [tableView dequeueReusableCellWithIdentifier:[CustomTableViewCell getCustomCellIdentifier] forIndexPath:indexPath];

    NSInteger index = (indexPath.row % [self.images count]);
    NSString *imageName = [self.images objectAtIndex:index];

    NSString *filePath = [[NSBundle mainBundle] pathForResource:imageName ofType:@"png"];
    UIImage *image = [UIImage imageWithContentsOfFile:filePath];

    cell.customCellImageView.image = image;


    cell.customCellImageView.layer.shadowOffset = CGSizeMake(0, 5);
    cell.customCellImageView.layer.shadowOpacity = 0.8f;

    cell.customCellMainLabel.text = [NSString stringWithFormat:@"Row %li", (long)(indexPath.row + 1)];
    cell.customCellMainLabel.layer.shadowOffset = CGSizeMake(0, 3);
    cell.customCellMainLabel.layer.shadowOpacity = 0.5f;

    cell.layer.shouldRasterize = YES;
    cell.layer.rasterizationScale = [UIScreen mainScreen].scale;

    return cell;
}
And we measure again:
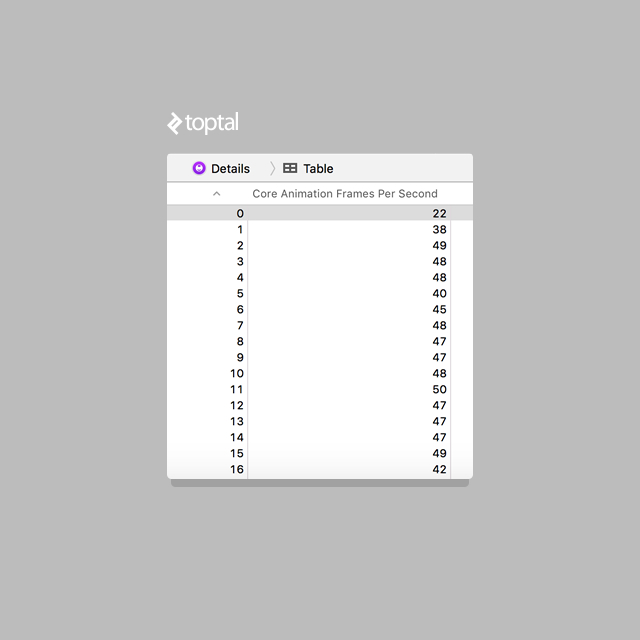
With just two lines, we have improved our FPS by 2x. We are now averaging above 40 FPS. But would it help if we had moved image loading to a background thread?
-(UITableViewCell*)tableView:(UITableView *)tableView cellForRowAtIndexPath:(NSIndexPath *)indexPath {
    CustomTableViewCell *cell = [tableView dequeueReusableCellWithIdentifier:[CustomTableViewCell getCustomCellIdentifier] forIndexPath:indexPath];

    NSInteger index = (indexPath.row % [self.images count]);
    NSString *imageName = [self.images objectAtIndex:index];

    cell.tag = indexPath.row;

    dispatch_async(dispatch_get_global_queue(DISPATCH_QUEUE_PRIORITY_HIGH, 0), ^{
        NSString *filePath = [[NSBundle mainBundle] pathForResource:imageName ofType:@"png"];
        UIImage *image = [UIImage imageWithContentsOfFile:filePath];

        dispatch_async(dispatch_get_main_queue(), ^{
            if (indexPath.row == cell.tag) {
                cell.customCellImageView.image = image;
            }
        });
    });


    cell.customCellImageView.layer.shadowOffset = CGSizeMake(0, 5);
    cell.customCellImageView.layer.shadowOpacity = 0.8f;

    cell.customCellMainLabel.text = [NSString stringWithFormat:@"Row %li", (long)(indexPath.row + 1)];
    cell.customCellMainLabel.layer.shadowOffset = CGSizeMake(0, 3);
    cell.customCellMainLabel.layer.shadowOpacity = 0.5f;

//    cell.layer.shouldRasterize = YES;
//    cell.layer.rasterizationScale = [UIScreen mainScreen].scale;

    return cell;
}
Upon measuring, we see the performance is averaging around 18 FPS:
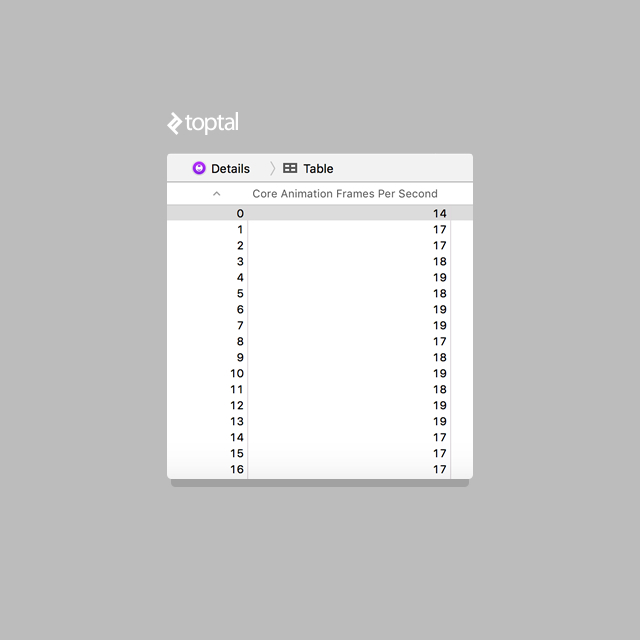
Nothing worth celebrating. In other words, it made no improvement to our frame rate. That’s because even though clogging the main-thread is wrong, it wasn’t our bottleneck, rendering was.
Moving back to the better example, where we were averaging above 40FPS, performance is notably smoother. But we can actually do better.
Checking “Color Blended Layers” on the Core Animation Tool, we see:
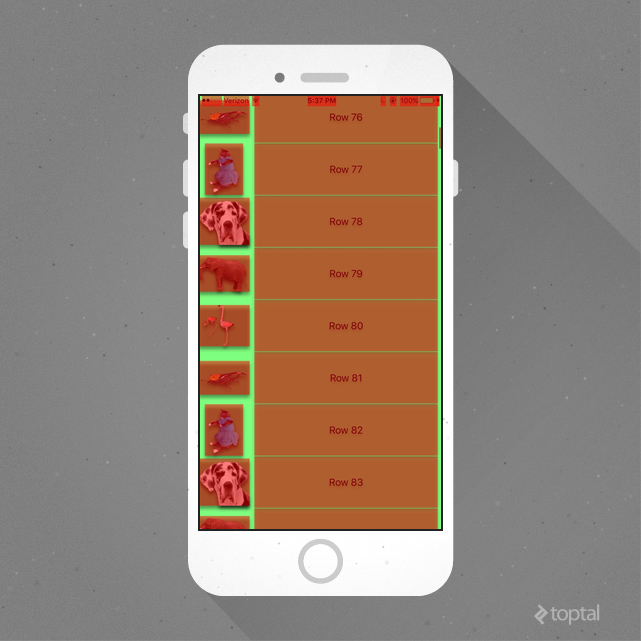
“Color Blended Layers” shows on the screen where your GPU is doing a lot of rendering. Green indicates the least amount of rendering activity while red indicates the most. But we did set shouldRasterize to YES. It is worth pointing out that “Color Blended Layers” is not the same as “Color Hits Green and Misses Red”. The later basically highlights rasterized layers in red as the cache is regenerated (a good tool to see if you’re not using the cache properly). Setting shouldRasterize to YES has no effect on the initial rendering of non-opaque layers.
This is an important point, and we need to pause for a moment to think. Regardless of whether shouldRasterize is set to YES or not, to render the framework needs to check all the views, and blend (or not) based on whether subviews are transparent or opaque. While it could make sense for your UILabel to be non-opaque, it maybe be worthless and killing your performance. For example a transparent UILabel on a white background is probably worthless. Let’s make it opaque:
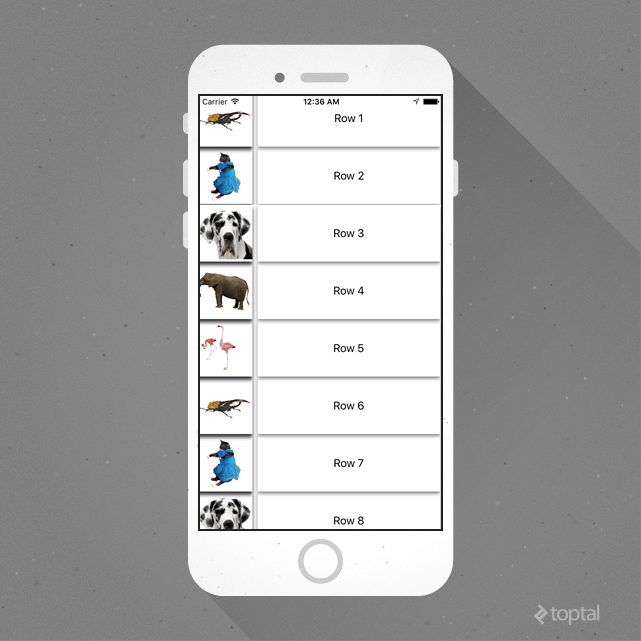
This yields better performance, but our look and feel of the app has changed. Now, because our label and images are opaque, the shadow has moved around our image. No one is probably going to be fond of this change, and if we want to preserve the original look and feel with top notch performance we are not lost for hope.
To squeeze out some extra FPS while preserving the original look, it’s important to revisit two of our Core Animation phases that we have neglected so far.
- Prepare
- Commit
These may seem to be completely out of our hands, but that’s not quite true. We know for an image to be loaded it needs to be decompressed. The decompression time changes depending on image format. For PNGs decompression is a lot faster than JPEGs (though loading is longer, and this depends on image size too), so we were sort of on the right track to use PNGs, but we are doing nothing about the decompression process, and this decompression is happening at the “point of drawing”! This is the worst possible place where we can kill time - on the main thread.
There is a way to force to decompression. We could set it to the image property of a UIImageView right away. But that still decompresses the image on the main thread. Is there any better way?
There is one. Draw it into a CGContext, where the image needs to be decompressed before it can be drawn. We can do this (using the CPU) in a background thread, and give it bounds as necessary based on the size of our image view. This will optimize our image drawing process by doing it off the main thread, and save us from unneeded “preparing” calculations on the main thread.
While we’re at it, why not add in the shadows as we draw the image? We can then capture the image (and cache it) as one static, opaque image. The code is as follows:
- (UIImage*)generateImageFromName:(NSString*)imageName {

    //define a boudns for drawing
    CGRect imgVwBounds = CGRectMake(0, 0, 48, 48);

    //get the image
    NSString *filePath = [[NSBundle mainBundle] pathForResource:imageName ofType:@"png"];
    UIImage *image = [UIImage imageWithContentsOfFile:filePath];

    //draw in the context
    UIGraphicsBeginImageContextWithOptions(imgVwBounds.size, NO, 0); {

    //get context
    CGContextRef context = UIGraphicsGetCurrentContext();

    //shadow
    CGContextSetShadowWithColor(context, CGSizeMake(0, 3.0f), 3.0f, [UIColor blackColor].CGColor);

    CGContextBeginTransparencyLayer (context, NULL);

    [image drawInRect:imgVwBounds blendMode:kCGBlendModeNormal alpha:1.0f];
        CGContextSetRGBStrokeColor(context, 1.0, 1.0, 1.0, 1.0);
        CGContextEndTransparencyLayer(context);
    }

    image = UIGraphicsGetImageFromCurrentImageContext();
    UIGraphicsEndImageContext();

    return image;

}
And finally:
-(UITableViewCell*)tableView:(UITableView *)tableView cellForRowAtIndexPath:(NSIndexPath *)indexPath {
    CustomTableViewCell *cell = [tableView dequeueReusableCellWithIdentifier:[CustomTableViewCell getCustomCellIdentifier] forIndexPath:indexPath];

//    NSInteger index = (indexPath.row % [self.images count]);
//    NSString *imageName = [self.images objectAtIndex:index];
//
//    cell.tag = indexPath.row;
//
//    dispatch_async(dispatch_get_global_queue(DISPATCH_QUEUE_PRIORITY_HIGH, 0), ^{
//        NSString *filePath = [[NSBundle mainBundle] pathForResource:imageName ofType:@"png"];
//        UIImage *image = [UIImage imageWithContentsOfFile:filePath];
//
//        dispatch_async(dispatch_get_main_queue(), ^{
//            if (indexPath.row == cell.tag) {
//                cell.customCellImageView.image = image;
//            }
//        });
//    });

    cell.customCellImageView.image = [self getImageByIndexPath:indexPath];
    cell.customCellImageView.clipsToBounds = YES;

//    cell.customCellImageView.layer.shadowOffset = CGSizeMake(0, 5);
//    cell.customCellImageView.layer.shadowOpacity = 0.8f;

    cell.customCellMainLabel.text = [NSString stringWithFormat:@"Row %li", (long)(indexPath.row + 1)];
    cell.customCellMainLabel.layer.shadowOffset = CGSizeMake(0, 3);
    cell.customCellMainLabel.layer.shadowOpacity = 0.5f;

    cell.layer.shouldRasterize = YES;
    cell.layer.rasterizationScale = [UIScreen mainScreen].scale;

    return cell;
}
And the results are:
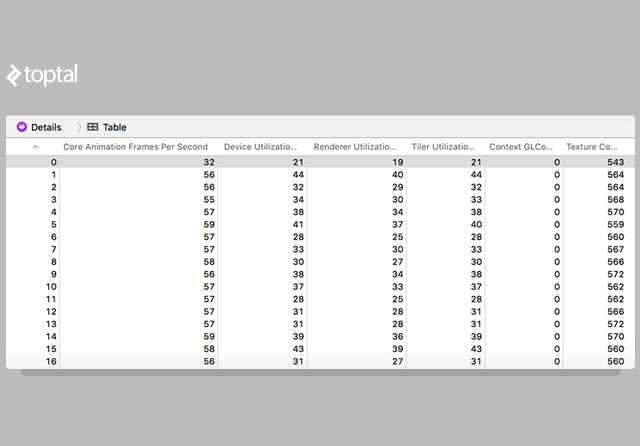
We are now averaging above 55 FPS, and our render utilization and tiler utilization are nearly half of what they originally were.
Wrap Up
Just in case you were wondering what else we can do to crank out a few more frames per second, look no further. UILabel uses WebKit HTML to render text. We can go directly to CATextLayer and perhaps play with the shadows there too.
You may have noticed in our above implementation, we weren’t doing the image loading in a background thread, and instead we were caching it. Since there were just 5 images this worked really fast and didn’t seem to affect the overall performance (especially since all 5 images were loaded on screen before scroll). But you may want to try moving this logic to a background thread for some extra performance.
Tuning for efficiency is the difference between a world-class app and an amateur one. Performance optimization, especially when it comes to iOS animation, can be a daunting task. But with the help of Instruments, one can easily diagnose the bottlenecks in animation performance on iOS.
Stefan Progovac
Miami Beach, FL, United States
Member since June 21, 2015
About the author
Stefan (MSc/Physics) is a highly skilled iOS developer who’s worked on apps used by millions for Target, Best Buy, and Coca-Cola.
Expertise
PREVIOUSLY AT

