Stars Realigned: Improving the IMDb Rating System
IMDb ratings have genre bias: For example, dramas tend to score higher. Removing common feature bias and keeping unique characteristics, it’s possible to create a new, refined score based on IMDb information.
IMDb ratings have genre bias: For example, dramas tend to score higher. Removing common feature bias and keeping unique characteristics, it’s possible to create a new, refined score based on IMDb information.
Juan (MSc, computer science) is a data science/AI PhD student. As a senior web developer, his main expertise includes R, Python, and PHP.
PREVIOUSLY AT

Movie watchers sometimes use rankings to select what to watch. Once doing this myself, I noticed that many of the best-ranked movies belonged to the same genre: drama. This made me think that the ranking could have some kind of genre bias.
I was on one of the most popular sites for movie lovers, IMDb, which covers movies from all over the world and from any year. Its famous ranking is based on a huge collection of reviews. For this IMDb data analysis, I decided to download all the information available there to analyze it and try to create a new, refined ranking that would consider a wider range of criteria.
The IMDb Rating System: Filtering IMDb’s Data
I was able to download information on 242,528 movies released between 1970 and 2019 inclusive. The information that IMDb gave me for each one was: Rank, Title, ID, Year, Certificate, Rating, Votes, Metascore, Synopsis, Runtime, Genre, Gross, and SearchYear.
To have enough information to analyze, I needed a minimum number of reviews per movie, so the first thing that I did was to filter movies with less than 500 reviews. This resulted in a set of 33,296 movies, and in the next table, we could see a summary analysis of its fields:
| Field | Type | Null Count | Mean | Median |
|---|---|---|---|---|
| Rank | Factor | 0 | ||
| Title | Factor | 0 | ||
| ID | Factor | 0 | ||
| Year | Int | 0 | 2003 | 2006 |
| Certificate | Factor | 17587 | ||
| Rating | Int | 0 | 6.1 | 6.3 |
| Votes | Int | 0 | 21040 | 2017 |
| Metascore | Int | 22350 | 55.3 | 56 |
| Synopsis | Factor | 0 | ||
| Runtime | Int | 132 | 104.9 | 100 |
| Genre | Factor | 0 | ||
| Gross | Factor | 21415 | ||
| SearchYear | Int | 0 | 2003 | 2006 |
Note: In R, Factor refers to strings. Rank and Gross are that way in the original IMDb dataset due to having, for example, thousands of separators.
Before starting to refine the score, I had to further analyze this dataset. For starters, the fields Certificate, Metascore, and Gross had more than 50% of null values so they aren’t useful. Rank depends intrinsically on Rating (the variable to refine), therefore, it doesn’t bear any useful information. The same is true with ID in that it’s a unique identifier for each movie.
Finally, Title and Synopsis are short text fields. It could be possible to use them through some NLP technique, but because it’s a limited amount of text, I decided not to take them into account for this task.
After this first filter, I was left with Genre, Rating, Year, Votes, SearchYear, and Runtime. In the Genre field, there was more than one genre per movie, separated by commas. So to capture the additive effect of having many genres, I transformed it using one-hot encoding. This resulted in 22 new boolean fields—one for each genre—with a value of 1 if the movie had this genre or 0 otherwise.
IMDb Data Analysis
To see the correlations between variables, I calculated the correlation matrix.
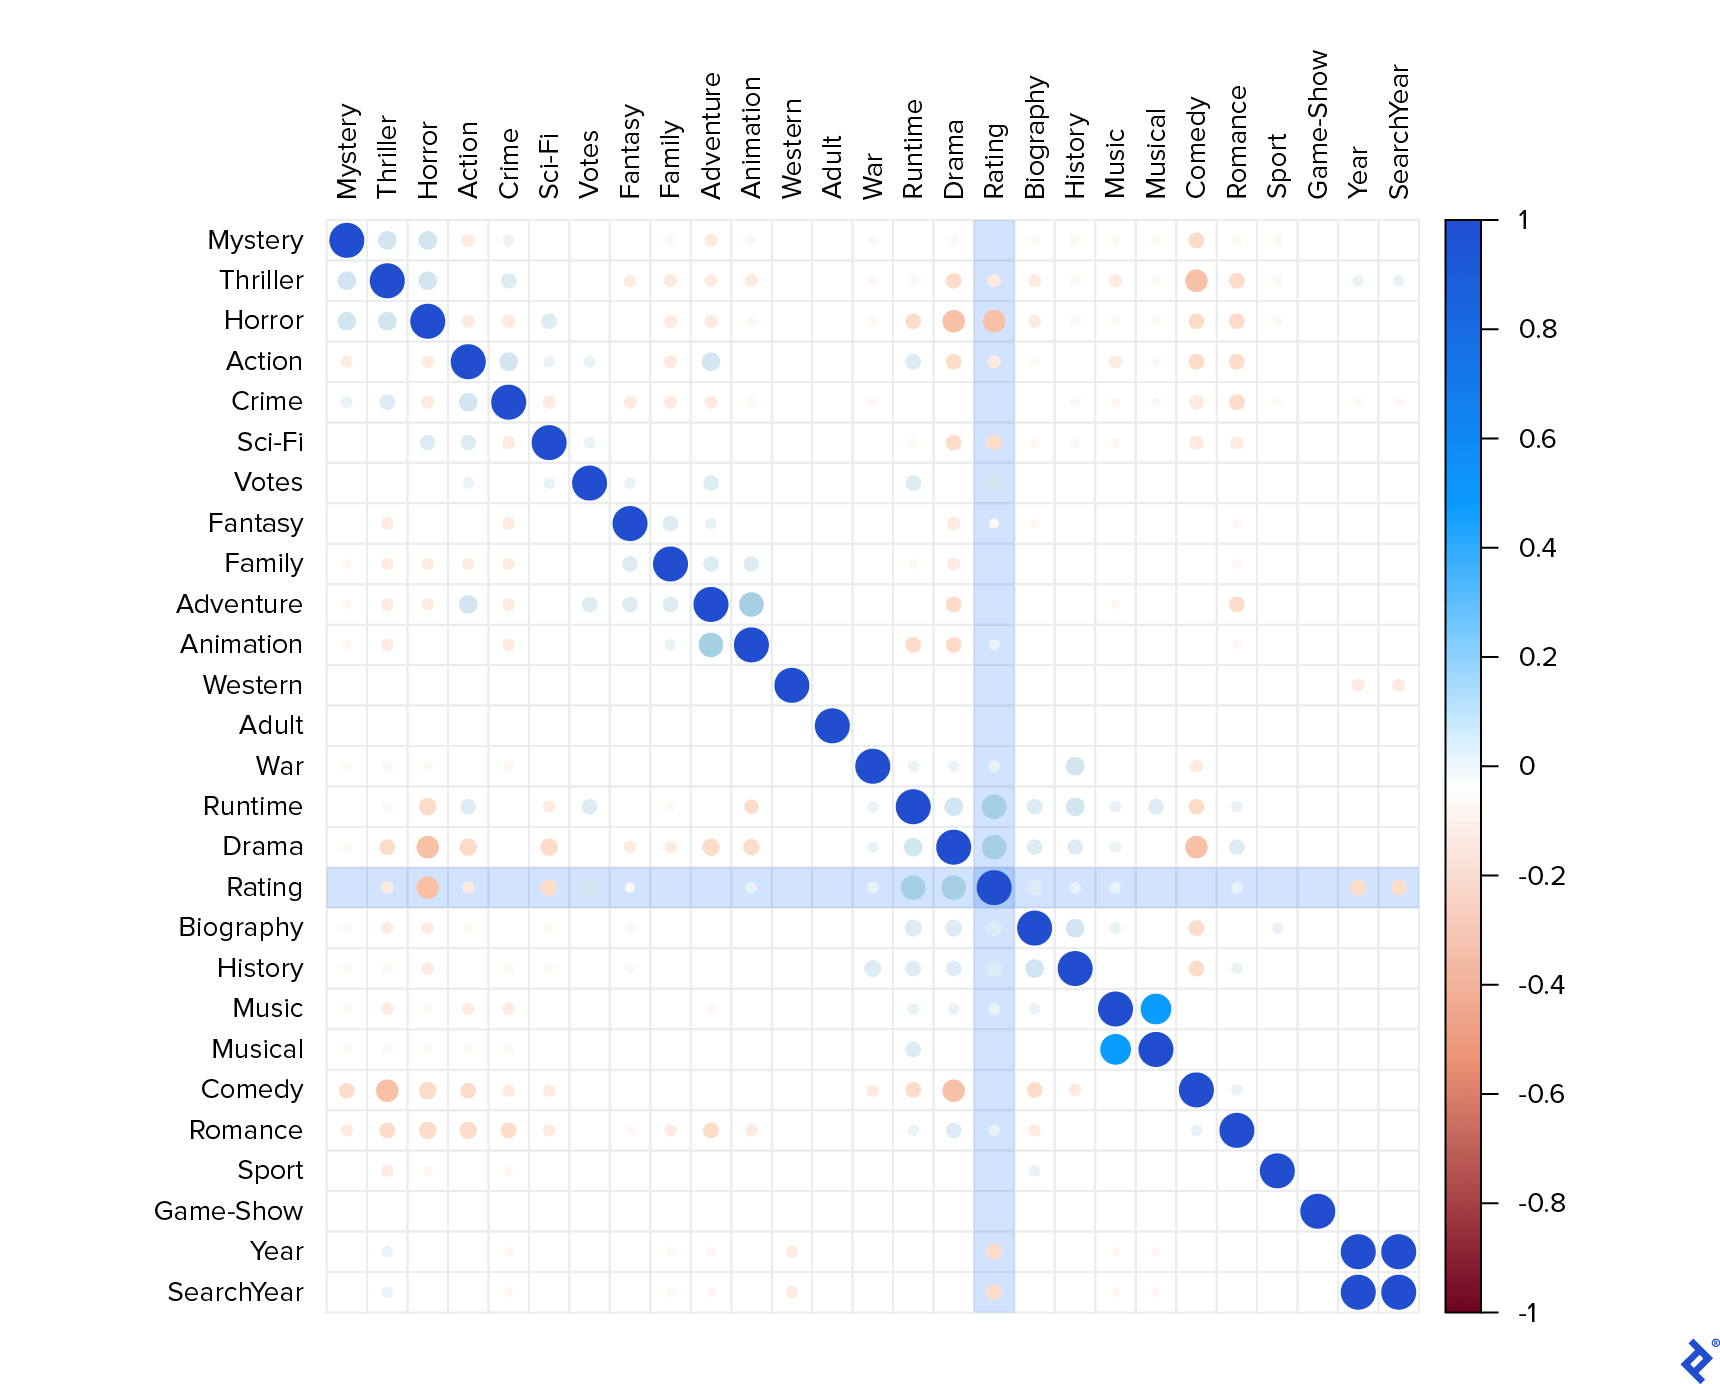
Here, a value close to 1 represents a strong positive correlation, and values close to -1 a strong negative correlation. By this graph, I made many observations:
-
YearandSearchYearare absolutely correlated. This means that they probably have the same values and that having both is the same as having only one, so I kept onlyYear. - Some fields had expected positive correlations, such as:
-
MusicwithMusical -
ActionwithAdventure -
AnimationwithAdventure
-
- Same for negative correlations:
-
Dramavs.Horror -
Comedyvs.Horror -
Horrorvs.Romance
-
- Related to the key variable (
Rating) I noticed:- It has a positive and important correlation with
RuntimeandDrama. - It has a lower correlation with
Votes,Biography, andHistory. - It has a considerably negative correlation with
Horrorand a lower negative one withThriller,Action,Sci-Fi, andYear. - It doesn’t have any other significant correlations.
- It has a positive and important correlation with
It seemed to be that long dramas were well-rated, while short horror movies weren’t. In my opinion—I didn’t have the data to check it—it didn’t correlate with the kind of movies that generate more profits, like Marvel or Pixar movies.
It could be that the people who vote on this site are not the best representative of the general people criterion. It makes sense because those who take the time to submit reviews on the site are probably some sort of movie critics with a more specific criterion. Anyway, my objective was to remove the effect of common movie features, so I tried to remove this bias in the process.
Genre Distribution in the IMDb Rating System
The next step was to analyze the distribution of each genre over the rating. To do that, I created a new field called Principal_Genre based on the first genre that appeared in the original Genre field. To visualize this, I made a violin graph.
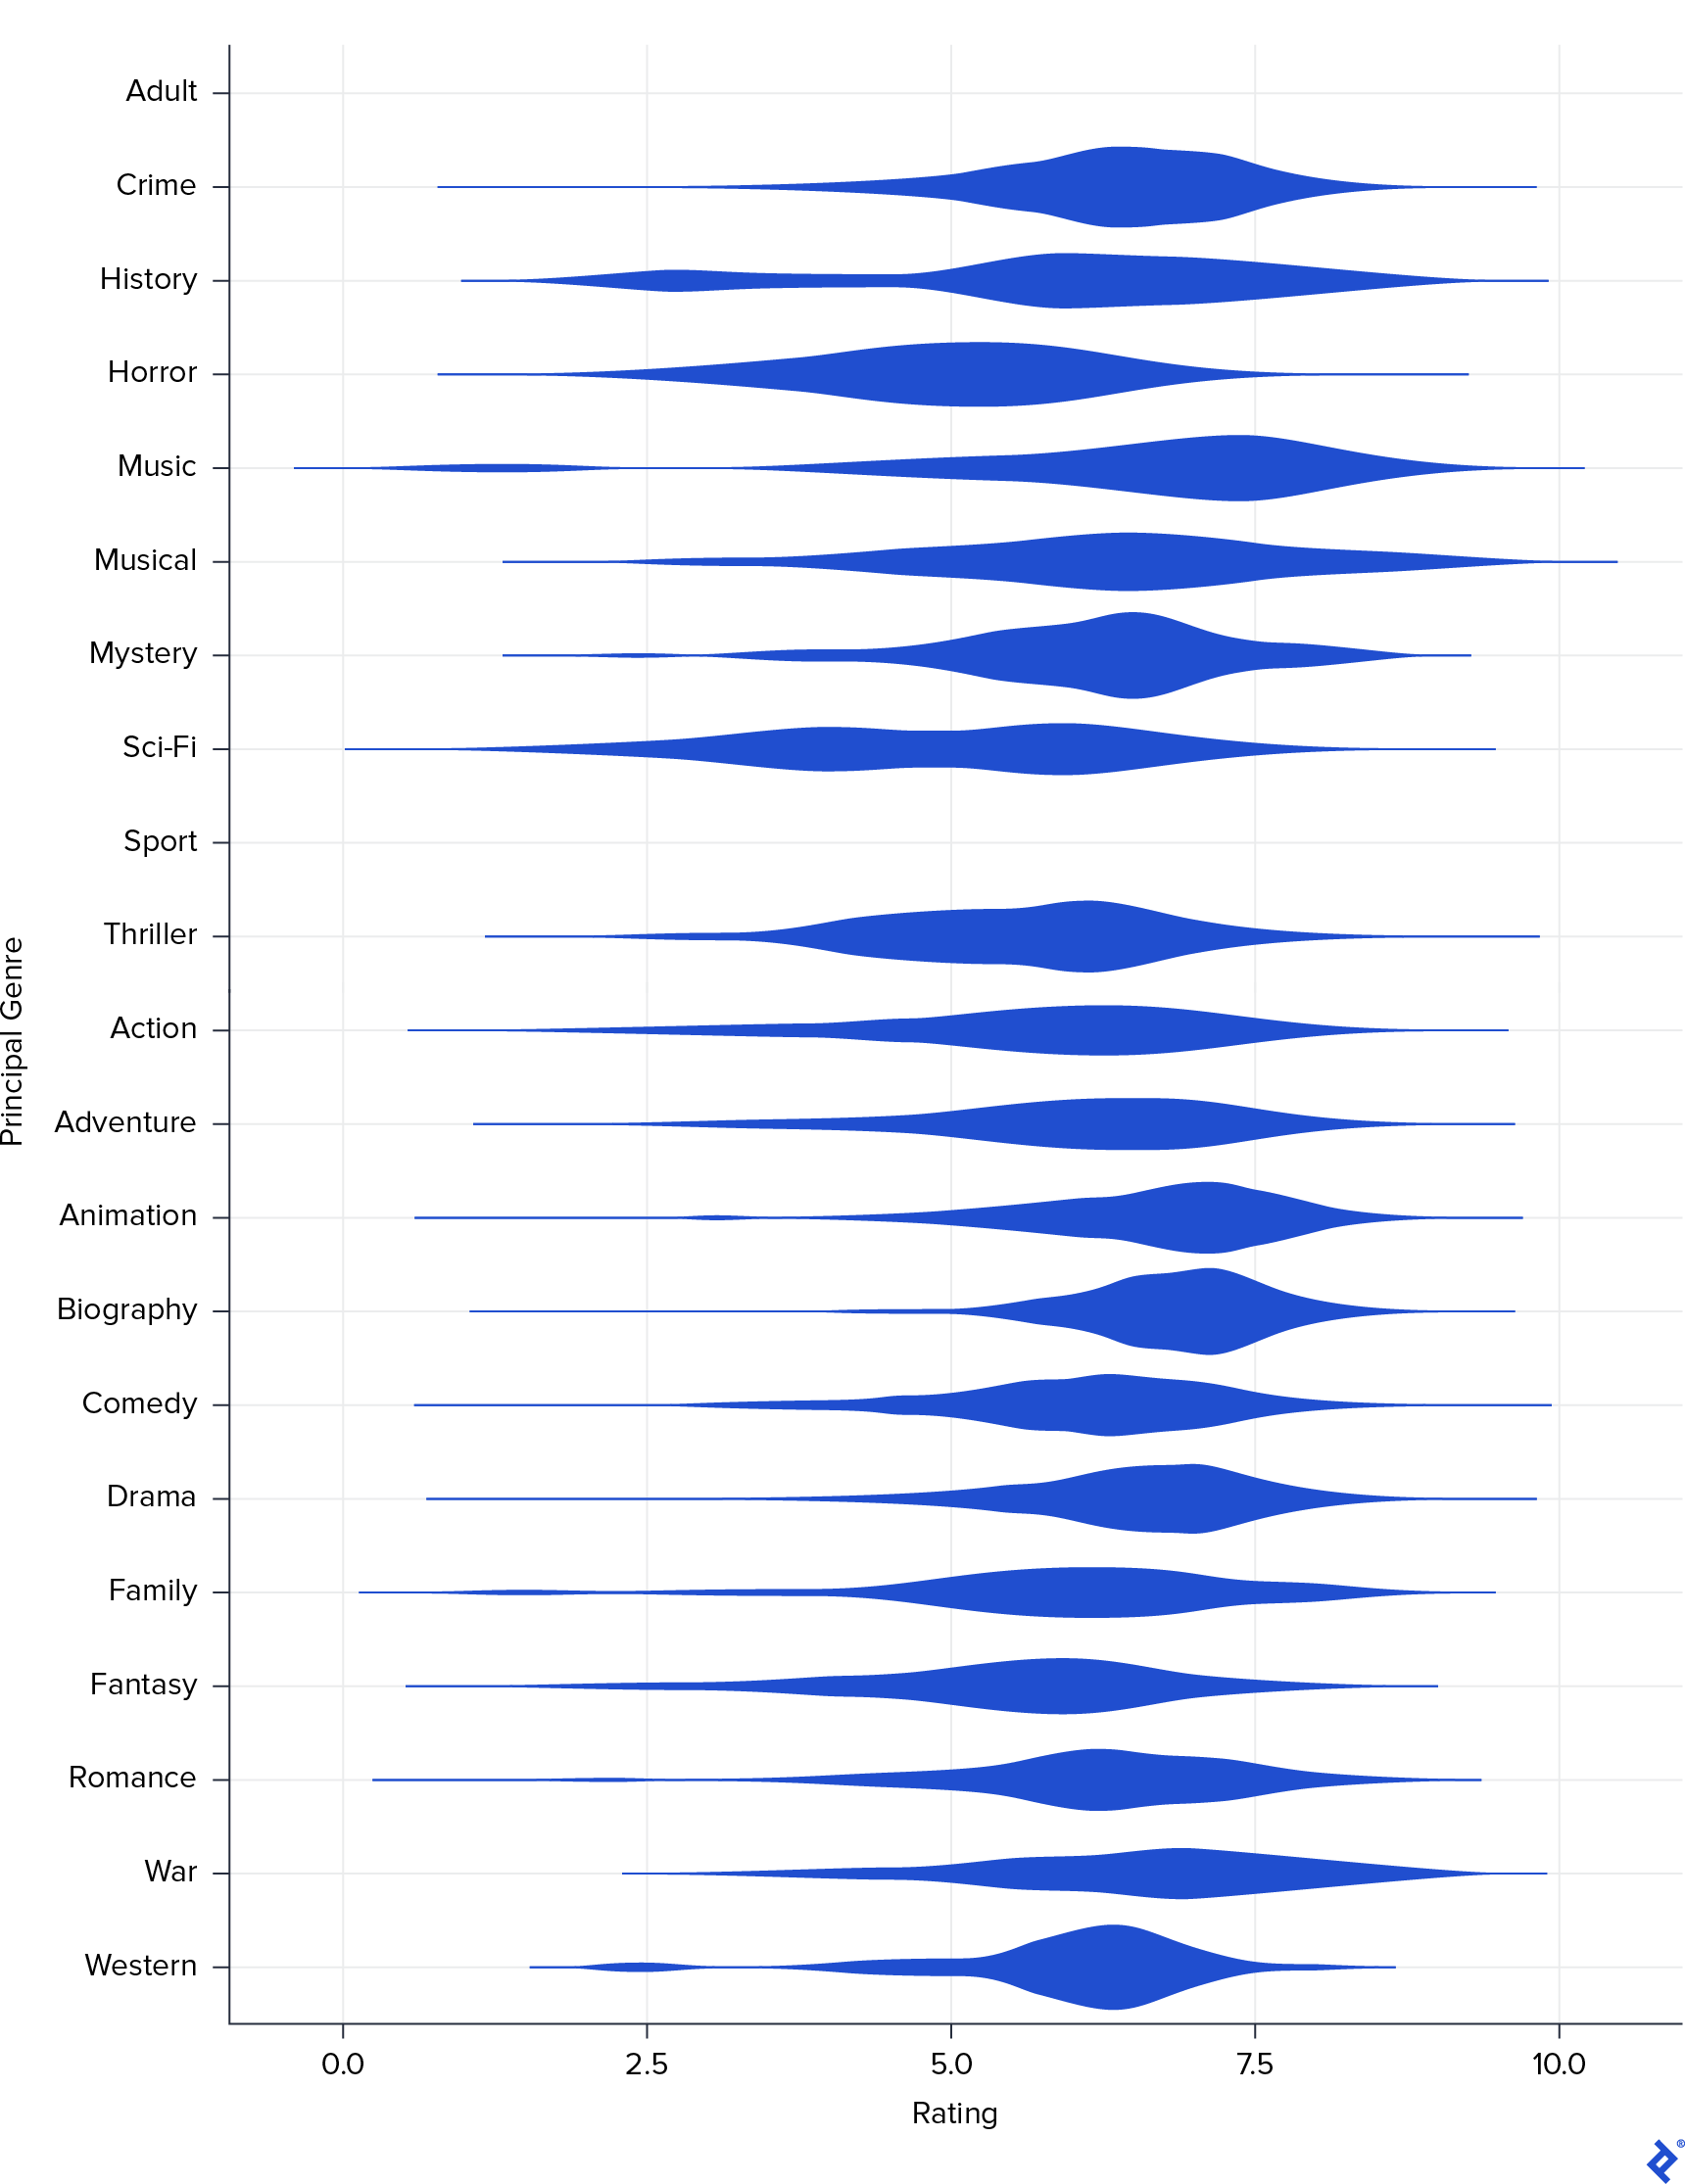
One more time, I could see that Drama correlates with high ratings and Horror with lower. However, this graph also revealed other genres as having good scores: Biography and Animation. That their correlations didn’t appear in the previous matrix was probably because there were too few movies with these genres. So next I created a frequency bar plot by genre.
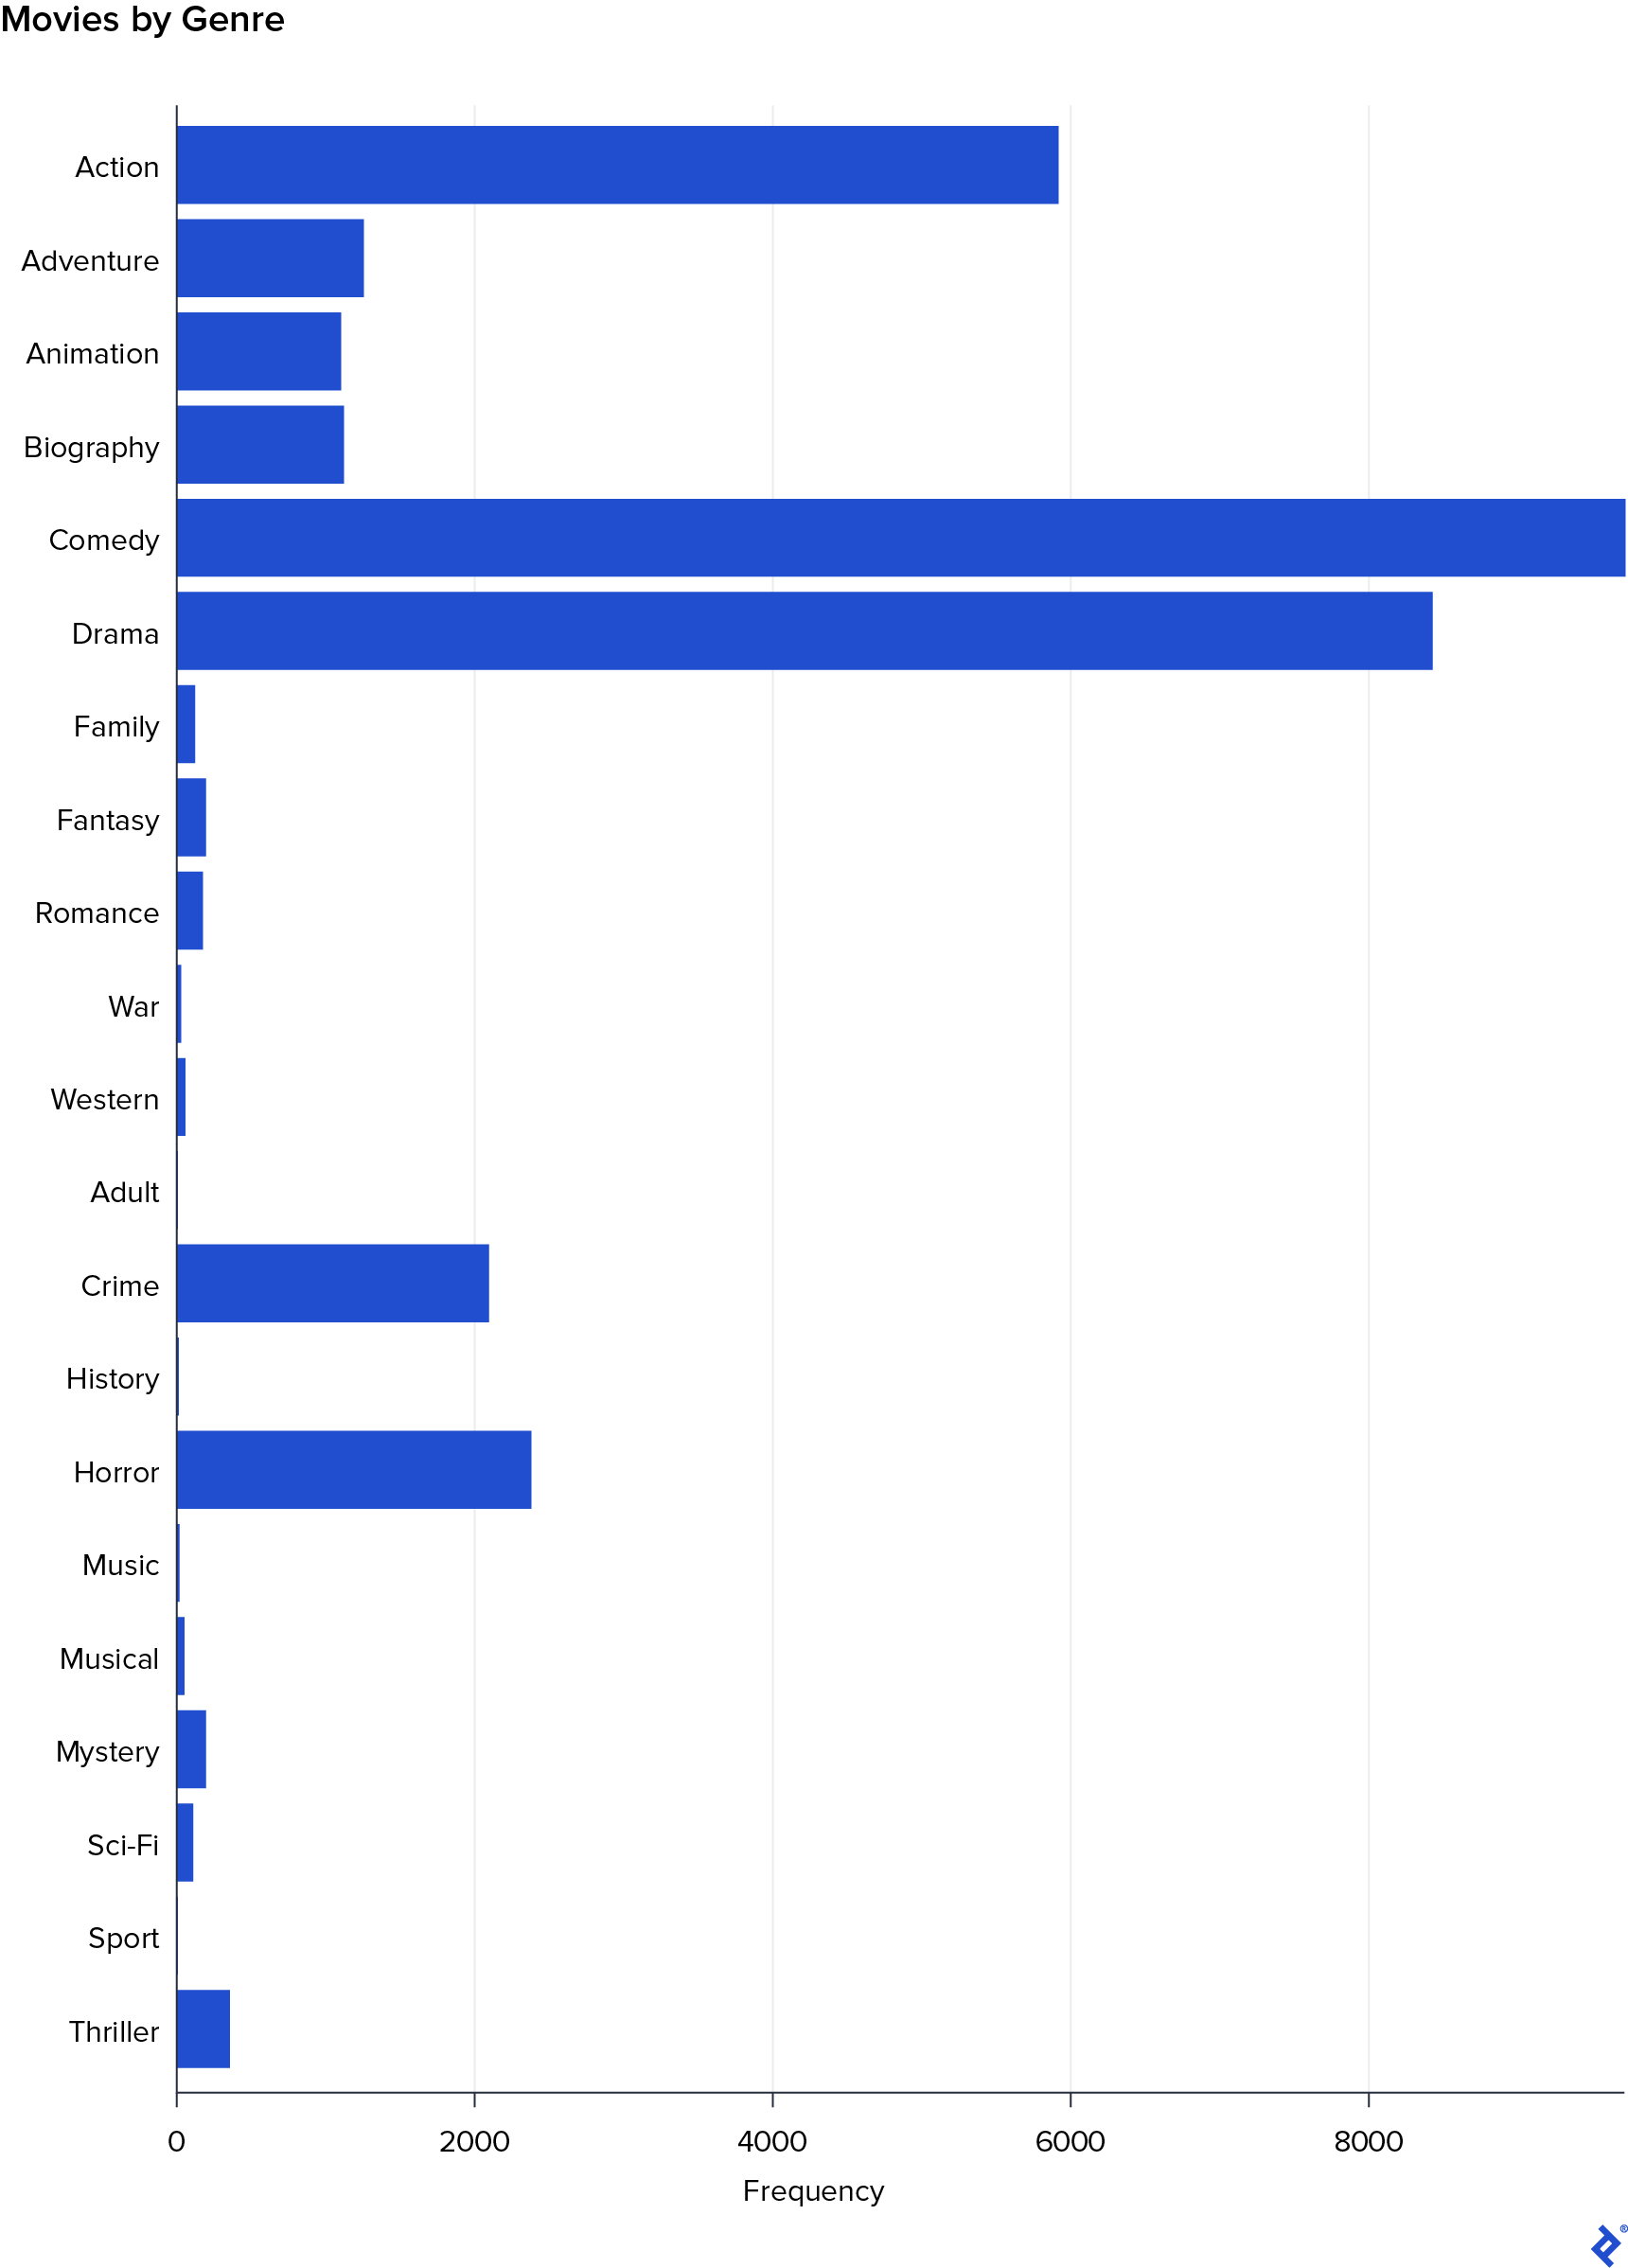
Effectively, Biography and Animation had very few movies, as did Sport and Adult. For this reason, they are not very well correlated with Rating.
Other Variables in the IMDb Rating System
After that, I started to analyze the continuous covariables: Year, Votes, and Runtime. In the scatter plot, you can see the relation between Rating and Year.
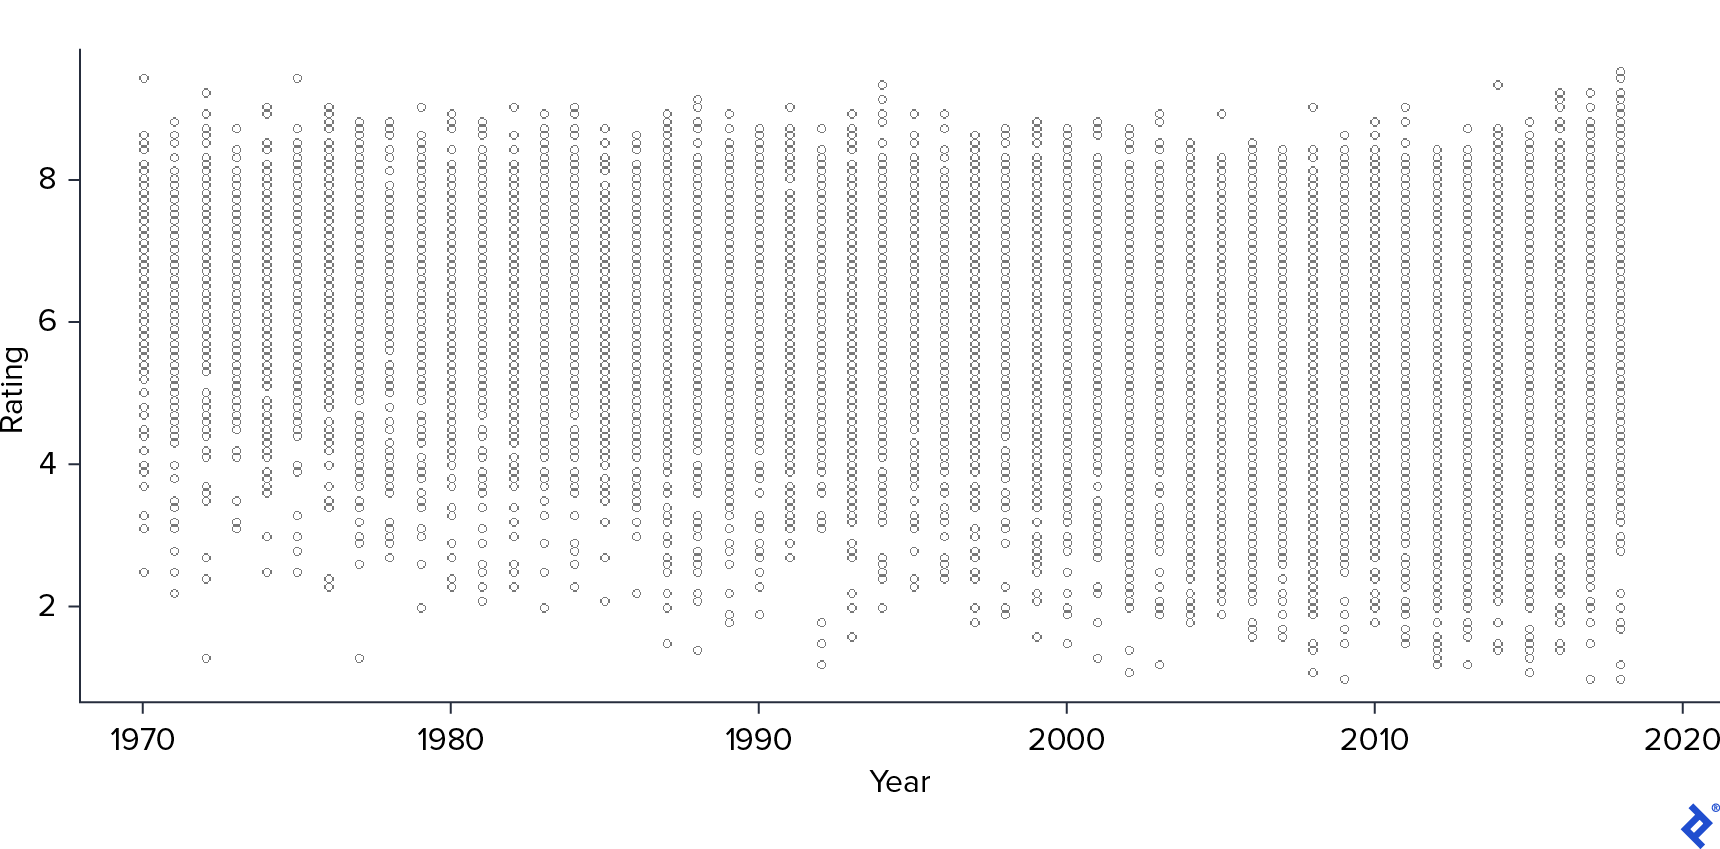
As we saw previously, Year seemed to have a negative correlation with Rating: As the year increases, the rating variance also increases, reaching more negative values on newer movies.
Next, I made the same plot for Votes.
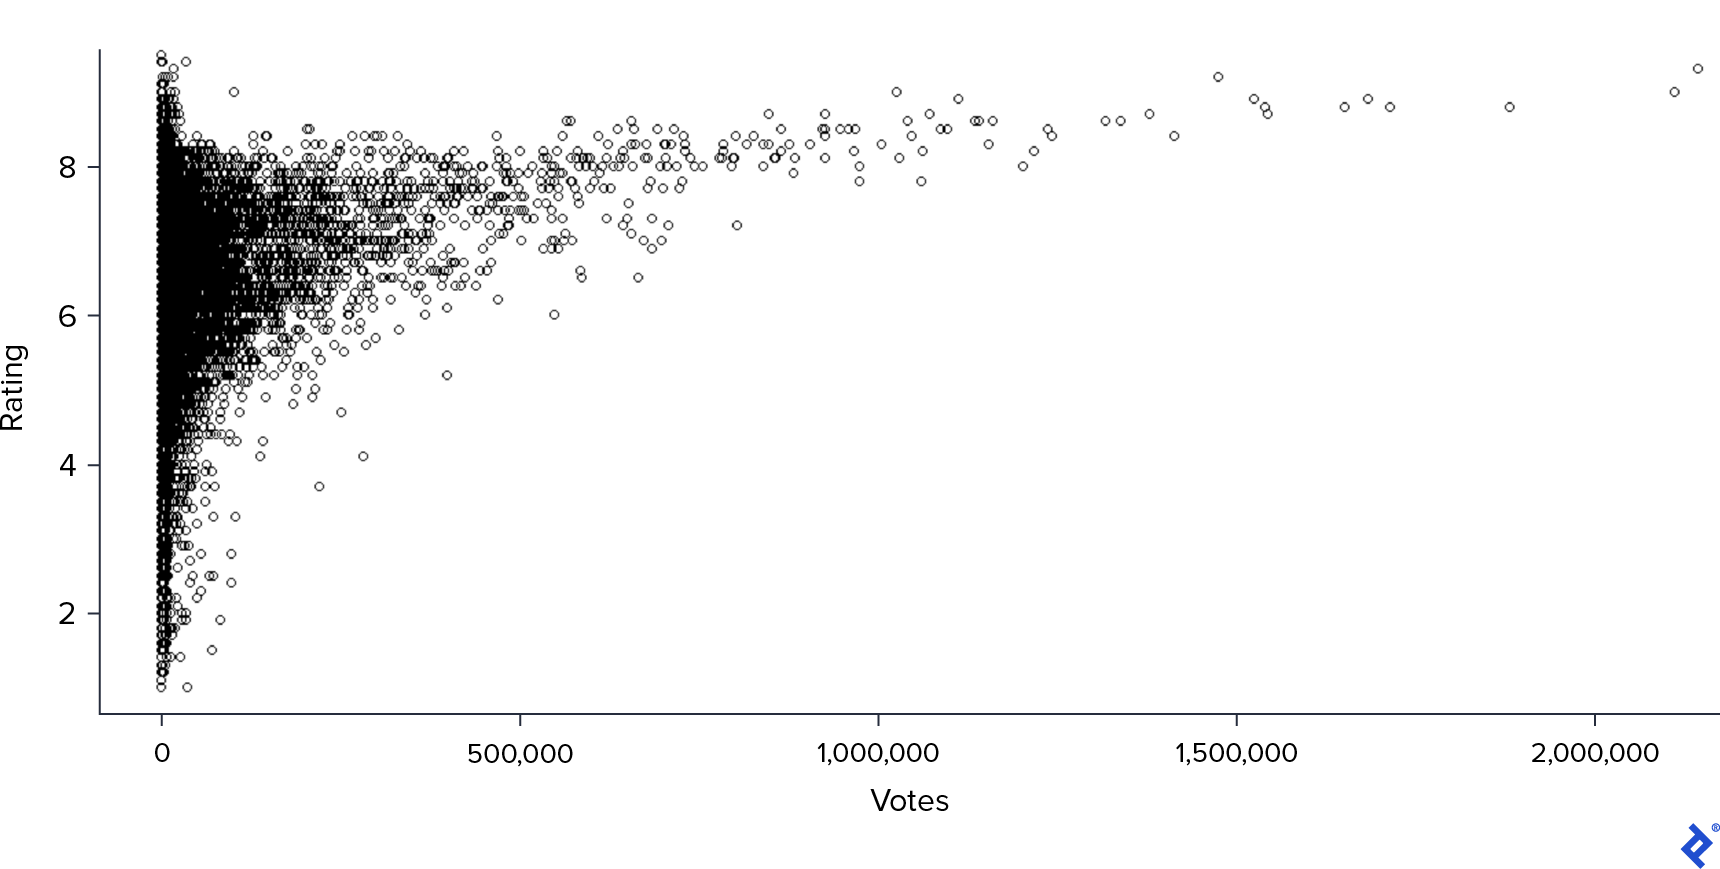
Here, the correlation was clearer: the higher the number of votes, the higher the ranking. However, most of the movies had not so many votes, and in this case, Rating had a bigger variance.
Lastly, I looked at the relationship with Runtime.
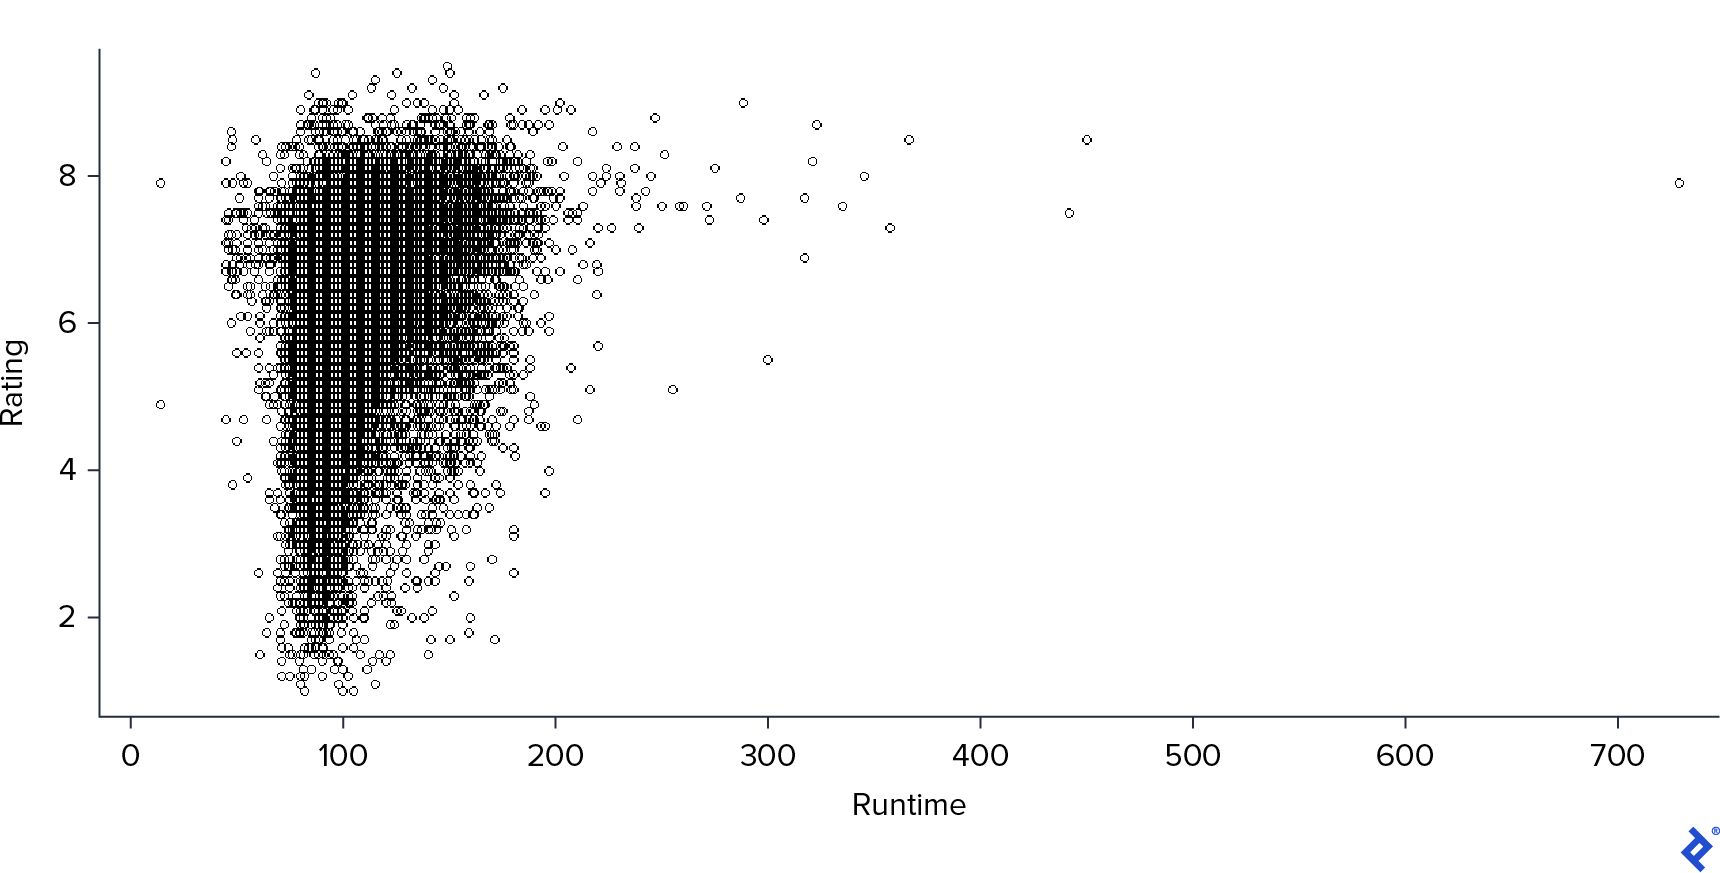
Again, we have a similar pattern but even stronger: Higher runtimes mean higher ratings, but there were very few cases for high runtimes.
IMDb Rating System Refinements
After all this analysis, I had a better idea of the data I was dealing with, so I decided to test some models to predict the ratings based on these fields. My idea was that the difference between my best model predictions and the real Rating would remove the common features’ influence and reflect the particular characteristics that make a movie better than others.
I started with the simplest model, the linear one. To evaluate which model performed better, I observed the root-mean-square (RMSE) and mean absolute (MAE) errors. They are standard measures for this kind of task. Also, they are on the same scale as the predicted variable, so they are easy to interpret.
In this first model, RMSE was 1.03, and MAE 0.78. But linear models suppose independence over the errors, a median of zero, and constant variance. If this is correct, the “residual vs. predicted values” graph should look like a cloud without structure. So I decided to graph it to corroborate that.
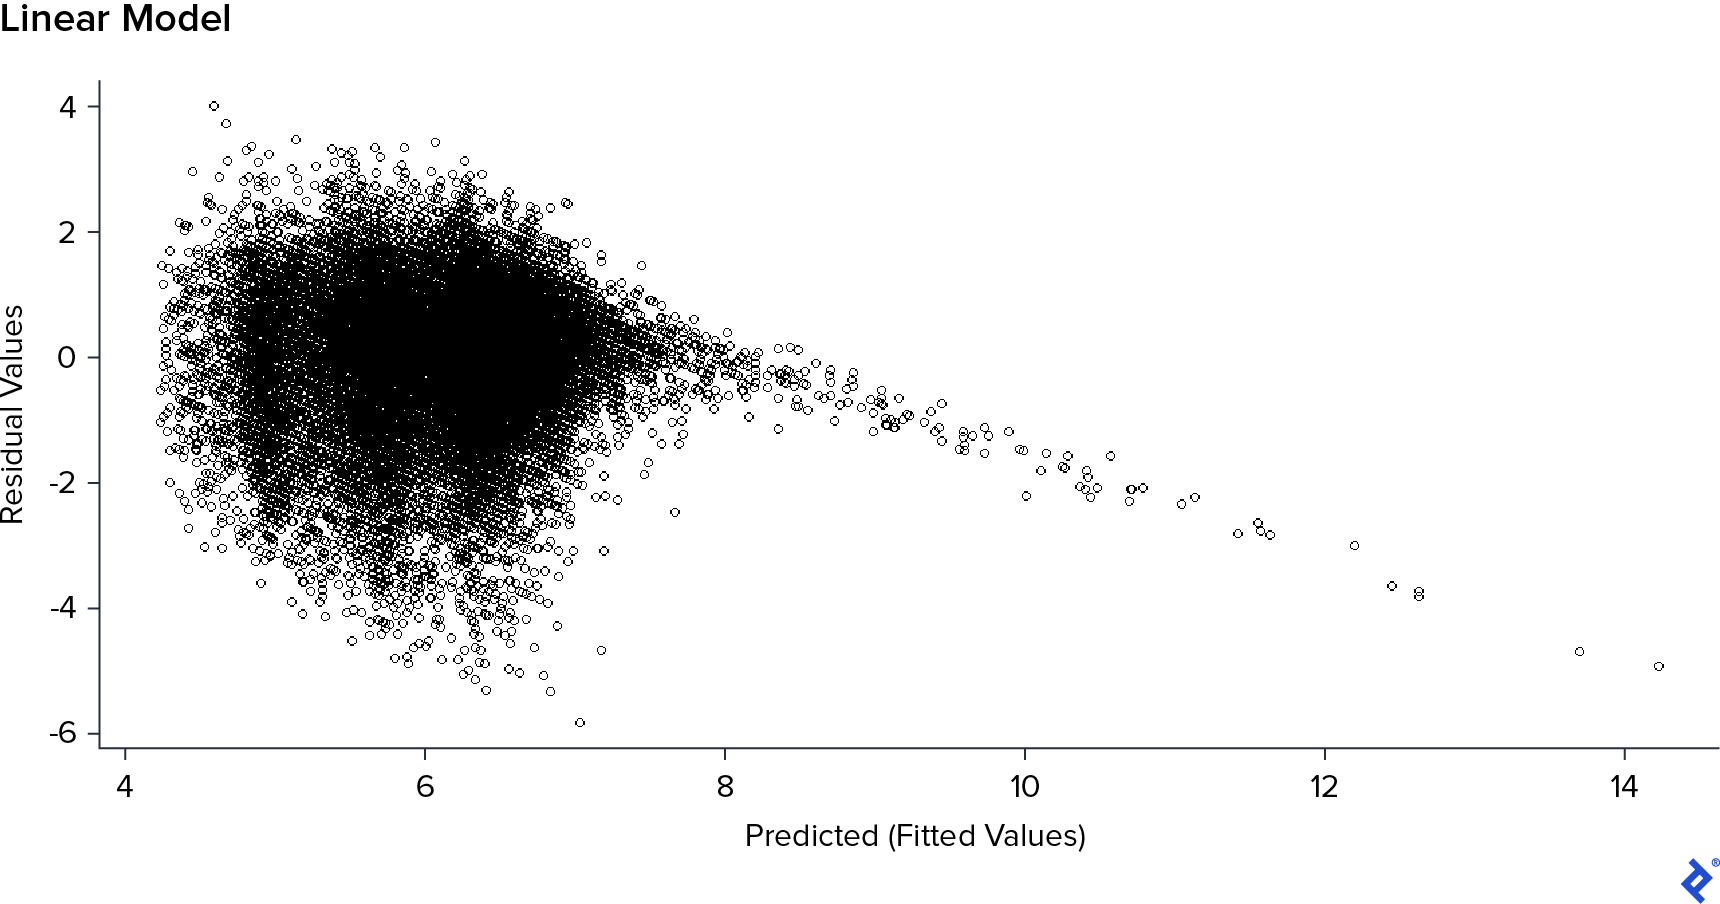
I could see that up to 7 in the predicted values, it had a non-structured shape, but after this value, it has a clear linear descent shape. Consequently, the model suppositions were bad, and also, I had an “overflow” on the predicted values because in reality, Rating can’t be more than 10.
In the previous IMDb data analysis, with a higher amount of Votes, the Rating improved; however, this happened in a few cases and for a huge amount of votes. This could cause distortions in the model and produce this Rating overflow. To check this, I evaluated what would happen with this same model, removing the Votes field.
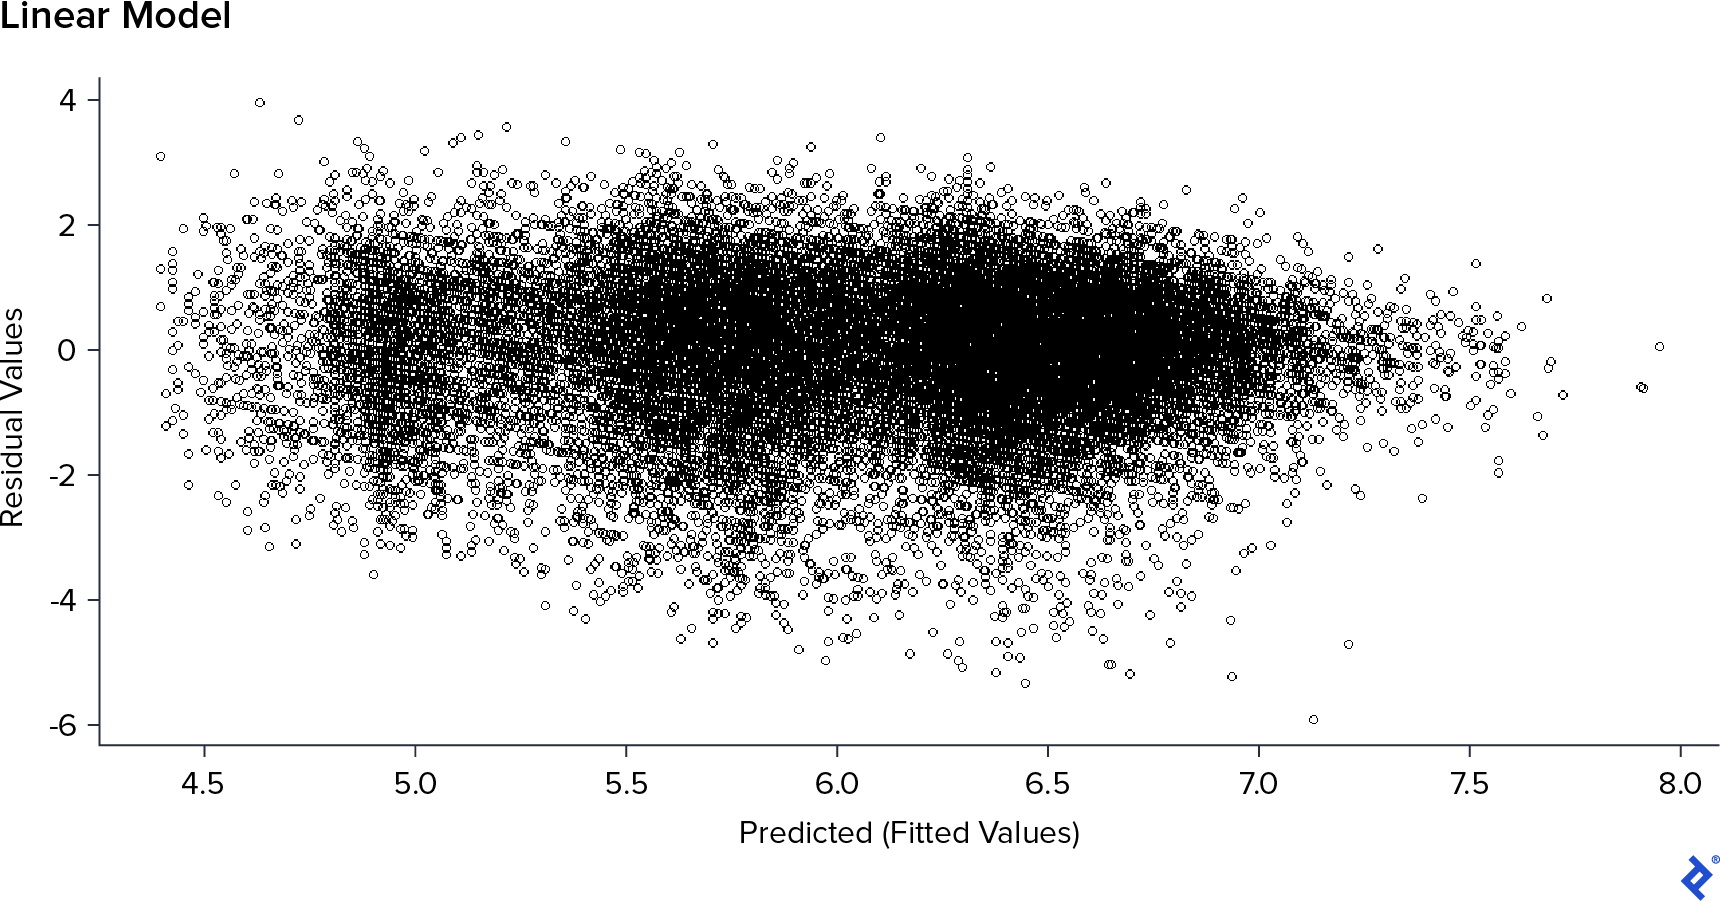
This was much better! It had a clearer, non-structured shape without overflow-predicted values. The Votes field also depends on reviewer activity and is not a feature of films, so I decided to drop this field as well. The errors after removing it were 1.06 on RMSE and 0.81 on MAE—a little worse, but not so much, and I preferred to have better suppositions and feature selection than a little better performance on my training set.
IMDb Data Analysis: How Well Do Other Models Work?
The next thing I did was to try different models to analyze which performed better. For each model, I used the random search technique to optimize hyperparameter values and 5-fold cross-validation to prevent model bias. In the following table are the estimated errors obtained:
| Model | RMSE | MAE |
|---|---|---|
| Neural Network | 1.044596 | 0.795699 |
| Boosting | 1.046639 | 0.7971921 |
| Inference Tree | 1.05704 | 0.8054783 |
| GAM | 1.0615108 | 0.8119555 |
| Linear Model | 1.066539 | 0.8152524 |
| Penalized Linear Reg | 1.066607 | 0.8153331 |
| KNN | 1.066714 | 0.8123369 |
| Bayesian Ridge | 1.068995 | 0.8148692 |
| SVM | 1.073491 | 0.8092725 |
As you can see, all models perform similarly, so I used some of them to analyze a little more data. I wanted to know the influence of each field over the rating. The simplest way to do that is by observing the parameters of the linear model. But to avoid distortions on them previously, I had scaled the data and then retrained the linear model. The weights were as pictured here.
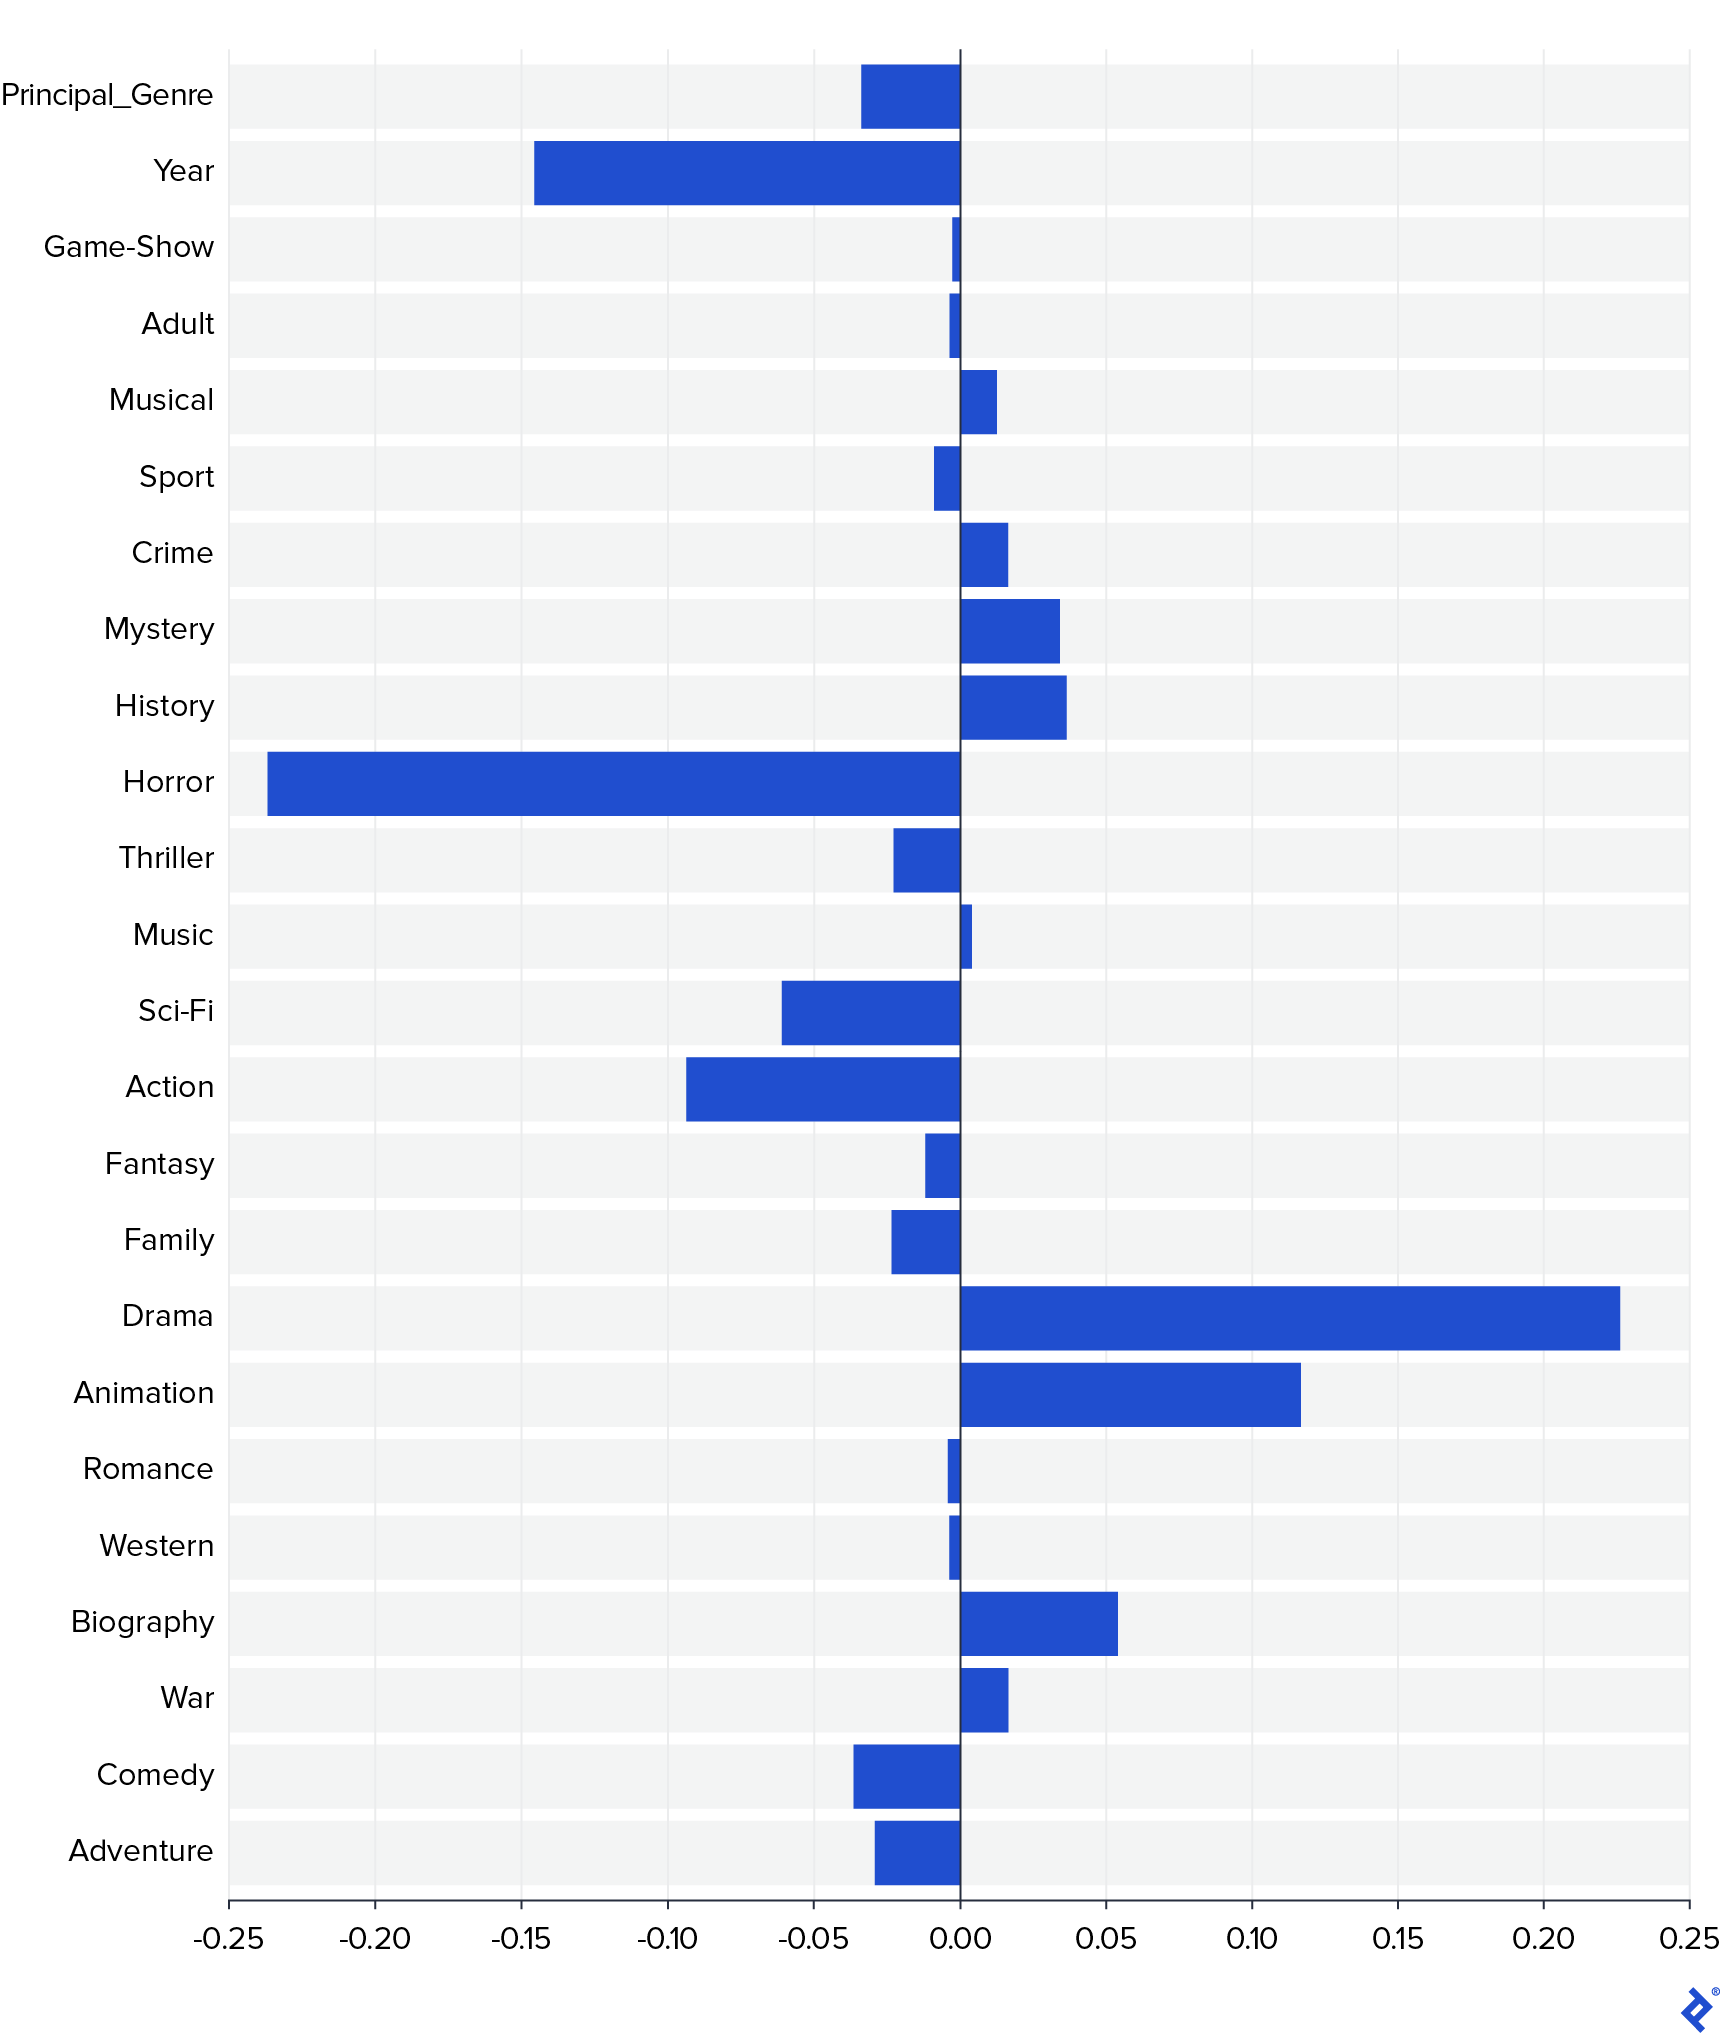
In this graph, it’s clear that two of the most important variables are Horror and Drama, where the first has a negative impact on the rating and the second a positive. There are also other fields that impact positively—like Animation and Biography—while Action, Sci-Fi, and Year impact negatively. Moreover, Principal_Genre does not have a considerable impact, so it’s more important which genres a movie has than which one is the principal.
With the generalized additive model (GAM), I could also see a more detailed impact for the continuous variables, which in this case was the Year.
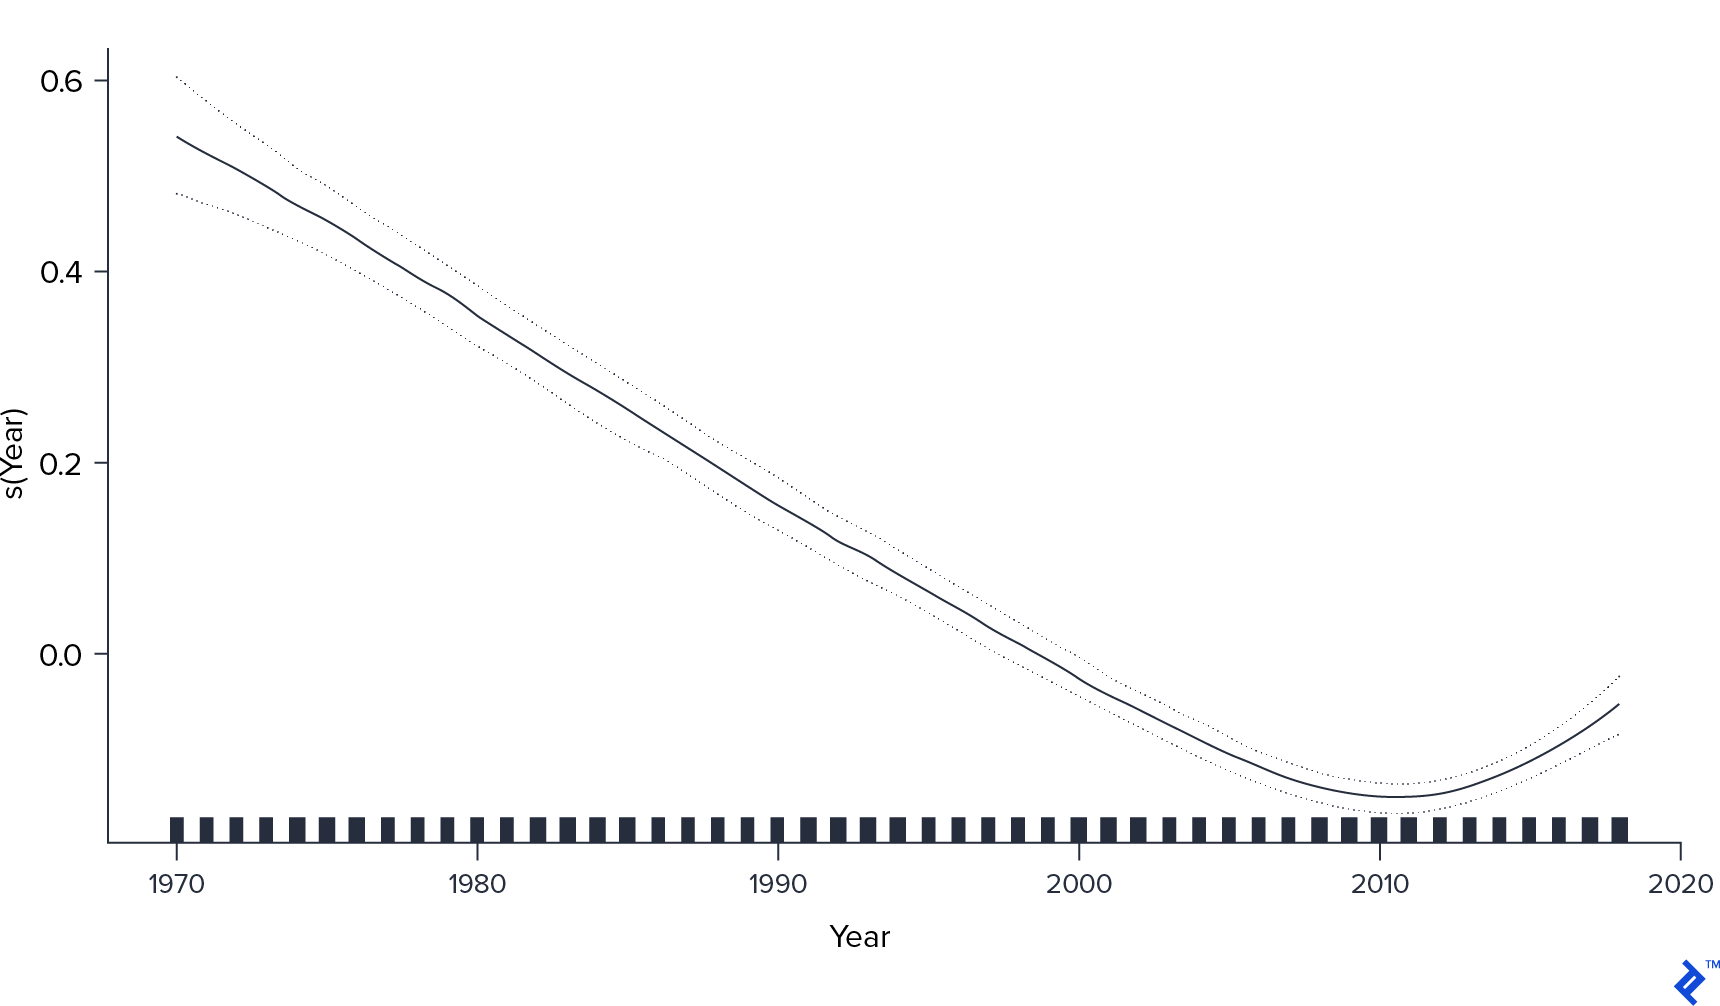
Here, we have something more interesting. While it was true that for recent movies, the rating tended to be lower, the effect was not constant. It has the lowest value in 2010 and then it appears to “recover.” It would be intriguing to find out what happened after that year in movie production that could have produced this change.
The best model was neural networks, which had the lowest RMSE and MAE, but as you can see, no model reached perfect performance. But this was not bad news in terms of my objective. The information available let me estimate the performance somewhat well, but it is not enough. There is some other information that I couldn’t get from IMDb that is making Rating differ from the expected score based on Genre, Runtime, and Year. It may be actor performance, movie scripts, photography, or many other things.
From my perspective, these other characteristics are what really matters in selecting what to watch. I don’t care if a given movie is a drama, action, or science fiction. I want it to have something special, something that makes me have a good time, makes me learn something, makes me reflect on reality, or just entertains me.
So I created a new, refined rating by taking the IMDb rating and subtracting the predicted rating of the best model. By doing this, I was removing the effect of the Genre, Runtime, and Year and keeping this other unknown information that is much more important to me.
IMDb Rating System Alternative: The Final Results
Let’s see now which are the 10 best movies by my new rating vs. by the real IMDb rating:
IMDb
| Title | Genre | IMDb Rating | Refined Rating |
|---|---|---|---|
| Ko to tamo peva | Adventure,Comedy,Drama | 8.9 | 1.90 |
| Dipu Number 2 | Adventure,Family | 8.9 | 3.14 |
| El señor de los anillos: El retorno del rey | Adventure,Drama,Fantasy | 8.9 | 2.67 |
| El señor de los anillos: La comunidad del anillo | Adventure,Drama,Fantasy | 8.8 | 2.55 |
| Anbe Sivam | Adventure,Comedy,Drama | 8.8 | 2.38 |
| Hababam Sinifi Tatilde | Adventure,Comedy,Drama | 8.7 | 1.66 |
| El señor de los anillos: Las dos torres | Adventure,Drama,Fantasy | 8.7 | 2.46 |
| Mudras Calling | Adventure,Drama,Romance | 8.7 | 2.34 |
| Interestelar | Adventure,Drama,Sci-Fi | 8.6 | 2.83 |
| Volver al futuro | Adventure,Comedy,Sci-Fi | 8.5 | 2.32 |
Mine
| Title | Genre | IMDb Rating | Refined Rating |
|---|---|---|---|
| Dipu Number 2 | Adventure,Family | 8.9 | 3.14 |
| Interestelar | Adventure,Drama,Sci-Fi | 8.6 | 2.83 |
| El señor de los anillos: El retorno del rey | Adventure,Drama,Fantasy | 8.9 | 2.67 |
| El señor de los anillos: La comunidad del anillo | Adventure,Drama,Fantasy | 8.8 | 2.55 |
| Kolah ghermezi va pesar khale | Adventure,Comedy,Family | 8.1 | 2.49 |
| El señor de los anillos: Las dos torres | Adventure,Drama,Fantasy | 8.7 | 2.46 |
| Anbe Sivam | Adventure,Comedy,Drama | 8.8 | 2.38 |
| Los caballeros de la mesa cuadrada | Adventure,Comedy,Fantasy | 8.2 | 2.35 |
| Mudras Calling | Adventure,Drama,Romance | 8.7 | 2.34 |
| Volver al futuro | Adventure,Comedy,Sci-Fi | 8.5 | 2.32 |
As you can see, the podium didn’t change radically. This was expected because the RMSE was not so high, and here we are watching the top. Let’s see what happened with the bottom 10:
IMDb
| Title | Genre | IMDb Rating | Refined Rating |
|---|---|---|---|
| Holnap történt - A nagy bulvárfilm | Comedy,Mystery | 1 | -4.86 |
| Cumali Ceber: Allah Seni Alsin | Comedy | 1 | -4.57 |
| Badang | Comedy,Fantasy | 1 | -4.74 |
| Yyyreek!!! Kosmiczna nominacja | Comedy | 1.1 | -4.52 |
| Proud American | Drama | 1.1 | -5.49 |
| Browncoats: Independence War | Action,Sci-Fi,War | 1.1 | -3.71 |
| The Weekend It Lives | Comedy,Horror,Mystery | 1.2 | -4.53 |
| Bolívar: el héroe | Animation,Biography | 1.2 | -5.34 |
| Rise of the Black Bat | Action,Sci-Fi | 1.2 | -3.65 |
| Hatsukoi | Drama | 1.2 | -5.38 |
Mine
| Title | Genre | IMDb Rating | Refined Rating |
|---|---|---|---|
| Proud American | Drama | 1.1 | -5.49 |
| Santa and the Ice Cream Bunny | Family,Fantasy | 1.3 | -5.42 |
| Hatsukoi | Drama | 1.2 | -5.38 |
| Reis | Biography,Drama | 1.5 | -5.35 |
| Bolívar: el héroe | Animation,Biography | 1.2 | -5.34 |
| Hanum & Rangga: Faith & The City | Drama,Romance | 1.2 | -5.28 |
| After Last Season | Animation,Drama,Sci-Fi | 1.7 | -5.27 |
| Barschel - Mord in Genf | Drama | 1.6 | -5.23 |
| Rasshu raifu | Drama | 1.5 | -5.08 |
| Kamifûsen | Drama | 1.5 | -5.08 |
The same thing happened here, but now we can see that more dramas appear in the refined case than in IMDb’s, which shows that some dramas could be over-ranked just for being dramas.
Maybe the most interesting podium to see is the 10 movies with the greatest difference between the IMDb rating system’s score and my refined one. These movies are the ones that have more weight on their unknown characteristics and make the movie much better (or worse) than expected for its known features.
| Title | IMDb Rating | Refined Rating | Difference |
|---|---|---|---|
| Kanashimi no beradonna | 7.4 | -0.71 | 8.11 |
| Jesucristo Superstar | 7.4 | -0.69 | 8.09 |
| Pink Floyd The Wall | 8.1 | 0.03 | 8.06 |
| Tenshi no tamago | 7.6 | -0.42 | 8.02 |
| Jibon Theke Neya | 9.4 | 1.52 | 7.87 |
| El baile | 7.8 | 0.00 | 7.80 |
| Santa and the Three Bears | 7.1 | -0.70 | 7.80 |
| La alegre historia de Scrooge | 7.5 | -0.24 | 7.74 |
| Piel de asno | 7 | -0.74 | 7.74 |
| 1776 | 7.6 | -0.11 | 7.71 |
If I were a movie director and had to produce a new movie, after doing all this IMDb data analysis, I could have a better idea of what kind of movie to make to have a better IMDb ranking. It would be a long animated biography drama that would be a remake of an old movie—for example, Amadeus. Probably this would assure a good IMDb ranking, but I’m not sure about profits…
What do you think about the movies that rank in this new measure? Do you like them? Or do you prefer the original ones? Let me know in the comments below!
Understanding the basics
What does IMDb stand for?
IMDb (the Internet Movie Database) is an online database of information related to audiovisual content.
What is the IMDb rating system?
The IMDb rating system is a way of ordering audiovisual content by a score generated through the votes of its web users.
What type of database is IMDb?
IMDb’s principal data is about movies: They store the title, year, gross, duration, genre, and other common characteristics.
What is the purpose of IMDb?
IMDb’s purpose is to be the biggest, principal encyclopedia of audiovisual content.
Juan Manuel Ortiz de Zarate
Ciudad de Buenos Aires, Buenos Aires, Argentina
Member since November 6, 2019
About the author
Juan (MSc, computer science) is a data science/AI PhD student. As a senior web developer, his main expertise includes R, Python, and PHP.
PREVIOUSLY AT


