Hunting Java Memory Leaks
Inexperienced programmers often think that Java’s automatic garbage collection frees them from the burden of memory management. This is a common misperception: while the garbage collector does its best, it’s entirely possible for even the best programmer to fall prey to crippling memory leaks.
In this post, I’ll explain how and why memory leaks occur in Java and outline an approach for detecting such leaks with the help of a visual interface.
Jose is a developer with 12+ years of experience in the development, migration, and integration of software and efficient architectures.
Inexperienced programmers often think that Java’s automatic garbage collection completely frees them from worrying about memory management. This is a common misperception: while the garbage collector does its best and Java memory leak detection is quite good, it’s entirely possible for even the best programmer to fall prey to crippling Java memory leaks.
But what is a memory leak in Java? A memory leak occurs when object references that are no longer needed are unnecessarily maintained. These leaks are bad. For one, they put unnecessary pressure on your machine as your programs consume more and more resources. To make things worse, detecting these leaks can be difficult: static analysis often struggles to precisely identify these redundant references, and existing leak detection tools track and report fine-grained information about individual objects, producing results that are hard to interpret and lack precision.
In other words, leaks are either too hard to identify, or identified in terms that are too specific to be useful. The next question is how to identify memory leaks in Java in a way that will help us address them quickly and efficiently.
There actually four categories of memory issues with similar and overlapping symptoms, but varied causes and solutions:
-
Performance: usually associated with excessive object creation and deletion, long delays in garbage collection, excessive operating system page swapping, and more.
-
Resource constraints: occurs when there’s either to little memory available or your memory is too fragmented to allocate a large object—this can be native or, more commonly, Java heap-related.
-
Java heap leaks: the classic memory leak in Java, in which objects are continuously created without being released. This is usually caused by latent object references.
-
Native memory leaks: associated with any continuously growing memory utilization that is outside the Java heap, such as allocations made by JNI code, drivers or even JVM allocations.
In this memory management tutorial, I’ll focus on Java heaps leaks and outline an approach to detect such leaks based on Java VisualVM reports and utilizing a visual interface for analyzing Java technology-based applications while they’re running.
But before you can prevent and find memory leaks, you should understand how and why they occur. (Note: If you have a good handle on the intricacies of memory leaks, you can skip ahead.)
Memory Leaks: A Primer
For starters, think of memory leakage as a disease and Java’s OutOfMemoryError (OOM, for brevity) as a symptom. But as with any disease, not all OOMs necessarily imply memory leaks: an OOM can occur due to the generation of a large number of local variables or other such events. On the other hand, not all memory leaks necessarily manifest themselves as OOMs, especially in the case of desktop applications or client applications (which aren’t run for very long without restarts).
Why are these leaks so bad? Among other things, leaking blocks of memory during program execution often degrades system performance over time, as allocated but unused blocks of memory will have to be swapped out once the system runs out of free physical memory. Eventually, a program may even exhaust its available virtual address space, leading to the OOM.
Deciphering the OutOfMemoryError
As mentioned above, the OOM is a common indication of a memory leak. Essentially, the error is thrown when there’s insufficient space to allocate a new object. Try as it might, the garbage collector can’t find the necessary space, and the heap can’t be expanded any further. Thus, an error emerges, along with a stack trace.
The first step in diagnosing your OOM is to determine what the error actually means. This sounds obvious, but the answer isn’t always so clear. For example: Is the OOM appearing because the Java heap is full, or because the native heap is full? To help you answer this question, let’s analyze a few of the the possible error messages:
-
java.lang.OutOfMemoryError: Java heap space -
java.lang.OutOfMemoryError: PermGen space -
java.lang.OutOfMemoryError: Requested array size exceeds VM limit -
java.lang.OutOfMemoryError: request <size> bytes for <reason>. Out of swap space? -
java.lang.OutOfMemoryError: <reason> <stack trace> (Native method)
“Java heap space”
This error message doesn’t necessarily imply a memory leak. In fact, the problem can be as simple as a configuration issue.
For example, I was responsible for analyzing an application which was consistently producing this type of OutOfMemoryError. After some investigation, I figured out that the culprit was an array instantiation that was demanding too much memory; in this case, it wasn’t the application’s fault, but rather, the application server was relying on the default heap size, which was too small. I solved the problem by adjusting the JVM’s memory parameters.
In other cases, and for long-lived applications in particular, the message might be an indication that we’re unintentionally holding references to objects, preventing the garbage collector from cleaning them up. This is the Java language equivalent of a memory leak. (Note: APIs called by an application could also be unintentionally holding object references.)
Another potential source of these “Java heap space” OOMs arises with the use of finalizers. If a class has a finalize method, then objects of that type do not have their space reclaimed at garbage collection time. Instead, after garbage collection, the objects are queued for finalization, which occurs later. In the Sun implementation, finalizers are executed by a daemon thread. If the finalizer thread cannot keep up with the finalization queue, then the Java heap could fill up and an OOM could be thrown.
“PermGen space”
This error message indicates that the permanent generation is full. The permanent generation is the area of the heap that stores class and method objects. If an application loads a large number of classes, then the size of the permanent generation might need to be increased using the -XX:MaxPermSize option.
Interned java.lang.String objects are also stored in the permanent generation. The java.lang.String class maintains a pool of strings. When the intern method is invoked, the method checks the pool to see if an equivalent string is present. If so, it’s returned by the intern method; if not, the string is added to the pool. In more precise terms, the java.lang.String.intern method returns a string’s canonical representation; the result is a reference to the same class instance that would be returned if that string appeared as a literal. If an application interns a large number of strings, you might need to increase the size of the permanent generation.
Note: you can use the jmap -permgen command to print statistics related to the permanent generation, including information about internalized String instances.
“Requested array size exceeds VM limit”
This error indicates that the application (or APIs used by that application) attempted to allocate an array that is larger than the heap size. For example, if an application attempts to allocate an array of 512MB but the maximum heap size is 256MB, then an OOM will be thrown with this error message. In most cases, the problem is either a configuration issue or a bug that results when an application attempts to allocate a massive array.
“Request <size> bytes for <reason>. Out of swap space?”
This message appears to be an OOM. However, the HotSpot VM throws this apparent exception when an allocation from the native heap failed and the native heap might be close to exhaustion. Included in the message are the size (in bytes) of the request that failed and the reason for the memory request. In most cases, the <reason> is the name of the source module that’s reporting an allocation failure.
If this type of OOM is thrown, you might need to use troubleshooting utilities on your operating system to diagnose the issue further. In some cases, the problem might not even be related to the application. For example, you might see this error if:
-
The operating system is configured with insufficient swap space.
-
Another process on the system is consuming all available memory resources.
It’s also is possible that the application failed due to a native leak (for example, if some bit of application or library code is continuously allocating memory but fails to releasing it to the operating system).
<reason> <stack trace> (Native method)
If you see this error message and the top frame of your stack trace is a native method, then that native method has encountered an allocation failure. The difference between this message and the previous is that the Java memory allocation failure was detected in a JNI or native method rather than in Java VM code.
If this type of OOM is thrown, you might need to use utilities on the operating system to further diagnose the issue.
Application Crash Without OOM
Occasionally, an application might crash soon after an allocation failure from the native heap. This occurs if you’re running native code that doesn’t check for errors returned by memory allocation functions.
For example, the malloc system call returns NULL if there is no memory available. If the return from malloc is not checked, then the application might crash when it attempts to access an invalid memory location. Depending on the circumstances, this type of issue can be difficult to locate.
In some cases, the information from the fatal error log or the crash dump will be sufficient. If the cause of a crash is determined to be a lack of error-handling in some memory allocations, then you must hunt down the reason for said allocation failure. As with any other native heap issue, the system might be configured with insufficient swap space, another process might be consuming all available memory resources, etc.
Diagnosing Leaks
In most cases, diagnosing memory leaks requires very detailed knowledge of the application in question. Warning: the process can be lengthy and iterative.
Our strategy for hunting down memory leaks will be relatively straightforward:
-
Identify symptoms
-
Enable verbose garbage collection
-
Enable profiling
-
Analyze the trace
1. Identify Symptoms
As discussed, in many cases, the Java process will eventually throw an OOM runtime exception, a clear indicator that your memory resources have been exhausted. In this case, you need to distinguish between a normal memory exhaustion and a leak. Analyzing the OOM’s message and try to find the culprit based on the discussions provided above.
Oftentimes, if a Java application requests more storage than the runtime heap offers, it can be due to poor design. For instance, if an application creates multiple copies of an image or loads a file into an array, it will run out of storage when the image or file is very large. This is a normal resource exhaustion. The application is working as designed (although this design is clearly boneheaded).
But if an application steadily increases its memory utilization while processing the same kind of data, you might have a memory leak.
2. Enable Verbose Garbage Collection
One of the quickest ways to assert that you indeed have a memory leak is to enable verbose garbage collection. Memory constraint problems can usually be identified by examining patterns in the verbosegc output.
Specifically, the -verbosegc argument allows you to generates a trace each time the garbage collection (GC) process is begun. That is, as memory is being garbage-collected, summary reports are printed to standard error, giving you a sense of how your memory is being managed.
Here’s some typical output generated with the –verbosegc option:

Each block (or stanza) in this GC trace file is numbered in increasing order. To make sense of this trace, you should look at successive Allocation Failure stanzas and look for freed memory (bytes and percentage) decreasing over time while total memory (here, 19725304) is increasing. These are typical signs of memory depletion.
3. Enable Profiling
Different JVMs offer different ways to generate trace files to reflect heap activity, which typically include detailed information about the type and size of objects. This is called profiling the heap.
4. Analyze the Trace
This post focuses on the trace generated by Java VisualVM. Traces can come in different formats, as they can be generated by different Java memory leak detection tools, but the idea behind them is always the same: find a block of objects in the heap that should not be there, and determine if these objects accumulate instead of releasing. Of particular interest are transient objects that are known to be allocated each time a certain event is triggered in the Java application. The presence of many object instances that ought to exist only in small quantities generally indicates an application bug.
Finally, solving memory leaks requires you to review your code thoroughly. Learning about the type of object leaking can be very helpful and considerably speed up debugging.
How Does Garbage Collection Work in the JVM?
Before we start our analysis of an application with a memory leak issue, let’s first look at how garbage collection works in the JVM.
The JVM uses a form of garbage collector called a tracing collector, which essentially operates by pausing the world around it, marking all root objects (objects referenced directly by running threads), and following their references, marking each object it sees along the way.
Java implements something called a generational garbage collector based upon the generational hypothesis assumption, which states that the majority of objects that are created are quickly discarded, and objects that are not quickly collected are likely to be around for a while.
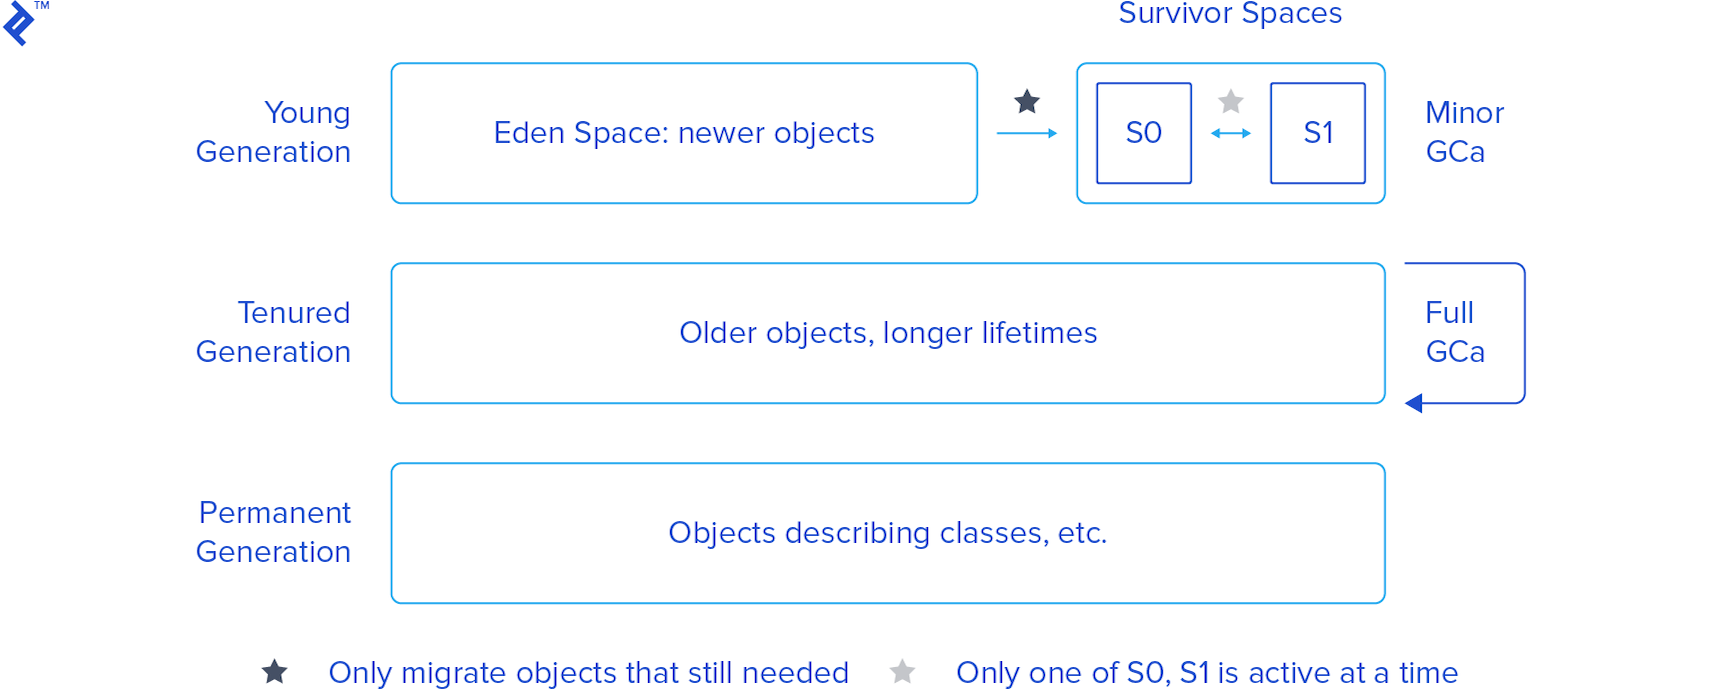
Based on this assumption, Java partitions objects into multiple generations. Here’s a visual interpretation:

-
Young Generation - This is where objects start out. It has two sub-generations:
-
Eden Space - Objects start out here. Most objects are created and destroyed in the Eden Space. Here, the GC does Minor GCs, which are optimized garbage collections. When a Minor GC is performed, any references to objects that are still needed are migrated to one of the survivors spaces (S0 or S1).
-
Survivor Space (S0 and S1) - Objects that survive Eden end up here. There are two of these, and only one is in use at any given time (unless we have a serious memory leak). One is designated as empty, and the other as live, alternating with every GC cycle.
-
-
Tenured Generation - Also known as the old generation (old space in Fig. 2), this space holds older objects with longer lifetimes (moved over from the survivor spaces, if they live for long enough). When this space is filled up, the GC does a Full GC, which costs more in terms of performance. If this space grows without bound, the JVM will throw an
OutOfMemoryError - Java heap space. -
Permanent Generation - A third generation closely related to the tenured generation, the permanent generation is special because it holds data required by the virtual machine to describe objects that do not have an equivalence at the Java language level. For example, objects describing classes and methods are stored in the permanent generation.
Java is smart enough to apply different garbage collection methods to each generation. The young generation is handled using a tracing, copying collector called the Parallel New Collector. This collector stops the world, but because the young generation is generally small, the pause is short.
For more information about the JVM generations and how them work in more detail visit the Memory Management in the Java HotSpot™ Virtual Machine documentation.
How to Find Memory Leaks in Java
To find memory leaks and eliminate them, you need the proper memory leak tools. It’s time to detect and remove such a leak using the Java VisualVM.
Remotely Profiling the Heap with Java VisualVM
VisualVM is a tool that provides a visual interface for viewing detailed information about Java technology-based applications while they are running.
With VisualVM, you can view data related to local applications and those running on remote hosts. You can also capture data about JVM software instances and save the data to your local system.
In order to benefit from all of Java VisualVM’s features, you should run the Java Platform, Standard Edition (Java SE) version 6 or above.
Enabling Remote Connection for the JVM
In a production environment, it’s often difficult to access the actual machine on which our code will be running. Luckily, we can profile our Java application remotely.
First, we need to grant ourselves JVM access on the target machine. To do so, create a file called jstatd.all.policy with the following content:
grant codebase "file:${java.home}/../lib/tools.jar" {

   permission java.security.AllPermission;

};
Once the file has been created, we need to enable remote connections to the target VM using the jstatd - Virtual Machine jstat Daemon tool, as follows:
jstatd -p <PORT_NUMBER> -J-Djava.security.policy=<PATH_TO_POLICY_FILE>
For example:
jstatd -p 1234 -J-Djava.security.policy=D:\jstatd.all.policy
With the jstatd started in the target VM, we are able to connect to the target machine and remotely profile the application with memory leak issues.
Connecting to a Remote Host
In the client machine, open a prompt and type jvisualvm to open the VisualVM tool.
Next, we must add a remote host in VisualVM. As the target JVM is enabled to allow remote connections from another machine with J2SE 6 or greater, we start the Java VisualVM tool and connect to the remote host. If the connection with the remote host was successful, we will see the Java applications that are running in the target JVM, as seen here:

To run a memory profiler on the application, we just double-click its name in the side panel.
Now that we’re all set up with a memory analyzer, let’s investigate an application with a memory leak issue, which we’ll call MemLeak.
MemLeak
Of course, there are a number of ways to create memory leaks in Java. For simplicity we will define a class to be a key in a HashMap, but we will not define the equals() and hashcode() methods.
A HashMap is a hash table implementation for the Map interface, and as such it defines the basic concepts of key and value: each value is related to a unique key, so if the key for a given key-value pair is already present in the HashMap, its current value is replaced.
It’s mandatory that our key class provides a correct implementation of the equals() and hashcode() methods. Without them, there is no guarantee that a good key will be generated.
By not defining the equals() and hashcode() methods, we add the same key to the HashMap over and over and, instead of replacing the key as it should, the HashMap grows continuously, failing to identify these identical keys and throwing an OutOfMemoryError.
Here’s the MemLeak class:
package com.post.memory.leak;

import java.util.Map;

public class MemLeak {

    public final String key;


    public MemLeak(String key) {

        this.key =key;

    }


    public static void main(String args[]) {

        try {

            Map map = System.getProperties();


            for(;;) {

                map.put(new MemLeak("key"), "value");

            }

        } catch(Exception e) {

            e.printStackTrace();

        }

    }

}
Note: the memory leak is not due to the infinite loop on line 14: the infinite loop can lead to a resource exhaustion, but not a memory leak. If we had properly implemented equals() and hashcode() methods, the code would run fine even with the infinite loop as we would only have one element inside the HashMap.
(For those interested, here are some alternative means of (intentionally) generating leaks.)
Using Java VisualVM
With Java VisualVM, we can memory-monitor the Java Heap and identify if its behavior is indicative of a memory leak.
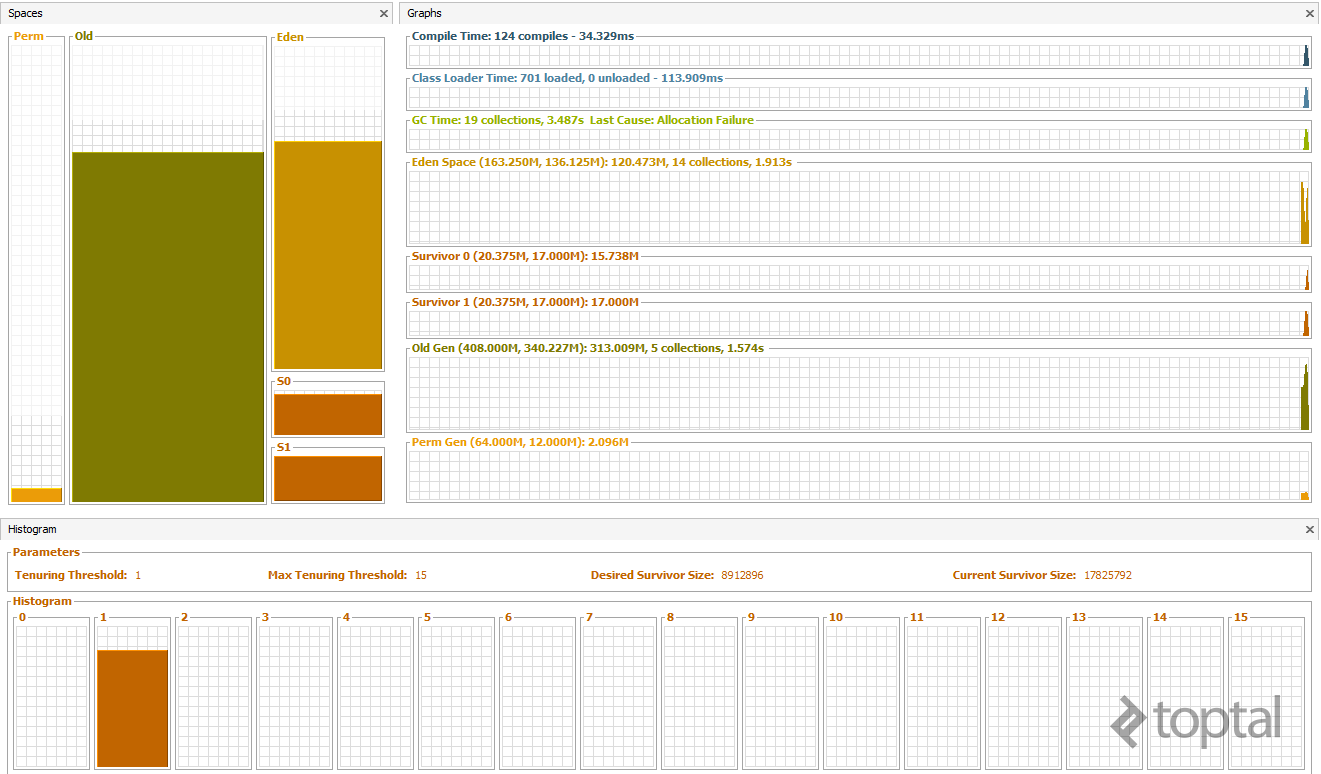
Here’s a graphical representation of MemLeak’s Java Heap analyzer just after initialization (recall our discussion of the various generations):

After just 30 seconds, the Old Generation is almost full, indicating that, even with a Full GC, the Old Generation is ever-growing, a clear sign of a memory leak.
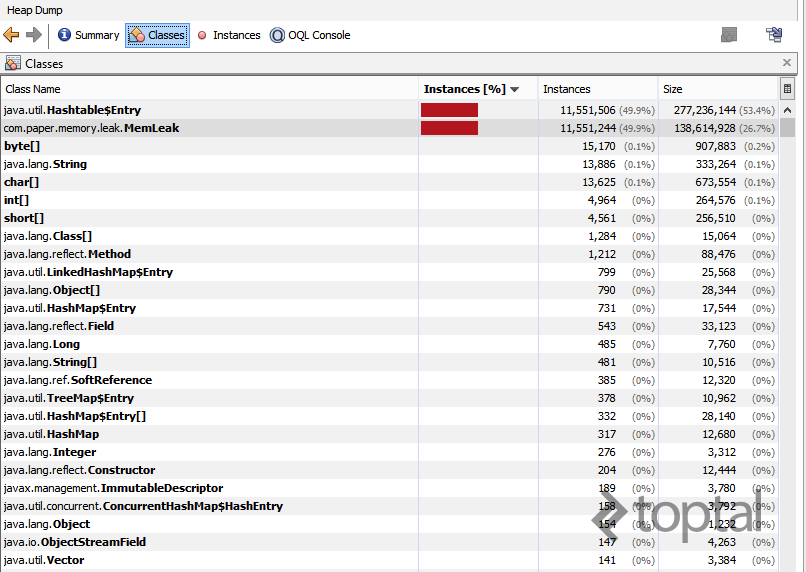
One means of detecting the cause of this leak is shown in the following image (click to zoom), generated using Java VisualVM with a heapdump. Here, we see that 50% of Hashtable$Entry objects are in the heap, while the second line points us to the MemLeak class. Thus, the memory leak is caused by a hash table used within the MemLeak class.

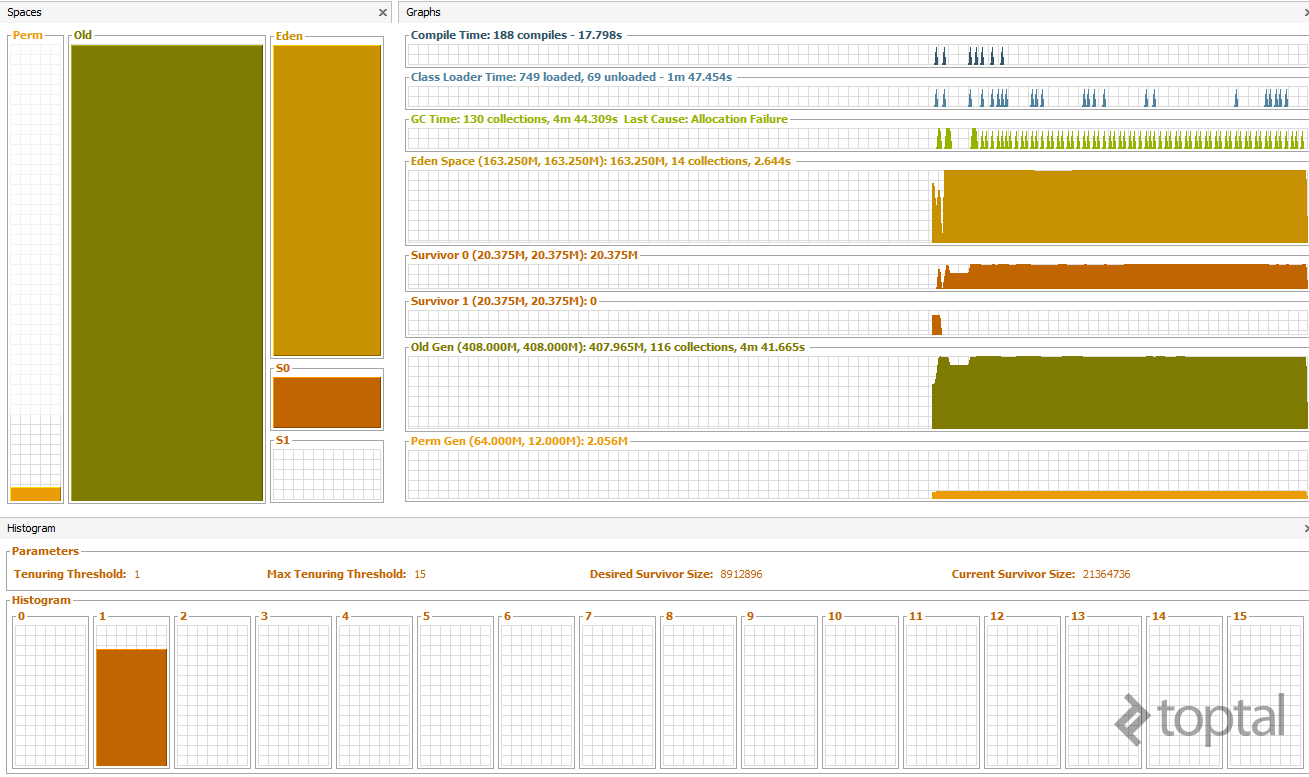
Finally, observe the Java Heap just after our OutOfMemoryError in which the Young and Old generations are completely full.

Conclusion
Memory leaks are among the most difficult Java application problems to resolve, as the symptoms are varied and difficult to reproduce. Here, we’ve outlined a step-to-step approach to discovering memory leaks and identifying their sources. But above all, read your error messages closely and pay attention to your stack traces—not all leaks are as simple as they appear.
Appendix
Along with Java VisualVM, there are several other tools that can perform memory leak detection. Many leak detectors operate at the library level by intercepting calls to memory management routines. For example, HPROF, is a simple command line tool bundled with the Java 2 Platform Standard Edition (J2SE) for heap and CPU profiling. The output of HPROF can be analyzed directly or used as an input for others tools like JHAT. When we work with Java 2 Enterprise Edition (J2EE) applications, there are a number of heap dump analyzer solutions that are friendlier, such as IBM Heapdumps for Websphere application servers.
Further Reading on the Toptal Blog:
Understanding the basics
What is a memory leak?
A memory leak is when memory is marked “in use” even though it’s no longer needed, and it will never be freed by the process that created it.
How do you fix a memory leak?
It depends on the leak in question: Some are simpler to spot and fix than others. In the end, it comes down to not holding references to objects that are no longer needed. Sometimes this is in your own code, but sometimes it’s in libraries that your code uses.
How do you find a memory leak?
If an application steadily increases its memory utilization while processing the same kind of data, you might have a memory leak. You can help to narrow leak sources by analyzing traces. The presence of many object instances that ought to exist only in small quantities generally indicates a memory leak.
What is heap size?
Heap size determines how much memory is available to the JVM for allocation. Whenever you create a new object, it’s stored on the heap contiguously.
How does garbage collection work in Java?
The JVM uses different garbage collection methods for different groups of data. Data is classified by how long it tends to hang around before being discarded. For short-term data, it pauses everything and uses a tracing, copying collector to free memory that’s no longer referenced.
How to fix memory leaks in Java
Fixing memory leaks in Java involves observing symptoms, using verbose GC and profiling, and analyzing memory traces, followed by a thorough review of the code that makes use of the objects involved in the leak.
About the author
Jose is a developer with 12+ years of experience in the development, migration, and integration of software and efficient architectures.

