WebVR Part 4: Canvas Data Visualizations
Unlock the mysteries of the canvas component for your own visualizations. We have completed the simulation math, and now it’s time for some creative play.
In Part 4 of our WebVR series, we use the canvas element to make three rapid iterations to visualize the gravitational orbits of the planets in our simulation.
Michael is an expert full-stack web engineer, speaker, and consultant with over two decades of experience and a degree in computer science.
Expertise
PREVIOUSLY AT

Hurray! We set out to create a Proof of Concept for WebVR. Our previous blog posts completed the simulation, so now it’s time for a little creative play.
This is an incredibly exciting time to be a designer and developer because VR is a paradigm shift.
In 2007, Apple sold the first iPhone, kicking off the smartphone consumption revolution. By 2012, we were well into “mobile-first” and “responsive” web design. In 2019, Facebook and Oculus released the first mobile VR headset. Let’s do this!
The “mobile-first“ internet wasn’t a fad, and I predict the “VR-first” internet won’t be either. In the previous three articles and demos, I demonstrated the technological possibility in your current browser.
If you’re picking this up in the middle of the series, we’re building a celestial gravity simulation of spinny planets.
- Part 1: Intro and Architecture
- Part 2: Web Workers get us additional browser threads
- Part 3: WebAssembly and AssemblyScript for our O(n²) performance bottleneck code
Standing on the work we’ve done, it’s time for some creative play. In the last two posts, we’ll explore canvas and WebVR and the user experience.
- Part 4: Canvas Data Visualization (this post)
- Part 5: WebVR Data Visualization
Today, we are going to bring our simulation to life. Looking back, I noticed how much more excited and interested I was in completing the project once I started working on the visualizers. The visualizations made it interesting to other people.
The purpose of this simulation was to explore the technology that will enable WebVR - Virtual Reality in the browser - and the coming VR-first web. These same technologies can power browser-edge computing.
Rounding out our Proof of Concept, today we’ll first create a canvas visualization.

In the final post, we’ll look at VR design and make a WebVR version to get this project to “done.”

The Simplest Thing That Could Possibly Work: console.log()
Back to RR (Real Reality). Let’s create some visualizations for our browser-based “n-body” simulation. I’ve used canvas in web video applications in past projects but never as an artist’s canvas. Let’s see what we can do.
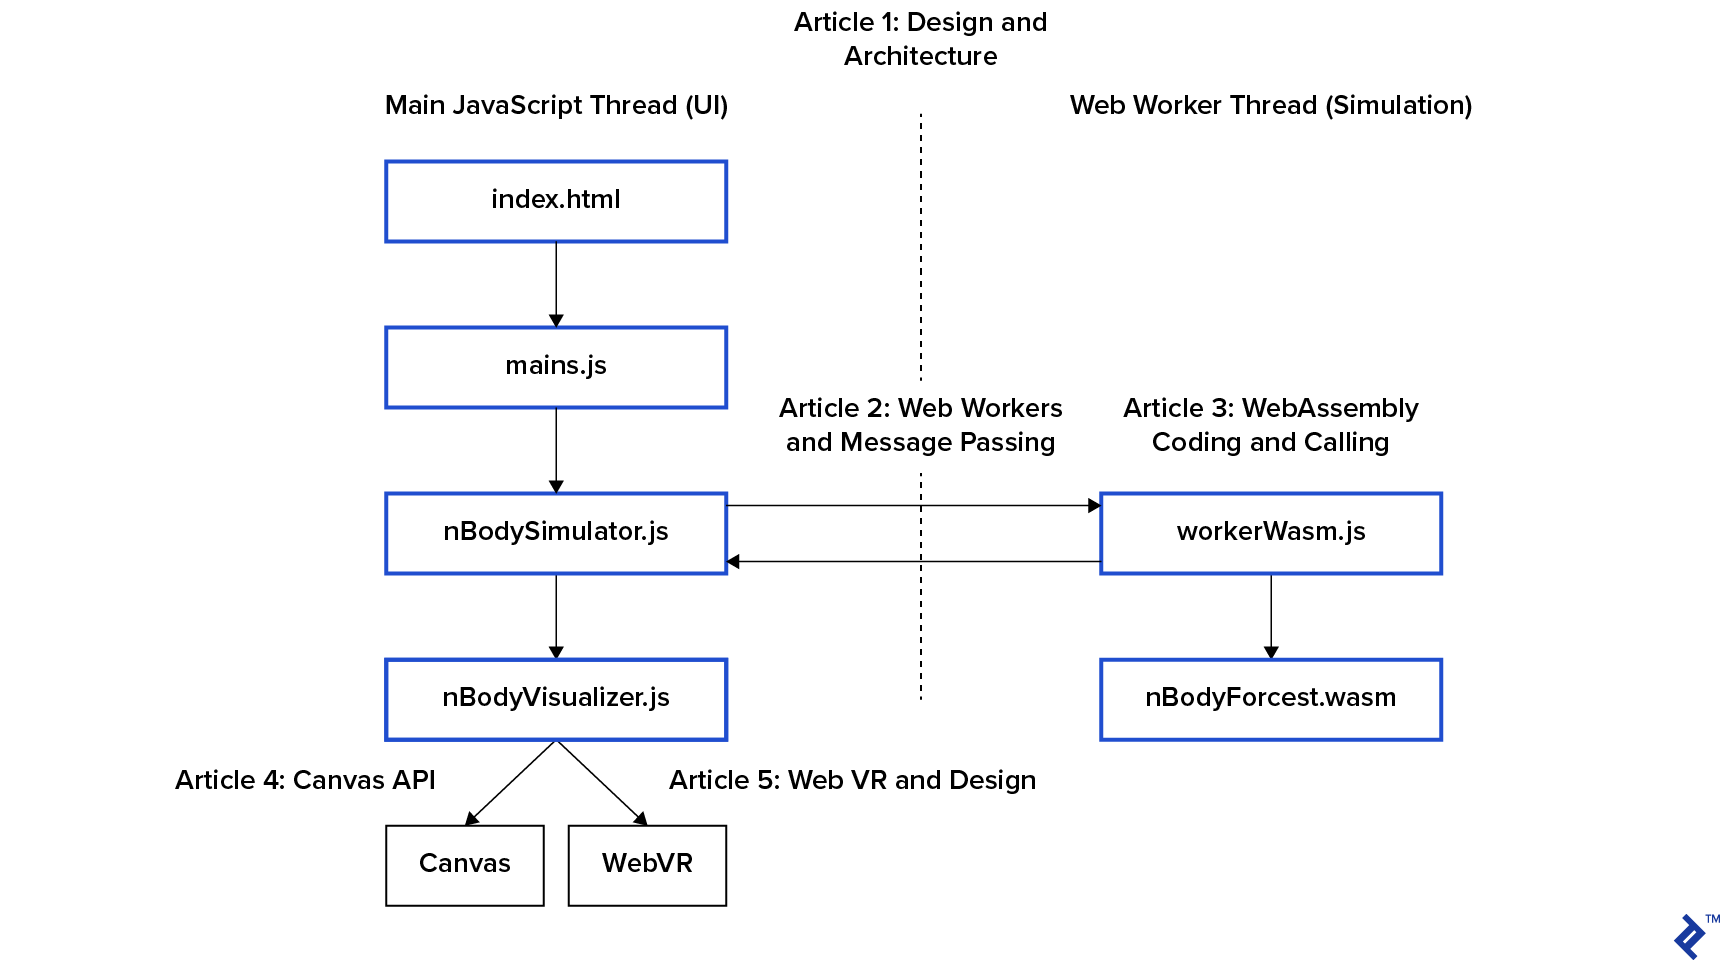
If you remember our project architecture, we delegated the visualization to nBodyVisualizer.js.

nBodySimulator.js has a simulation loop start() that calls its step() function, and the bottom of step() calls this.visualize()
// src/nBodySimulator.js

  /**

   * This is the simulation loop.

   */

  async step() {

	// Skip calculation if worker not ready. Runs every 33ms (30fps). Will skip.

	if (this.ready()) {

  		await this.calculateForces()

	} else {

  	console.log(`Skipping calculation: ${this.workerReady} ${this.workerCalculating}`)

	}

	// Remove any "debris" that has traveled out of bounds

	// This keeps the button from creating uninteresting work.

	this.trimDebris()

	// Now Update forces. Reuse old forces if worker is already busy calculating.

	this.applyForces()

	// Now Visualize

	this.visualize()

  }
When we press the green button, the main thread adds 10 random bodies to the system. We touched the button code in the first post, and you can see it in the repo here. Those bodies are great for testing a proof of concept, but remember we are in dangerous performance territory - O(n²).
Humans are designed to care about the people and things they can see, so trimDebris() removes objects that are flying out of sight so they don’t slow down the rest. This is the difference between perceived and actual performance.
Now that we’ve covered everything but the final this.visualize(), let’s take a look!
// src/nBodySimulator.js

  /**

   * Loop through our visualizers and paint()

   */

  visualize() {

	this.visualizations.forEach(vis => {

  		vis.paint(this.objBodies)

	})

  }

  /**

   * Add a visualizer to our list

   */

  addVisualization(vis) {

	this.visualizations.push(vis)

  }
These two functions let us add multiple visualizers. There are two visualizers in the canvas version:
// src/main.js

window.onload = function() {

  // Create a Simulation

  const sim = new nBodySimulator()


  // Add some visualizers

  sim.addVisualization(

    new nBodyVisPrettyPrint(document.getElementById("visPrettyPrint"))

  )

  sim.addVisualization(

    new nBodyVisCanvas(document.getElementById("visCanvas"))

  )

  …
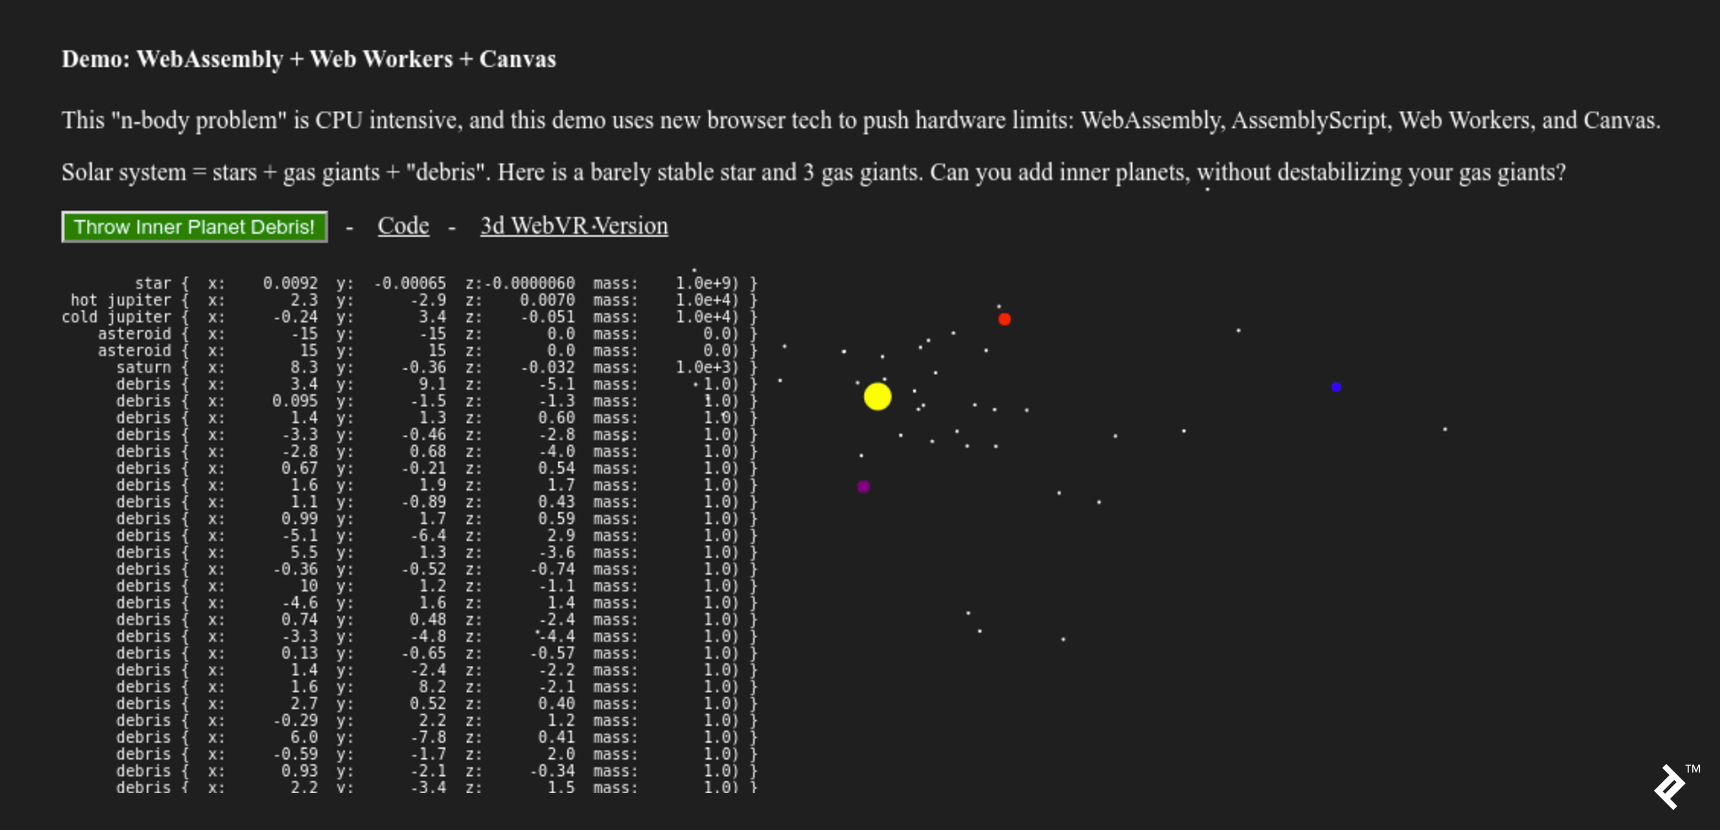
In the canvas version, the first visualizer is the table of white numbers displayed as HTML. The second visualizer is a black canvas element underneath.

To create this, I started with a simple base class in nBodyVisualizer.js:
// src/nBodyVisualizer.js

/**

 * This is a toolkit of visualizers for our simulation.

 */

/**

 * Base class that console.log()s the simulation state.

 */

export class nBodyVisualizer {

  constructor(htmlElement) {

	this.htmlElement = htmlElement

	this.resize()

  }

  resize() {}

  paint(bodies) {

	console.log(JSON.stringify(bodies, null, 2))

  }

}
This class prints to the console (every 33ms!) and also tracks an htmlElement - which we’ll use in subclasses to make them easy to declare in main.js.
This is the simplest thing that could possibly work.
However, while this console visualization is definitely simple, it doesn’t actually “work.” The browser console (and browsing humans) are not designed to process log messages at 33ms velocity. Let’s find the next simplest thing that could possibly work.
Visualizing Simulations with Data
The next “pretty print” iteration was to print text to an HTML element. This is also the pattern we use for the canvas implementation.
Notice we’re saving a reference to an htmlElement the visualizer will paint upon. Like everything else on the web, it has a mobile-first design. On desktop, this prints the data table of objects and their coordinates on the left of the page. On mobile it would result in visual clutter so we skip it.
/**

 * Pretty print simulation to an htmlElement's innerHTML

 */

export class nBodyVisPrettyPrint extends nBodyVisualizer {

  constructor(htmlElement) {

	super(htmlElement)

	this.isMobile = /iPhone|iPad|iPod|Android/i.test(navigator.userAgent);

  }

  resize() {}

  paint(bodies) {


	if (this.isMobile) return

	let text = ''

	function pretty(number) {

  		return number.toPrecision(2).padStart(10)

	}

	bodies.forEach( body => {

  	text += `<br>${body.name.padStart(12)} {  x:${pretty(body.x)}  y:${pretty(body.y)}  z:${pretty(body.z)}  mass:${pretty(body.mass)}) }`

	})

	if (this.htmlElement) this.htmlElement.innerHTML = text

  }

}
This “data stream” visualizer has two functions:
- It’s a way to “sanity check” the simulation’s inputs into the visualizer. This is a “debug” window.
- It’s cool to look at, so let’s keep it for the desktop demo!
Now that we’re fairly confident in our inputs, let’s talk about graphics and canvas.
Visualizing Simulations with 2D Canvas
A “Game Engine” is a “Simulation Engine” with explosions. Both are incredibly complicated tools because they focus on asset pipelines, streaming level loading, and all kinds of incredibly boring stuff that should never be noticed.
The web has also created its own “things that should never be noticed” with “mobile-first” design. If the browser resizes, our canvas’s CSS will resize the canvas element in the DOM, so our visualizer must adapt or suffer users’ contempt.
#visCanvas {

  	margin: 0;

  	padding: 0;

  	background-color: #1F1F1F;

  	overflow: hidden;

  	width: 100vw;

  	height: 100vh;

}
This requirement drives resize() in the nBodyVisualizer base class and the canvas implementation.
/**

 * Draw simulation state to canvas

 */

export class nBodyVisCanvas extends nBodyVisualizer {

  constructor(htmlElement) {

	super(htmlElement)

	// Listen for resize to scale our simulation

	window.onresize = this.resize.bind(this)

  }

	// If the window is resized, we need to resize our visualization

  resize() {

	if (!this.htmlElement) return

	this.sizeX = this.htmlElement.offsetWidth

	this.sizeY = this.htmlElement.offsetHeight

	this.htmlElement.width = this.sizeX

	this.htmlElement.height = this.sizeY

	this.vis = this.htmlElement.getContext('2d')

  }
This results in our visualizer having three essential properties:
-
this.vis- can be used to draw primitives this.sizeX-
this.sizeY- the dimensions of the drawing area
Canvas 2D Visualization Design Notes
Our resizing works against the default canvas implementation. If we were visualizing a product or data graph, we’d want to:
- Draw to the canvas (at a preferred size and aspect ratio)
- Then have the browser resize that drawing into the DOM element during page layout
In this more common use case, the product or graph is the focus of the experience.
Our visualization is instead a theatrical visualization of the vastness of space, dramatized by flinging dozens of tiny worlds into the void for fun.
Our celestial bodies demonstrate that space through modesty - keeping themselves between 0 and 20 pixels wide. This resizing scales the space between the dots to create a sense of “scientific” spaciousness and enhances perceived velocity.
To create a sense of scale between objects with vastly different masses, we initialize bodies with a drawSize proportional to mass:
// nBodySimulation.js

export class Body {

  constructor(name, color, x, y, z, mass, vX, vY, vZ) {

	...

	this.drawSize = Math.min(   Math.max( Math.log10(mass), 1),   10)

  }

}
Handcrafting Bespoke Solar Systems
Now, when we create our solar system in main.js, we’ll have all the tools we need for our visualization:
	// Set Z coords to 1 for best visualization in overhead 2D canvas

	// Making up stable universes is hard

	//   name        	color 	x	y	z	m  	vz	vy   vz

  sim.addBody(new Body("star",  "yellow", 0,   0,   0,   1e9))

  sim.addBody(new Body("hot jupiter",  "red",   -1,  -1,   0,   1e4,  .24,  -0.05,  0))

  sim.addBody(new Body("cold jupiter", "purple", 4,   4, -.1,   1e4, -.07,   0.04,  0))

	// A couple far-out asteroids to pin the canvas visualization in place.

  sim.addBody(new Body("asteroid", 	"black", -15,  -15,  0,  0))

  sim.addBody(new Body("asteroid", 	"black",  15,   15,  0,  0))

	// Start simulation

  sim.start()
You may notice the two “asteroids” at the bottom. These zero mass objects are a hack used to “pin” the smallest viewport of the simulation to a 30x30 area centered on 0,0.
We’re now ready for our paint function. The cloud of bodies can “wobble” away from the origin (0,0,0), so we must also shift in addition to scale.
We are “done” when the simulation has a natural feel to it. There’s no “right” way to do it. To arrange the initial planet positions, I just fiddled with the numbers until it held together long enough to be interesting.
	// Paint on the canvas

paint(bodies) {

	if (!this.htmlElement) return

	// We need to convert our 3d float universe to a 2d pixel visualization

	// calculate shift and scale

	const bounds = this.bounds(bodies)

	const shiftX = bounds.xMin

	const shiftY = bounds.yMin

	const twoPie = 2 * Math.PI


	let scaleX = this.sizeX / (bounds.xMax - bounds.xMin)

	let scaleY = this.sizeY / (bounds.yMax - bounds.yMin)

	if (isNaN(scaleX) || !isFinite(scaleX) || scaleX < 15) scaleX = 15

	if (isNaN(scaleY) || !isFinite(scaleY) || scaleY < 15) scaleY = 15

	// Begin Draw

	this.vis.clearRect(0, 0, this.vis.canvas.width, this.vis.canvas.height)

		bodies.forEach((body, index) => {

  	// Center

  		const drawX = (body.x - shiftX) * scaleX

  		const drawY = (body.y - shiftY) * scaleY

  	// Draw on canvas

  		this.vis.beginPath();

  		this.vis.arc(drawX, drawY, body.drawSize, 0, twoPie, false);

  		this.vis.fillStyle = body.color || "#aaa"

  		this.vis.fill();

	});

  }

	// Because we draw the 3D space in 2D from the top, we ignore z

bounds(bodies) {

	const ret = { xMin: 0, xMax: 0, yMin: 0, yMax: 0, zMin: 0, zMax: 0 }

	bodies.forEach(body => {

		if (ret.xMin > body.x) ret.xMin = body.x

		if (ret.xMax < body.x) ret.xMax = body.x

		if (ret.yMin > body.y) ret.yMin = body.y

		if (ret.yMax < body.y) ret.yMax = body.y

		if (ret.zMin > body.z) ret.zMin = body.z

		if (ret.zMax < body.z) ret.zMax = body.z
	})
	return ret
  }

}
The actual canvas drawing code is only five lines - each starting with this.vis. The rest of the code is the scene’s grip.
Art Is Never Finished, It Must Be Abandoned
When clients seem to be spending money that’s not going to make them money, right now is a good time to bring it up. Investing in art is a business decision.
The client for this project (me) decided to move on from the canvas implementation to WebVR. I wanted a flashy hype-filled WebVR demo. So let’s wrap this up and get some of that!
With what we’ve learned, we could take this canvas project in a variety of directions. If you remember from the second post, we are making several copies of the body data in memory:

If performance is more important than design complexity, it’s possible to pass the canvas’s memory buffer to the WebAssembly directly. This saves a couple of memory copies, which adds up for performance:
- CanvasRenderingContext2D prototype to AssemblyScript
- Optimizing CanvasRenderingContext2D Function Calls Using AssemblyScript
- OffscreenCanvas — Speed up Your Canvas Operations with a Web Worker
Just like WebAssembly and AssemblyScript, these projects are handling upstream compatibility breaks as the specifications envision these amazing new browser features.
All of these projects - and all the open-source I used here - are building foundations for the future of the VR-first internet commons. We see you and thank you!
In the final post, we’ll look at some important design differences between creating a VR scene vs. a flat-web page. And because VR is non-trivial, we’ll build our spinny world with a WebVR framework. I chose Google’s A-Frame, which is also built upon canvas.
It’s been a long journey to get to the beginning of WebVR. But this series wasn’t about the A-Frame hello world demo. I wrote this series in my excitement to show you the browser technology foundations that will power the internet’s VR-first worlds to come.
Michael Cole
Dallas, United States
Member since September 10, 2014
About the author
Michael is an expert full-stack web engineer, speaker, and consultant with over two decades of experience and a degree in computer science.
Expertise
PREVIOUSLY AT


