How to Build a Basic Python Cash Flow Model for a Loan
Python has taken the financial programming world by storm, and demand for finance experts who can use it is soaring. Here, a Toptal finance professional and Python expert shows beginners how to build a loan payment cash flow model with Python.
Python has taken the financial programming world by storm, and demand for finance experts who can use it is soaring. Here, a Toptal finance professional and Python expert shows beginners how to build a loan payment cash flow model with Python.
Miklos is an expert in cash flow modeling and Python programming, and has worked for Morgan Stanley and DBRS Morningstar. He is a Toptal finance expert and the director of the structured finance consulting company Pylink Ltd.
Expertise
PREVIOUSLY AT

Many financial experts are adept at using Excel to build financial models. However, because of difficulties with peer review, version control, and the inability to form recursive functions, Excel may not be the best choice for more sophisticated models. Despite these drawbacks, many financial professionals still use Excel because they are less confident with programming languages such as Python.
Python is one of the easiest programming languages to learn. Because it was designed with readability and ease of use in mind, its code is concise and close to plain English. In this article, I show how easy it is to build a Python cash flow model for loan payments by using the most basic functions, packages, and data structures.
To follow along, you will need to use Colaboratory (“Colab” for short), Google’s free web-based notebook application that lets you write and execute code. Colab is a Python interpreter that uses cells that can contain code, Markdown (for easily styled text), images, or other data. Colab continuously stores the values of your code as you write, making it quick and simple to catch mistakes or bugs as they appear. (If you don’t want to jump in just yet, follow along with this example Colab notebook.)
First, Make Sure You Have the Tools You Need
We will be building a model for an amortized loan that has a scheduled, periodic payment applied to both the loan’s principal and the interest. It has a fixed installment for each period and the interest portion of the payments decreases over time. You will need three Python libraries, collections of software routines that prevent developers from having to write code from scratch, for this model—NumPy, Pandas, and Matplotlib:
numpy-financial==1.0.0pandas==1.2.3matplotlib==3.2.2
In Colab, the Pandas and Matplotlib packages are installed by default, so you only need to install the numpy-financial library, which you can do directly from Colab. To install numpy-financial, and import all three libraries you will need later, open a new Colab notebook from the File menu, and paste the following into the first code cell:
# initial set-up
!pip install numpy_financial
import pandas as pd
import numpy_financial as npf
import matplotlib.pyplot as plt
from collections import namedtuple
Before we move on to the next step, let me explain the previous code and why it’s written the way it’s written. Even though numpy-financial’s name contains a hyphen, you must use an underscore in the name when you install and import it. (For more information and explanation on installing numpy_financial, check out the documentation.) You may notice abbreviations, too. Pre-defined aliases are commonly used for packages—NumPy is written as np, Pandas as pd. These aliases are used to save you from writing the full name of the package every time you would like to use it and also help to make your code more readable.
Now, Use NumPy to Set Up the Loan Characteristics
NumPy is one of the most popular Python libraries adding support for large, multidimensional arrays, along with a significant collection of high-level mathematical functions to operate on those arrays. The numpy-financial library is a relatively new package made up of a collection of commonly used financial functions that have been separated from the main NumPy library and given their own pride of place.
The simplest way to calculate the scheduled interest and principal vectors for the life of our amortized loan is to use the PMT, IPMT, and PPMT functions from the numpy-financial package. The PMT function provides the fixed loan installment to pay the loan in full over a given number of periods. The IPMT and PPMT functions provide the interest and principal payments, respectively. Depending on the input to the period, the IPMT and PPMT functions can return values for a single period or a number of periods.
For this example, we will provide a range with the full life of the loan as the period input. As such, we will get vector arrays with the interest in principal payments for each period of the loan life:
# loan characteristics
original_balance = 500_000
coupon = 0.08
term = 120

# payments
periods = range(1, term+1)
interest_payment = npf.ipmt(
    rate=coupon / 12, per=periods, nper=term, pv=-original_balance)
principal_payment = npf.ppmt(
    rate=coupon / 12, per=periods, nper=term, pv=-original_balance)
You won’t “see” anything happen in your Colab file after entering the code—it is the basic loan information needed to do the rest of this exercise. (A list of all the numpy-financial functions I’ve used, their definitions, and their inputs, can be found in the official documentation.)
Next, Use Matplotlib to Create a Chart
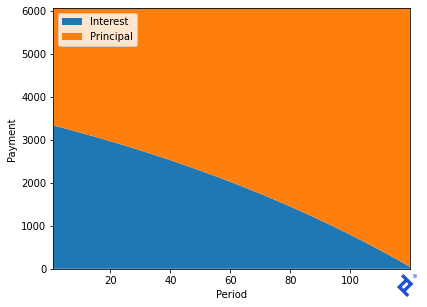
While it is good to have the vectors as an output, it may be best to visualize the output in the form of a chart, specifically as a stack plot. To set up the chart, we will use plt, the alias for the pyplot collection of functions from the matplotlib library. In our example, we will add a legend in the top left corner and add titles to the x-axis and the y-axis. As we do not want an internal border, we set the margins to 0.
Add another code cell, and insert the following code:
plt.stackplot(periods, interest_payment, principal_payment,
              labels=['Interest', 'Principal'])
plt.legend(loc='upper left')
plt.xlabel("Period")
plt.ylabel("Payment")
plt.margins(0, 0)

As we can see, the interest decreases over time. The loan balance also decreases due to the principal payments in each period. To maintain the fixed installment, the principal portion has to increase.
Finally, Use Pandas to Create a Table
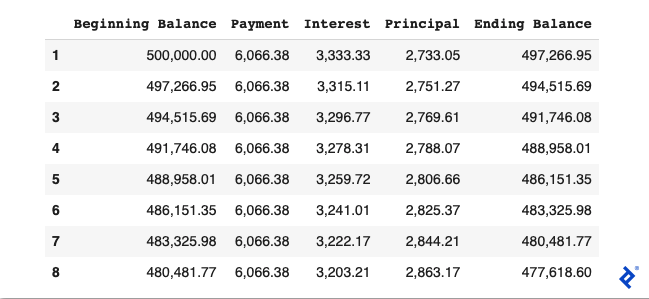
The Pandas package is the most commonly used Python package for manipulating numerical tables and time series. It provides fast, flexible, and expressive data structures designed to make working with relational or labeled data both easy and intuitive. We will create a table that includes principal and interest payments, as well as starting and ending loan balances for each period:
_# pandas float formatting_
pd.options.display.float_format = '{:,.2f}'.format

_# cash flow table_
cf_data = {'Interest': interest_payment, 'Principal': principal_payment}
cf_table = pd.DataFrame(data=cf_data, index=periods)
cf_table['Payment'] = cf_table['Interest'] + cf_table['Principal']
cf_table['Ending Balance'] = original_balance - \
                             cf_table['Principal'].cumsum()
cf_table['Beginning Balance'] = [original_balance] + \
                                list(cf_table['Ending Balance'])[:-1]
cf_table = cf_table[['Beginning Balance', 'Payment', 'Interest',
                     'Principal', 'Ending Balance']]
cf_table.head(8)
The first line of code applies display formatting rules to make the table more readable by adding thousand separators and displaying the numbers to just two decimal places.
The second chunk of code instructs Colab to include interest payment, principal payment, ending balance, and original balance for each loan period. The backslashes act as line breaks because we cannot have more than 79 characters in a single line.
If you have been following along in your own Colab notebook, congratulations! You have now coded a simple scheduled amortization loan portfolio profile using Python.
There is much more you can do with Python for finance, including modeling for loans with variable interest coupons tied to a benchmark rate and other loan structures. Hopefully this loan model has given you a taste of how simple financial coding in Python can be.
Understanding the basics
How is Python used in finance?
Python can be used to pull data from spreadsheets and databases—and then to process that data using statistical tools. You can create and analyze everything from simple loan cash flow models to algorithmic trading strategies and more.
Is Python good for financial modeling?
Python is an excellent programming language for financial modeling. In addition to a large standard library of tools, it offers easy access to finance-specific, third-party libraries such as NumPy and Pandas.
How long does it take to learn Python for finance?
Python is one of the easiest coding languages to learn because it was designed with readability and ease of use in mind. Its code is concise and close to plain English. The more you practice, the quicker you will learn Python. Some coders recommend working in Python for an hour a day as you’re learning.
Miklós Lukács
London, United Kingdom
Member since October 6, 2020
About the author
Miklos is an expert in cash flow modeling and Python programming, and has worked for Morgan Stanley and DBRS Morningstar. He is a Toptal finance expert and the director of the structured finance consulting company Pylink Ltd.
Expertise
PREVIOUSLY AT


