Proof in Numbers: Using Big Data to Drive Results
These case studies illustrate how data-driven product management can make a radical difference in how you solve large-scale product issues.
These case studies illustrate how data-driven product management can make a radical difference in how you solve large-scale product issues.
As a product manager specializing in data science, Lavinius helps clients improve product performance and scale their businesses. His portfolio includes the creation of an AI price prediction engine, which used machine learning to forecast optimal pricing for the cruise industry.
PREVIOUSLY AT

At a certain point in your career as a product manager, you might face large-scale problems that are less defined, involve broader causes and impact areas, and have more than one solution. When you find yourself working with complex data sets—when you begin to think about numbers in the millions instead of thousands—you need the right tools to enable you to scale up at the same rate.
This is where data-driven product management can yield tremendous business value. In the following examples, drawn from cases in my own career, applying data analytics to seemingly intractable problems produced solutions that brought huge returns for my employers—ranging from millions of dollars to hundreds of millions.
Acquiring data science skills can help forge the next path of growth in your product management career. You’ll solve problems faster than your colleagues, turn evidence-based insights into hard returns, and make huge contributions to your organization’s success.
Leverage Large-scale Data
Applying data science in product management and product analytics is not a new concept. What is new is the staggering amount of data for product managers to access, whether through their businesses’ platforms, data collection software, or the products themselves. And yet in 2020, Seagate Technology reported that 68% of data gathered by companies goes unleveraged. A 2014 IBM white paper compared this data waste to “a factory where large amount[s] of raw materials lie unused and strewn about at various points along the assembly line.”
Product managers with data science skills can harness this data to gain insights on key metrics such as activation, reach, retention, engagement, and monetization. These metrics can be geared toward a range of product types, like e-commerce, content, APIs, SaaS products, and mobile apps.
In short, data product management is less about what data you gather and more about how and when you use it, especially when you’re working with new and higher-order numbers.
Dig Into the Data to Find the Root Causes
Several years ago, I worked at a travel technology provider with more than 50,000 active clients in 180 countries, 3,700 employees, and $2.5 billion in annual revenue. At a corporation of this size, you’re managing large teams and massive amounts of information.
When I began working there, I was presented with the following problem: Despite having up-to-date roadmaps and full backlogs, the NPS score dropped and customer churn increased over two years. The costs associated with customer support grew significantly and the support departments were constantly firefighting; during those two years, support calls quadrupled.
In my first three months, I studied how the business worked, from supply negotiation to complaint resolution. I conducted interviews with the vice president of product and her team, connected with VPs from the sales and technology teams, and spoke extensively with the customer support department. These efforts yielded useful insights and allowed my team to develop several hypotheses—but provided no hard data to back them up or establish grounds on which to reject them. Possible explanations for customer dissatisfaction included a lack of features, like the ability to edit orders after they were placed; a need for add-on products; and insufficient technical assistance and/or product information. But even if we could decide on a single course of action, persuading the various departments to go along with it would require something firmer than a possibility.
At a smaller company, I might have started by conducting customer interviews. But with an end-user base in the hundreds of thousands, this approach was neither helpful nor feasible. While it would have given me a sea of opinions—some valid—I needed to know that the information I was working with represented a larger trend. Instead, with the support of the business intelligence team, I pulled all the data available from the call center and customer support departments.
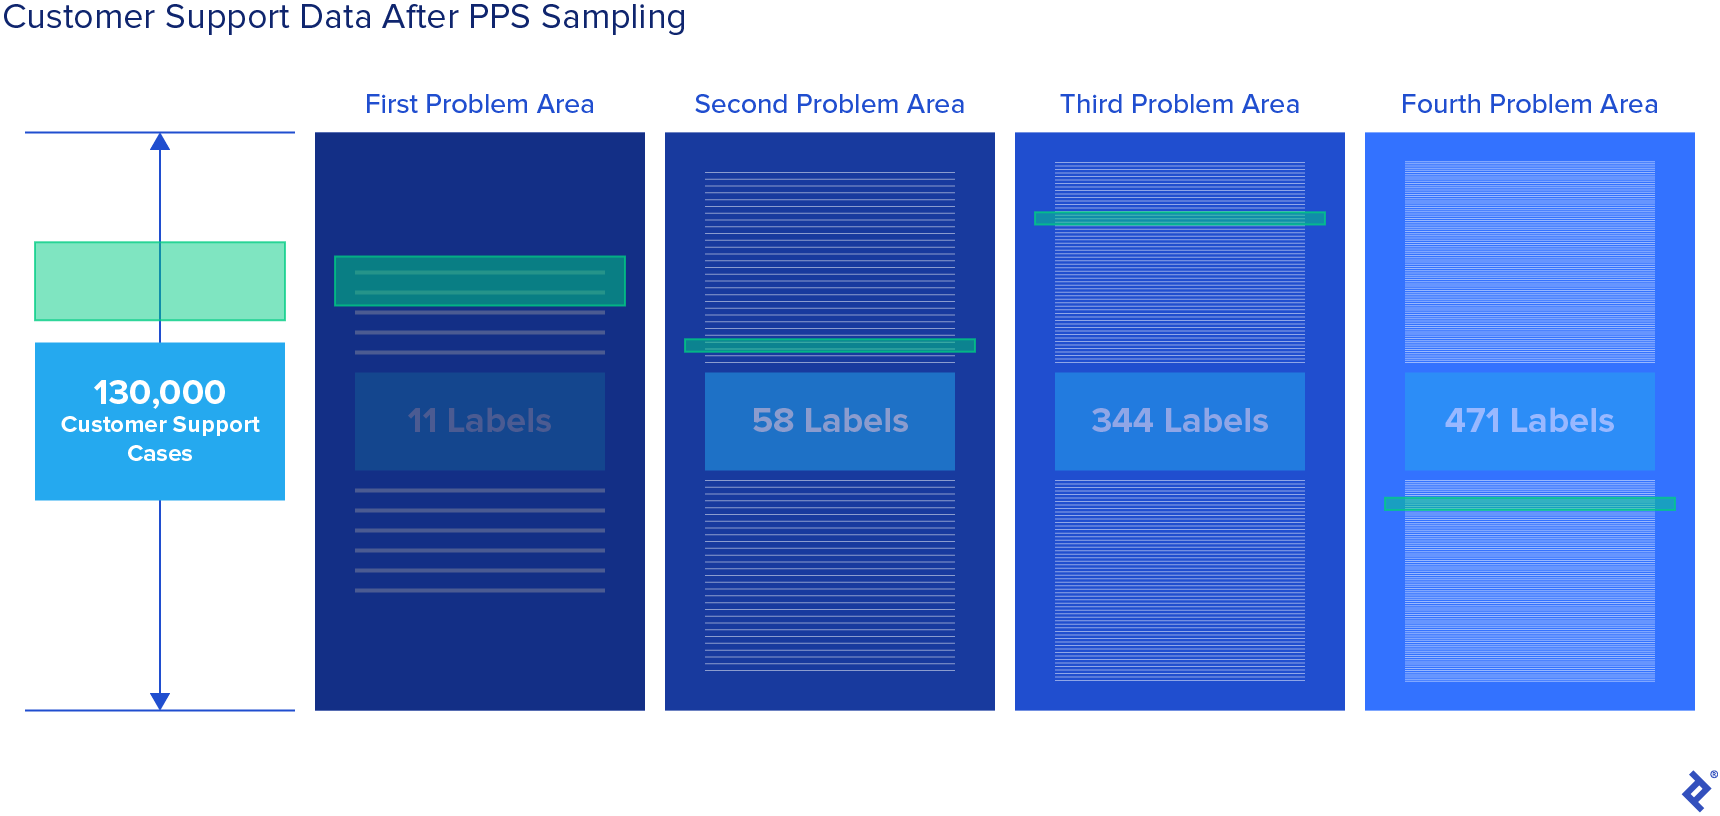
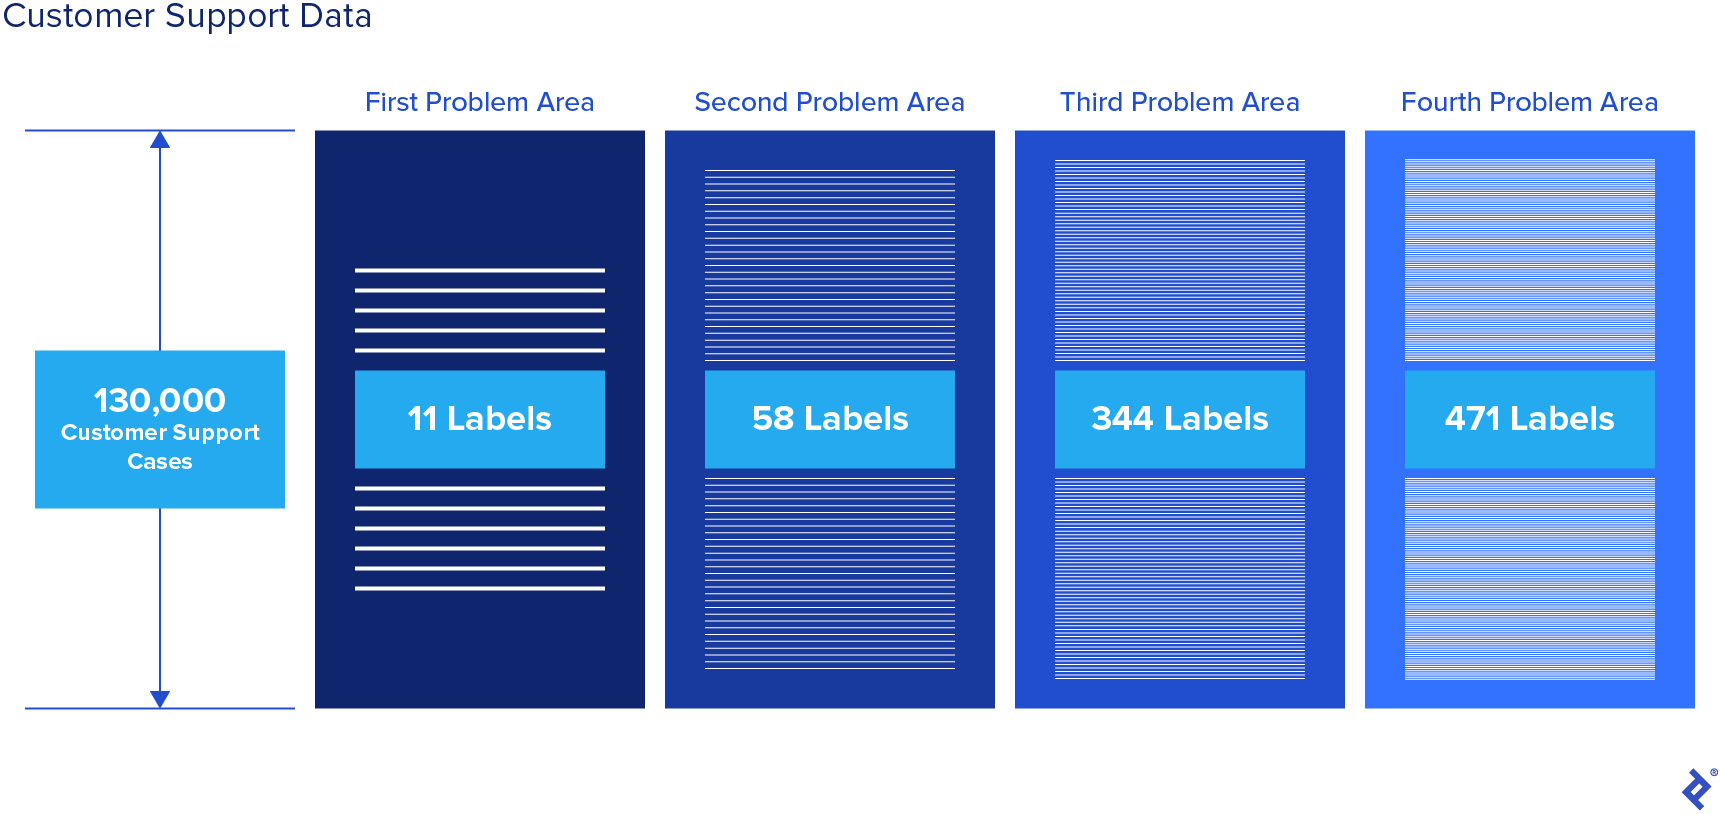
Support cases from the previous six months came to me in four columns, each with 130,000 rows. Each row represented a customer support request, and each column was labeled with the customer’s problem area as they progressed through the care process. Each column had between 11 and 471 different labels.
Applying filters and sorting the massive data set yielded no conclusive results. Individual problem labels were inadequate in capturing the bigger picture. A customer might call initially to reset their password, and while that call would be logged as such, a different root problem may become evident after all four issues were considered as a string. In 130,000 rows with millions of possible strings, looking for patterns by reviewing each row individually wasn’t an option. It became clear that identifying the issue at this scale was less about providing business insight and more comparable to solving a math problem.
In order to isolate the most frequently occurring strings, I used probability proportional to size (PPS) sampling. This method sets the selection probability for each element to be proportional to its size measure. While the math was complex, in practical terms, what we did was simple: We sampled cases based on the frequency of each label in each column. A form of multistage sampling, this method allowed us to identify strings of problems that painted a more vivid picture of why customers were calling the support center. First, our model identified the most common label from the first column, then, within that group, the most common label from the second column, and so on.

After applying PPS sampling, we isolated 2% of the root causes, which accounted for roughly 25% of the total cases. This allowed us to apply a cumulative probability algorithm, which revealed that more than 50% of the cases stemmed from 10% of the root causes.
This conclusion confirmed one of our hypotheses: Customers were contacting the call center because they did not have a way to change order data once an order had been placed. By fixing a single issue, the client could save $7 million in support costs and recover $200 million in revenue attributed to customer churn.
Perform Analysis in Real Time
Knowledge of machine learning was particularly useful in solving a data analysis challenge at another travel company of similar size. The company served as a liaison between hotels and travel agencies around the world via a website and APIs. Due to the proliferation of metasearch engines, such as Trivago, Kayak, and Skyscanner, the API traffic grew by three orders of magnitude. Before the metasearch proliferation, the look-to-book ratio (total API searches to total API bookings) was 30:1; after the metasearches began, some clients would reach a ratio of 30,000:1. During peak hours, the company had to accommodate up to 15,000 API requests per second without sacrificing processing speed. The server costs associated with the API grew accordingly. But the increased traffic from these services did not result in a rise in sales; revenues remained constant, creating a massive financial loss for the company.
The company needed a plan to reduce the server costs caused by the traffic surge, while maintaining the customer experience. When the company attempted to block traffic for select customers in the past, the result was negative PR. Blocking these engines was therefore not an option. My team turned to data to find a solution.
We analyzed approximately 300 million API requests across a series of parameters: time of the request, destination, check-in/out dates, hotel list, number of guests, and room type. From the data, we determined that certain patterns were associated with metasearch traffic surges: time of day, number of requests per time unit, alphabetic searches in destinations, ordered lists for hotels, specific search window (check-in/out dates), and guest configuration.
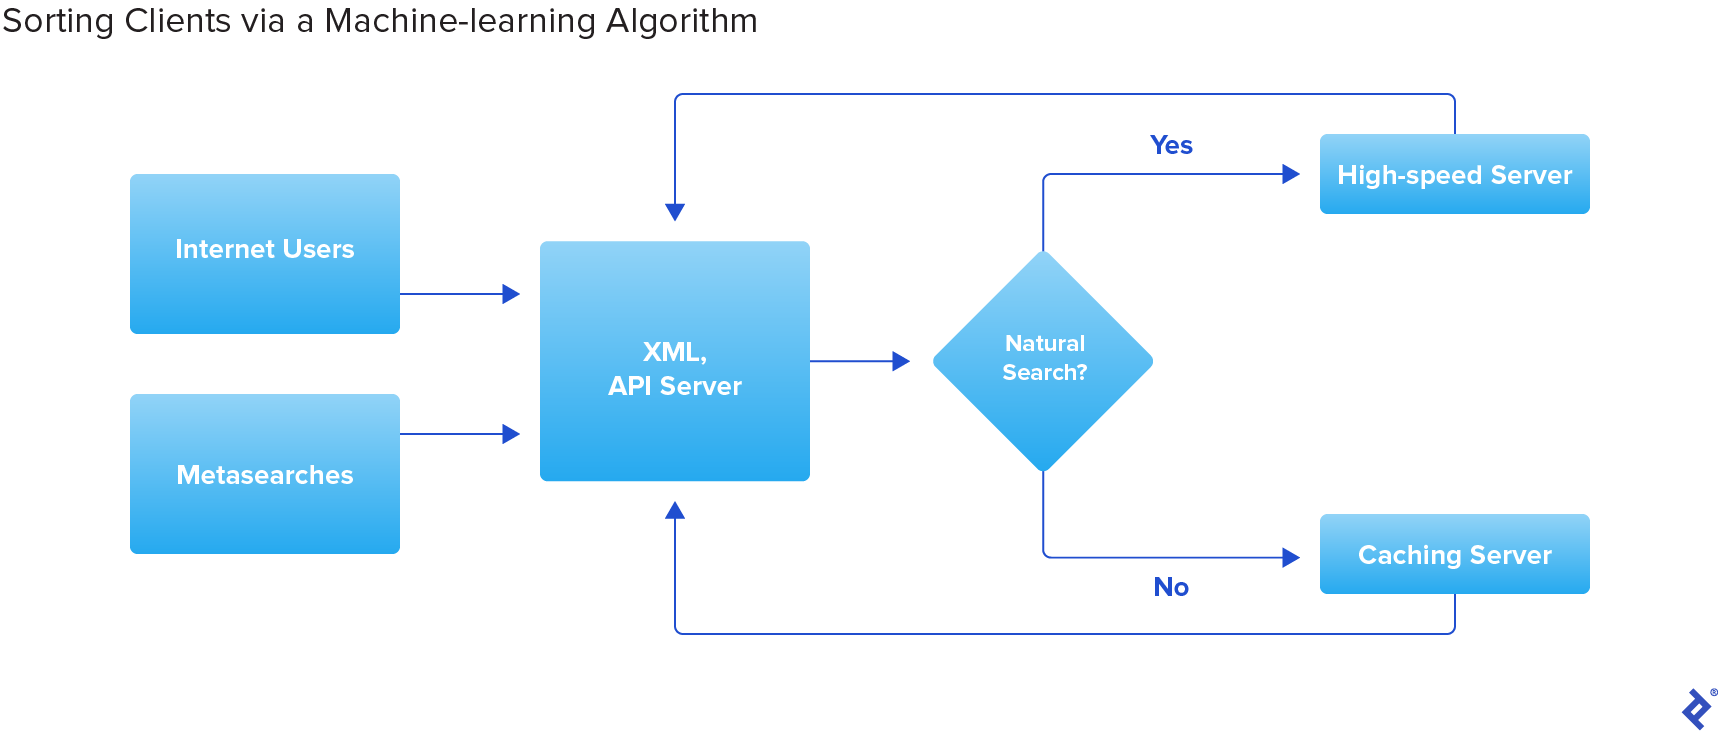
We applied a supervised machine learning approach and created an algorithm that is similar to logistic regression: It calculated a probability for each request based on the tags sent by the client, including delta-time stamp, time stamp, destination, hotel(s), check-in/out dates, and number of guests, as well as the tags of previous requests. Depending on the given parameters, the algorithm would identify the probability that an API server request was generated by a human or by a metasearch engine. The algorithm would run in real time as a client accessed the API. If it determined a high-enough likelihood that the request was human-driven, the request would be sent to the high-speed server. If it appeared to be a metasearch, the request would be diverted to a caching server that was less expensive to operate. The use of supervised learning allowed us to teach the model, leading to greater accuracy over the course of development.
This model provided flexibility because the probability could be adapted per client based on more specific business rules than those we had used previously (e.g., expected bookings per day or client tier). For a specific client, the requests could be directed at any point above 50% probability, while for more valuable clients, we could require more certainty, directing them when they passed a threshold of 70% probability.

After implementing the classification algorithm, the company diverted up to 70% of the requests within a given time frame to the cheaper stack and saved an estimated $5 million to $7 million per year in infrastructure costs. At the same time, the company satisfied the client base by not rejecting traffic. It preserved the booking ratio while safeguarding revenue.
Use the Right Tools for the Job
These case studies demonstrate the value of using data analytics for product managers to solve complex product problems. But where should your data science journey begin? Chances are, you already have a basic understanding of the broad knowledge areas. Data science is an interdisciplinary activity; it encompasses deeply technical and conceptual thinking. It’s the marriage of big numbers and big ideas. To get started, you’ll need to advance your skills in:
Programming. Structured query language, or SQL, is the standard programming language for managing databases. Python is the standard language for statistical analysis. While the two have overlapping functions, in a very basic sense, SQL is used to retrieve and format data, whereas Python is used to run the analyses to find out what the data can tell you. Excel, while not as powerful as SQL and Python, can help you achieve many of the same goals; you will likely be called on to use it often.
Operations research. Once you have your results, then what? All the information in the world is of no use if you don’t know what to do with it. Operations research is a field of mathematics devoted to applying analytical methods to business strategy. Knowing how to use operations research will help you make sound business decisions backed by data.
Machine learning. With AI on the rise, advances in machine learning have created new possibilities for predictive analytics. Business usage of predictive analytics rose from 23% in 2018 to 59% in 2020, and the market is expected to experience 24.5% compound annual growth through 2026. Now is the time for product managers to learn what’s possible with the technology.
Data visualization. It’s not enough to understand your analyses; you need tools like Tableau, Microsoft Power BI, and Qlik Sense to convey the results in a format that is easy for non-technical stakeholders to understand.
It’s preferable to acquire these skills yourself, but at a minimum you should have the familiarity needed to hire experts and delegate tasks. A good product manager should know the types of analyses that are possible and the questions they can help answer. They should have an understanding of how to communicate questions to data scientists and how analyses are performed, and be able to transform the results into business solutions.
Wield the Power to Drive Returns
NewVantage Partners’ 2022 Data and AI Leadership Executive Survey reveals that more than 90% of participating organizations are investing in AI and data initiatives. The revenue generated from big data and business analytics has more than doubled since 2015. Data analysis, once a specialty skill, is now essential for providing the right answers for companies everywhere.
A product manager is hired to drive returns, determine strategy, and elicit the best work from colleagues. Authenticity, empathy, and other soft skills are useful in this regard, but they’re only half of the equation. Data-driven product development will help you be a leader within your organization, bringing facts to the table, not opinions. The tools to develop evidence-based insights have never been more powerful, and the potential returns have never been greater.
Further Reading on the Toptal Blog:
Understanding the basics
What is data science in simple terms?
Data science is an interdisciplinary set of tools and techniques devoted to finding patterns in large amounts of data.
How do product managers work with data science?
The techniques and methodologies of data science, and the information that product managers extract from data, can be used to generate business insights. Working on their own or alongside data scientists in their organization, a product manager can use data science to make evidence-based business decisions.
Is data science useful for product managers?
As illustrated by the case studies in this article, applying data science to product management can save an organization millions of dollars. A product manager with a firm grasp of data science will identify issues more efficiently, solve problems faster, and make themselves an invaluable asset to a company.
Lavinius Marcu
London, United Kingdom
Member since January 14, 2021
About the author
As a product manager specializing in data science, Lavinius helps clients improve product performance and scale their businesses. His portfolio includes the creation of an AI price prediction engine, which used machine learning to forecast optimal pricing for the cruise industry.
PREVIOUSLY AT


