Financial Clarity at Last: How to Reboot Your Chart of Accounts Structure in 7 Steps
It is quite common for financial reports to fall short of executives’ expectations. Accounting teams tend to focus on doing things the “right way” rather than asking readers of the financial statements what they want to see.
In this article, Toptal Finance Expert Scott Hoover demonstrates how to set up a chart of accounts and raise your organization’s financial reporting to the next level.
Scott is a CPA with three focus areas: high-level monthly financial oversight, accounting software projects, and corporate tax planning.
Expertise
PREVIOUSLY AT

Executive Summary
Financial reporting is often less than useful for managers. A chart of accounts reboot can fix that.
- Accounting teams tend to focus on doing things the "right way" rather than asking the readers of the financial statements what they want to see.
- Not enough thought has gone into developing the chart of accounts, which is the foundation of financial reporting.
- A properly executed reboot of the chart of accounts will fix both problems. Thankfully even a full-scale reboot does not require an astronomical amount of time or energy.
What is a chart of accounts and why is it important?
- The chart of accounts is like the framework of shelves and storage bins in a warehouse. Accounts are the specific "bins" that hold accounting transactions. The chart of accounts is simply the organized list of all the bins and shelves.
- Month end financial statements (balance sheet and income statement) simply summarize and group the balances that are in the individual accounts at month end.
- Accordingly, financial statements can be no more detailed or informative than the underlying chart of accounts structure.
Seven steps to building the perfect chart of accounts
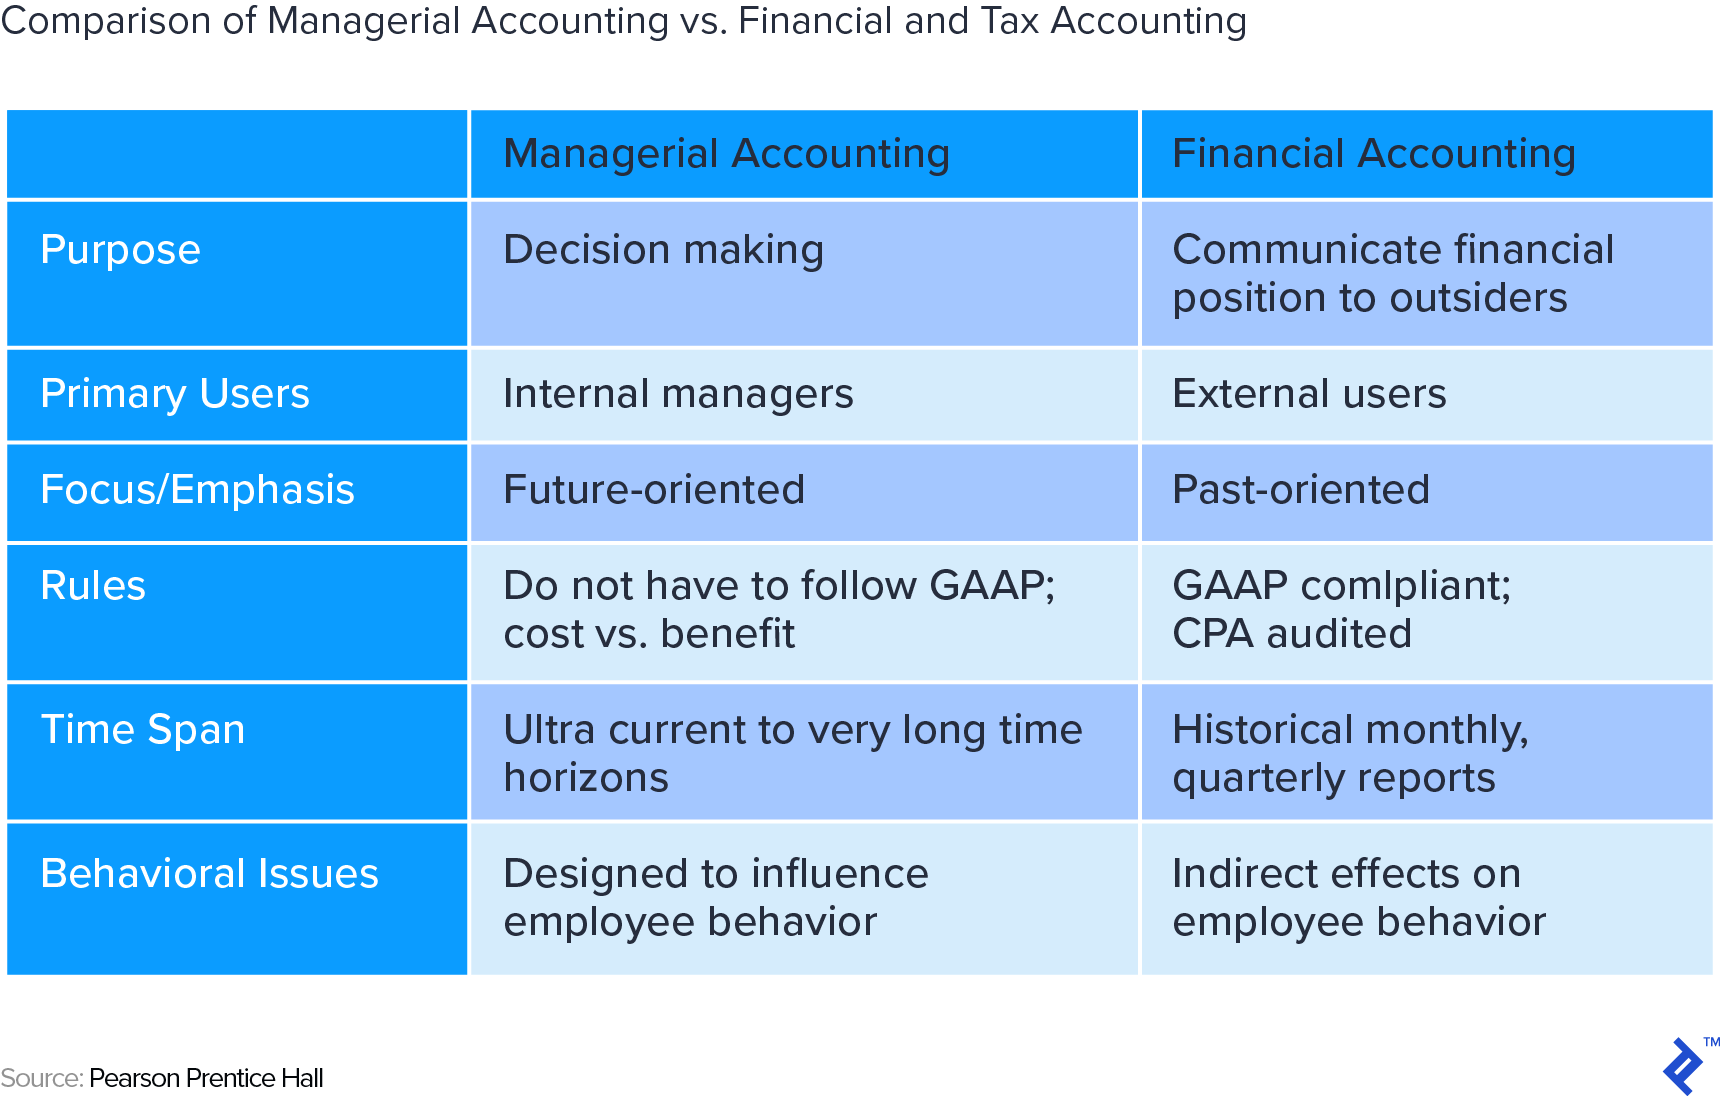
- Build the accounts for management, not for GAAP and tax purposes.
- Define gross margin correctly.
- Give careful thought to indirect costs.
- Organize operating expenses to reflect owner preferences and match budgeting level of detail.
- Use accounts numbers, if you aren't already.
- Consider separate accounts for key month end entries.
- Maximize the functionality of your accounting software.
“The labor in cost of goods sold looks crazy. I know we didn’t pay that much in shop labor this month. Can you show me a breakdown of what goes into that number?”
“We’ve got more subscriptions than we can count right now—Slack, Office 365, Xero, Bill.com, Calendly, Zoho CRM, Trello—and we’re signing up for new ones every month! Can you show me our total monthly spend on these?”
“I just want to see an income statement that matches our budget. Take travel. In our budget, it’s broken out by lodging, airfare, ground transportation, etc. When I look at the income statement, all I see is one number—travel, and it shows we’re over budget. I want to see the detail, so I know why.”
“All this detail is great, but what I really want is a one-page report that shows our sales, gross margin, and maybe 10 categories of overhead expenses (accounting department, sales department, etc.) all in a nice neat summary.”
These are familiar sentiments to anyone who has sat through a few financial meetings. The discussion flows and inevitably someone says “It would be nice if we could see…” The CFO gets an exasperated expression on their face and writes the request on their notepad. “I’ll see what I can do,” they say dryly.
Truth is, they probably aren’t sure where to even begin.
It is quite common for financial reports to fall short of executive expectations. I suggest two reasons for this:
- Accounting teams tend to focus on doing things the “right way” rather than asking the readers of the financial statements what they want to see. That is the equivalent of building a house for someone without asking how they want it built.
- Not enough thought has gone into developing the chart of accounts, which is the foundation of financial reporting. That is equivalent to building a house on dirt instead of concrete.
A properly executed reboot of the chart of accounts will fix both problems. Thankfully, even a full-scale reboot does not require an astronomical amount of time or energy. In fact, I suggest that it is the single best and most effective way to raise the financial reporting at your organization to the next level.
What Is a Chart of Accounts and Why Is It Important?
Recently, I was helping a technology company owner improve his financial reporting. “Open up your chart of accounts,” I told him.
“I don’t think I’ve ever looked at that,” he told me as we looked over his accounts. I could see the light bulbs going on as I showed him how his sales invoice lines were all configured to flow to a single sales account in his chart of accounts. With such a simplistic accounting structure, his financials were unable to provide detail about his five distinct revenue streams.
The chart of accounts is like the framework of shelves and storage bins in a warehouse. Think of a computer hardware company that receives a constant stream of desktops, laptops, and printers. If their warehouse is well-organized, an arriving shipment of Dell laptops will be routed to a specific bin in the Dell section of the laptop area of the warehouse. That way, when a customer orders a Dell laptop, the warehouse workers can quickly and easily retrieve it.
If the warehouse had no bins or racking but was simply three huge rooms—one each for desktops, laptops and printers—tracking or retrieving anything would be a nightmare.
Accounts are the specific “bins” that hold accounting transactions. The chart of accounts is simply the organized list of all the bins and shelves. To illustrate, when the computer company records the sale of the Dell laptop in the above example, the accountant will go to the Revenue section of the chart of accounts and put the sale amount in the account Sales-Laptops, or perhaps Sales-Laptops-Dell Laptops if the company’s chart of accounts is more detailed.
Month-end financial statements (balance sheet and income statement) simply summarize and group the balances that are in the individual accounts at month end. Accordingly, financial statements can be no more detailed or informative than the underlying chart of accounts structure.
My technology client had one big “room” for all Sales, with no bins and shelves. His month-end income statement could get no more detailed than that one account. At a glance, he had no idea which revenue streams were contributing to that bulk monthly number.
It is hard for me to be critical because 90% of business owners can probably relate to never having looked at their chart of accounts. Even many controllers and CFOs are weak on implementing chart of accounts best practices and structure one that easily and plainly produces the financial information management wants to see.
Accounting software companies are partly to blame for this. They know (especially the entry-level providers) most people would struggle to set up a quality chart of accounts. To fix that, they automate the setup part and build a pre-fabricated chart of accounts into the software.
Unfortunately, using a pre-fabricated chart of accounts is like trying to build a dream house on a one-size-fits-all concrete foundation. The house would end up very different from the dream, and not be very functional.
The Best Chart of Accounts Structure
There are three aspects to consider when rebooting a chart of accounts:
- The number of “bins,” or accounts.
- The definition of what goes into each bin.
- The way the bins are organized.
Follow these seven steps to address these points, turbocharge your chart of accounts, and provide the financial visibility your company needs.
1. Fire GAAP and tax.
Most small businesses initially set up their accounting to suit their tax accountant. As the company grows, GAAP-based financials are needed for the banks, investors, and agencies like bonding companies. Often, GAAP-based financials are the end of the progression.
But there is another level. That level is managerial accounting, and it’s where you create financial reports with the information you want to see. Tax and audit CPAs adjust your reports to fit their purposes anyway, so go ahead and make a complete break. The new goal is financial reports that provide the metrics you need to run your operation throughout the year.
Some accountants recommend sticking with a GAAP-oriented chart of accounts and generating management-oriented financials through custom reports. These custom reports cobble together numbers from various sections of the chart of accounts to get the financial statement layout management is looking for.
That approach can work as long as you have custom reporting capability. In the absence of that, tax and audit CPAs have the custom reporting software to easily convert your management-oriented chart of accounts into their format. Just be sure to make it easy for them by incorporating any special accounts they need into your remodeled chart accounts.

2. Define gross margin.
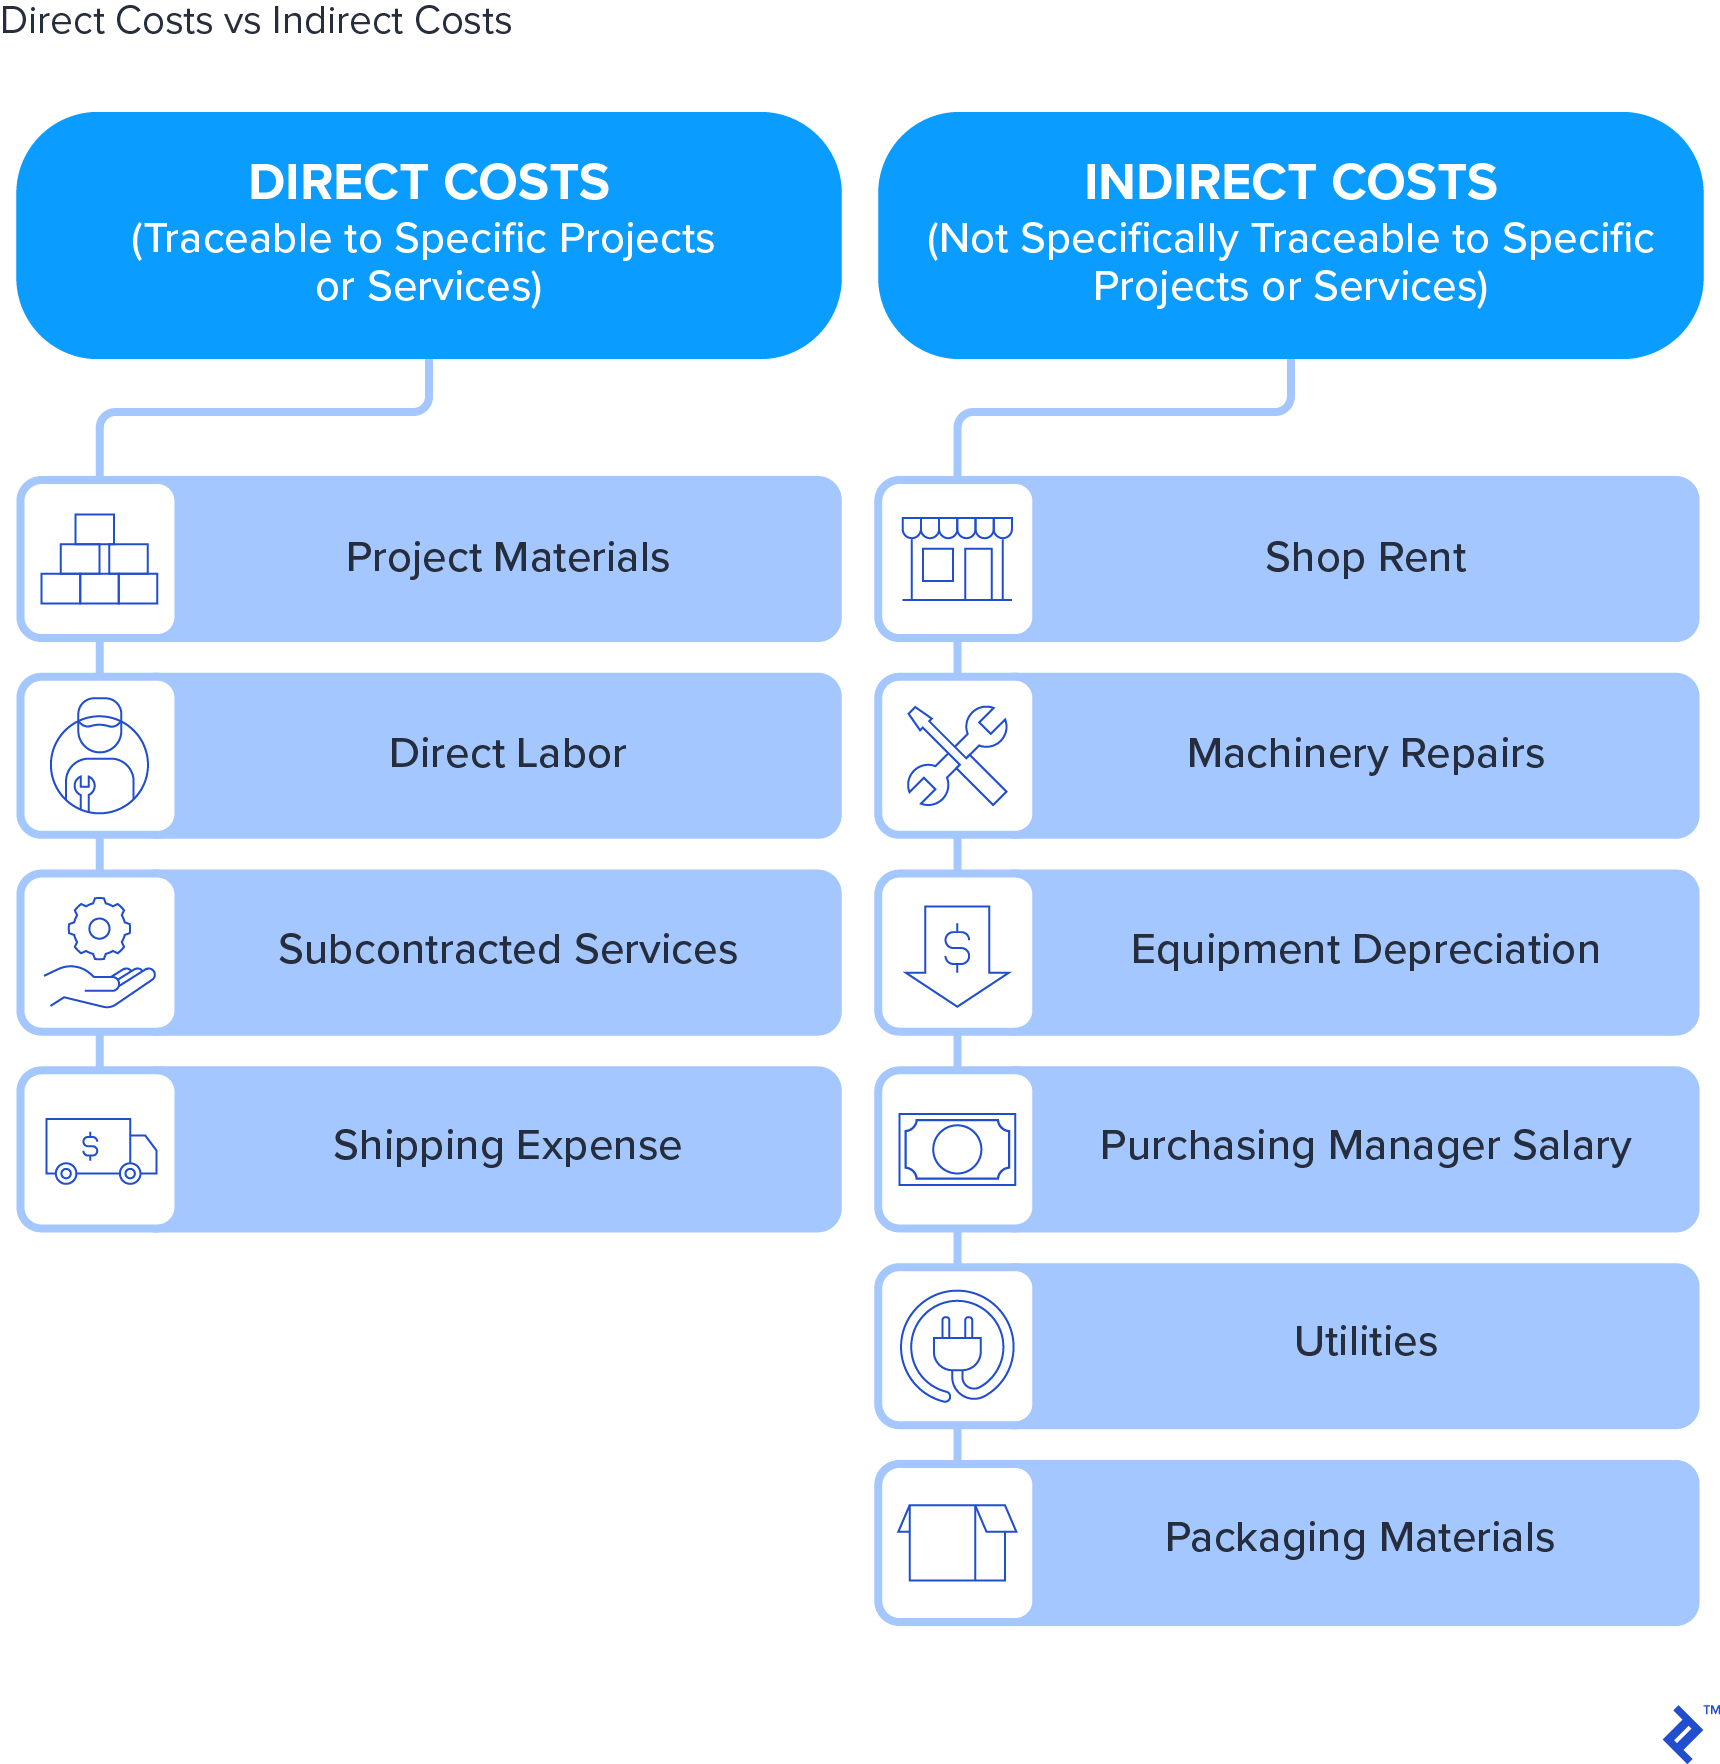
Gross margin is the profit after subtracting direct costs from sales. What are “direct costs”? That is the big question. Everyone agrees that direct labor and direct materials are always direct costs. Beyond that, the definition is discretionary.
For example, under GAAP, a fixed cost like equipment depreciation would be a direct cost for a manufacturer. However, in a managerial-focused environment, fixed costs are often kept out of gross margin, to keep it from being distorted by swings in sales.
For example, if depreciation is $50 per month and sales are $500 per month, depreciation is 10% of sales. If sales spike to $1,000 one month, depreciation is still $50 and is now only 5% of sales. In that situation, sales—not production efficiency or better estimating—has changed gross margin. That can be misleading, especially if production supervisors are compensated on margin metrics.
Here is a suggestion: Direct costs on your managerial financial statements should be the same as the costs you factor into quoting or pricing calculations. If you only consider direct labor and direct materials when bidding a job or setting prices, then those should be the only direct costs shown on your monthly financials. That way you can see at a glance if you are achieving the gross margin you target in quoting.
Alternatively, if you include indirect items like depreciation and supplies in your quoting, then you should include them in the gross margin calculation on your financial reports. To do this, take a close look at point 3 below.
Not every company utilizes gross margin. In certain industries such as advertising, farming, or consulting, most of the costs run together under the broad category of operating expenses. In that environment, it may not be necessary to separate costs between direct/indirect and operating, and there will be no gross margin on the financials.
3. Give careful thought to indirect costs.
Indirect costs are overhead expenses that relate directly to sales yet cannot be traced directly to a specific product or job. Examples include factory supervisor wages, incidental supplies (e.g., tape, glue, screws), machinery repairs, shop building insurance, etc. Expenses such as tax preparation fees, marketing, and legal expenses would not be considered indirect costs, but rather operating or general/admin expenses.
Most companies choose a metric such as labor hours and estimate a rate per labor hour that “uses up” these indirect costs over the course of a month or year. For example, consider a simple manufacturer who last month had $1,000 of manufacturing supplies and $1,000 of shop repairs, for a total of $2,000 of indirect expenses. Production workers worked 200 hours during that month. Based on that, the company decides to allocate indirect cost to future projects at a rate of $10 per hour ($2,000 total costs/200 shop labor hours).
As each hour of labor cost is posted to the system, the estimated indirect cost of $10 per hour is also automatically posted. If the workers work 300 hours, $3,000 (300 x $10 per hour) of indirect expense will post to the project module and the financial statements.
The concept makes sense, but it gets confusing when this entry hits the financials. Unlike true wage expense, the $3,000 is a project costing entry that is not paid out in cash. Accordingly, the offset will not be cash, but rather a -$3,000 entry to an Indirect Expenses-Applied account.
In a well-designed chart of accounts, that offset account is typically grouped with the accounts that receive the actual supplies and repairs expense. That way if actual supplies and repairs total $2,700 for the month, you can see at a glance that indirect cost was overapplied to projects ($3,000 applied, compared to $2,700 actual).
This point is not meant to be a discourse on project costing, but to create awareness that the chart of accounts must thoughtfully accommodate the organization’s approach to indirect costs. It can be one of the most confusing items on financial reports, especially if the approach is not well-organized and simple.
Indirect costing applies to project-oriented companies, particularly manufacturers and construction contractors. Companies that are not project-oriented, such as retailers and restaurants, typically would not incorporate indirect costing into their accounting structure.

4. Organize operating expenses to reflect owner preferences and match budgeting level of detail.
There are many ways to slice data. For example, Meals Expense might be a standalone account or it might be spread across the categories the meals relate to, such as Marketing, Conferences, or Travel.
There isn’t one right way, but the chart of accounts must reflect what the end users of the financials want to see. It is important to find out from the management team how they want to treat expenses like meals or technology subscriptions. Do they want them embedded in the category they relate to (e.g., marketing or finance) or do they want to see them stand alone?
As an aside, for companies subject to US tax regulations, Meals is an example where you’ll want an easy way to give your tax accountant a stand-alone total amount at year-end. If you choose to spread Meals across relevant categories, you’ll want to still keep them in discrete accounts within each category.
In the end, the chart of accounts, the budget, and management preferences all must align in an effective accounting system.
5. Use account numbers, if you aren’t already.
Account numbers are like the bin numbers in a warehouse. Five-digit base account numbers work well (four for a very simple setup). Chart of accounts numbering best practice is to use the 10000s for asset accounts, 20000s for liabilities, 29000s for equity, 30000s for sales, 40000s-50000s for direct/indirect costs, 60000-70000s for operating/overhead expenses, and 80000-90000s for non-operations accounts such as interest and taxes.
Thoughtfully spread out your account numbers to leave room for growth. For example, if the main Business Checking account is 10000, the Payroll Checking account might be 10100. After that, you might skip to 11000 for Accounts Receivable (commonly the next asset category). That leaves 10200, 10300, etc. for future cash and checking accounts, and leaves the entire 11000 group for other receivable accounts (e.g., employee or intercompany receivables).
For income and expense accounts, parent-child arrangements are recommended to facilitate simultaneous summary and detail reporting. For example, imagine a technology company with three revenue streams. The parent-level account for Sales would be 30000 Sales. No transactions would post to that account. Under it could be the child accounts: 31000 Sales-Web Design, 32000 Sales-Server Management, and 33000 Sales-Hardware.
Avoid more than 2 or 3 levels of child accounts. For example, 33000 Sales-Hardware could be further broken out to 33100 Sales-Hardware-Computers and 33200 Sales-Hardware-Printers. Hardware-Printers could be further broken out in 33210 Hardware-Printers-HP and 33220 Hardware-Printers-Canon. At that point, further detail may be more harm than help and lead to inaccurate accounting. It is generally better to have less detail and keep it accurate than to have inordinate amounts of detail that tend to be inaccurate.
For organizational elegance, keep numbers and descriptions consistent. Align direct cost account numbers with the corresponding sales account numbers. For example, to track the cost of hardware purchased for resale, you might use account number 43000 COS-Hardware, which would align numerically with 33000 Sales-Hardware (child accounts would also align). The consistency comes in handy when designing financial reports or making journal entries, and also makes sense to non-accountants.
On a related note, some experts (particularly software implementers and IT professionals) recommend having only a few accounts in the chart of accounts and instead using the detailed reports in the various modules in your accounting software.
For example, you might put all customer invoices in one Sales account. There would be no detail on your financial statements. You would get the detail by going to the Sales module and running invoice reports such as Sales by Sales Category or Sales by Customer. On some level, this is done anyway. The Payroll module is another one that often has extensive built-in reporting capability that goes beyond anything the chart of accounts would provide. The Projects module is another one. So why not skip all detail in the chart of accounts and go that route?
While it sounds great in theory, in practice financial statements are what get faithfully generated and reviewed by management each month. Detailed reporting from the various modules often requires some effort to make sure it ties to the financials, and because of that (and other reasons), it doesn’t consistently get done. Building some level of detail into the chart of accounts is a practical way to ensure key information is always in the face of the management team.
6. Consider separate accounts for key month-end entries.
Good month-end financial reports are made accurate with large non-cash journal entries. For example, if wages earned from October 18-31 are paid on November 7, a journal entry must be posted to move that November 7 cash expense to October 31, to make October financials accurate.
If the amount of the journal entry is mixed in with the regular wage expense accounts, it can be difficult to see how much of the wage expense relates to cash payments and how much is accrued. The same is true for complex journal entries that adjust work in progress (WIP) values, or over/under billings entries at companies that work with multi-month projects.
It can be helpful to funnel these entries to separate accounts. For example, you might have a parent account 45000 Direct Labor and three child accounts: 45100 Production Labor, 45200 Change in Accrued Labor, and 45300 Change in WIP Labor. The granularity makes it easy to explain the total rolled-up labor amount to the executive team, who tend to think only in terms of wages paid in cash that month.
7. Maximize the functionality of your accounting software.
One of the advantages of a powerful chart of accounts is that it can prolong the useful life of even entry-level accounting software. Often frustration with financial reporting can be fixed by remodeling the chart of accounts, rather than going through the very painful process of migrating to new software.
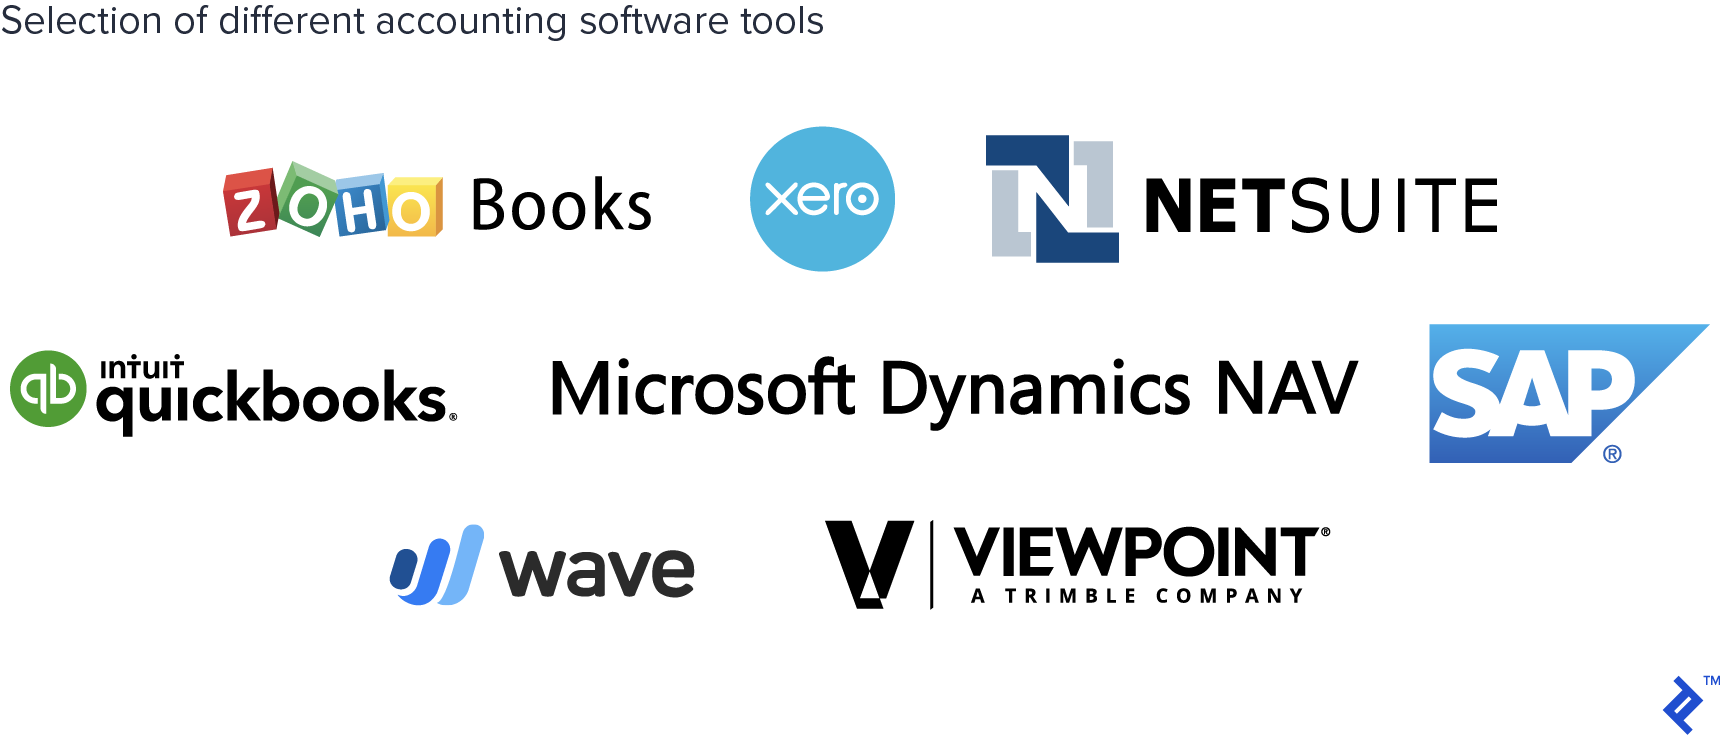
A key step then is to structure the chart of accounts to maximize the ability of the software. A platform like Microsoft Dynamics NAV utilizes only base account numbers plus tags (“dimensions”) to code each expense to a specific location or division. A platform like Vista by Viewpoint utilizes account segments. Account 40000.01.02 might be Direct Materials (40000) for the Concrete Division (02) at the Boston location (01). QuickBooks and Xero do it yet another way. Be willing to modify your account structure to work with the software, not the other way around.
Since financial reporting and the chart of accounts are so inextricably linked, it is also important to consider the financial reporting capability of the software when revamping or setting up the chart of accounts. For example, if the software does not allow you to rearrange the order of the accounts on the financial statements, it becomes very critical how your order your chart of accounts.
Chart of accounts functionality is probably the most important attribute of accounting software and financial reporting. Entry level software with robust COA functionality can be made to work for many years. The reverse is also true.
I recently consulted with a $10 million custom manufacturing/retail company on the brink of splitting their accounting records (the records, not the company itself) into two separate “companies” to be able to get the reporting clarity they desperately desired. By making strategic tweaks to their chart of accounts and better utilizing their software’s reporting capabilities, we were able to get the financial visibility they needed without having them embark on what would likely have been a high-cost disaster.

A Good Chart of Accounts Is Foundational
An effective chart of accounts structure directly or indirectly drives virtually all financial reporting. Yet, many organizations ignore this foundational concept and limp along with unmet expectations.
Unlike some foundational problems, a chart of accounts can be optimized relatively quickly. A well-executed remodel can generally be implemented within a month and have a noticeable effect on financial reporting immediately.
Because most companies (and CFOs) only set up a chart of accounts maybe once per decade, it can be an ideal project to outsource. Contact Toptal if you would like assistance taking this simple but incredibly impactful step raising your organization to the next level.
Further Reading on the Toptal Blog:
Understanding the basics
What are the five types of accounts?
The three balance sheet account types: assets, liabilities, and equity—and the two income statement account types: income and expense.
Is the general ledger the same as the chart of accounts?
No. The chart of accounts is the list of accounts transactions go into. The general ledger is the record of all the transactions that went into each account on the list.
Why is a chart of accounts important?
The chart of accounts structure determines the level of detail available for financial reporting. The chart of accounts is therefore the foundation of the financial statements.
What is the purpose of a chart of accounts?
The chart of accounts is an organized list of accounts or “buckets” in which to record accounting transactions. Without a chart of accounts, it would be impossible to see at a glance what accounts are available to record a transaction into.
Scott Hoover
Stratford, WI, United States
Member since October 31, 2018
About the author
Scott is a CPA with three focus areas: high-level monthly financial oversight, accounting software projects, and corporate tax planning.
Expertise
PREVIOUSLY AT


