
The Metrics Investors Want: Quantitative Forecasting for Early-stage Startups
It’s a catch-22 for young startups: How do you attract investors with compelling financial projections if you don’t have historical data? Here’s a three-part strategy for making the most of what you’ve got to seal the deal.

It’s a catch-22 for young startups: How do you attract investors with compelling financial projections if you don’t have historical data? Here’s a three-part strategy for making the most of what you’ve got to seal the deal.

Sean Heberling
Sean is a General Partner at Addvia Ventures, which invests in early-stage high-growth companies addressing large end markets. He’s also founder and CEO at Marion Street Capital, a firm that helps companies refine forecasts and grow revenue. Previously, he worked at Morgan Stanley and BNY Mellon, and during his career he has facilitated investment transactions exceeding $1 billion.
Previously At

Early-stage startups are facing a funding quandary that has intensified since the market for raising venture capital significantly tightened in 2022. To appeal to potential investors, particularly recession-conscious ones, founders need to demonstrate compelling evidence of a good payoff. One way to do that is through quantitative forecasting—but with little to no financial history, the metrics available to underpin such a forecast are scant.
The good news is that there are tactics to overcome this challenge and build a compelling case. If implemented correctly, these steps can not only deliver persuasive, data-supported financial projections, but also lay the foundation for a data strategy to help founders scale operations.
Since moving into consulting from financial services in 2018, I’ve advised dozens of startups on business development and fundraising efforts. While venture capitalists love big, bold business ideas and have recently emphasized metrics like cash burn rates and paths to profitability, strong annual revenue forecasts remain paramount.
Begin With a Data Strategy
Even at a startup’s earliest stages, investors draw a line from topline revenue forecasts to the potential value of the company. For your company to be worth $1 billion, you must be able to show you can generate about $100 million annually within the next five to seven years. There are different ways to achieve this, but in general, the higher the revenue growth rate, the greater the potential valuation and the more interest there is likely to be from investors.
Firms need to be agile to grow quickly and achieve the annual recurring revenue they need. To do this, they must be data literate, meaning they have to make operational data accessible and easy to interpret. You should use metrics to establish benchmarks to guide your operations and then include these metrics in your business plans, financial models, and pitch decks as you move through the various stages of fundraising.
Still, I realize that no company has unlimited resources to research and produce these statistics, so every startup needs to lay the groundwork for a streamlined data collection and analysis function centered on the metrics it needs most. This is why I advise clients to start with three crucial building blocks:
- Market research
- Pricing
- The sales pipeline
Focusing your effort on these three pillars will help you develop the quantitative metrics you need to persuade investors to bite, as well as build the necessary foundation you’ll require to scale.
Market Research: Study Your Customers and Industry
The first pillar you’ll need to set up to maximize revenue and lay the foundation for a versatile data strategy is market research. Obtaining a deep understanding of target markets helps founders establish a fact-based framework for projecting sales and profitability through valuable comparison data. The intelligence you collect will help define the broadest market to target, as well as help you develop the groundwork for pricing and other key financial indicators.
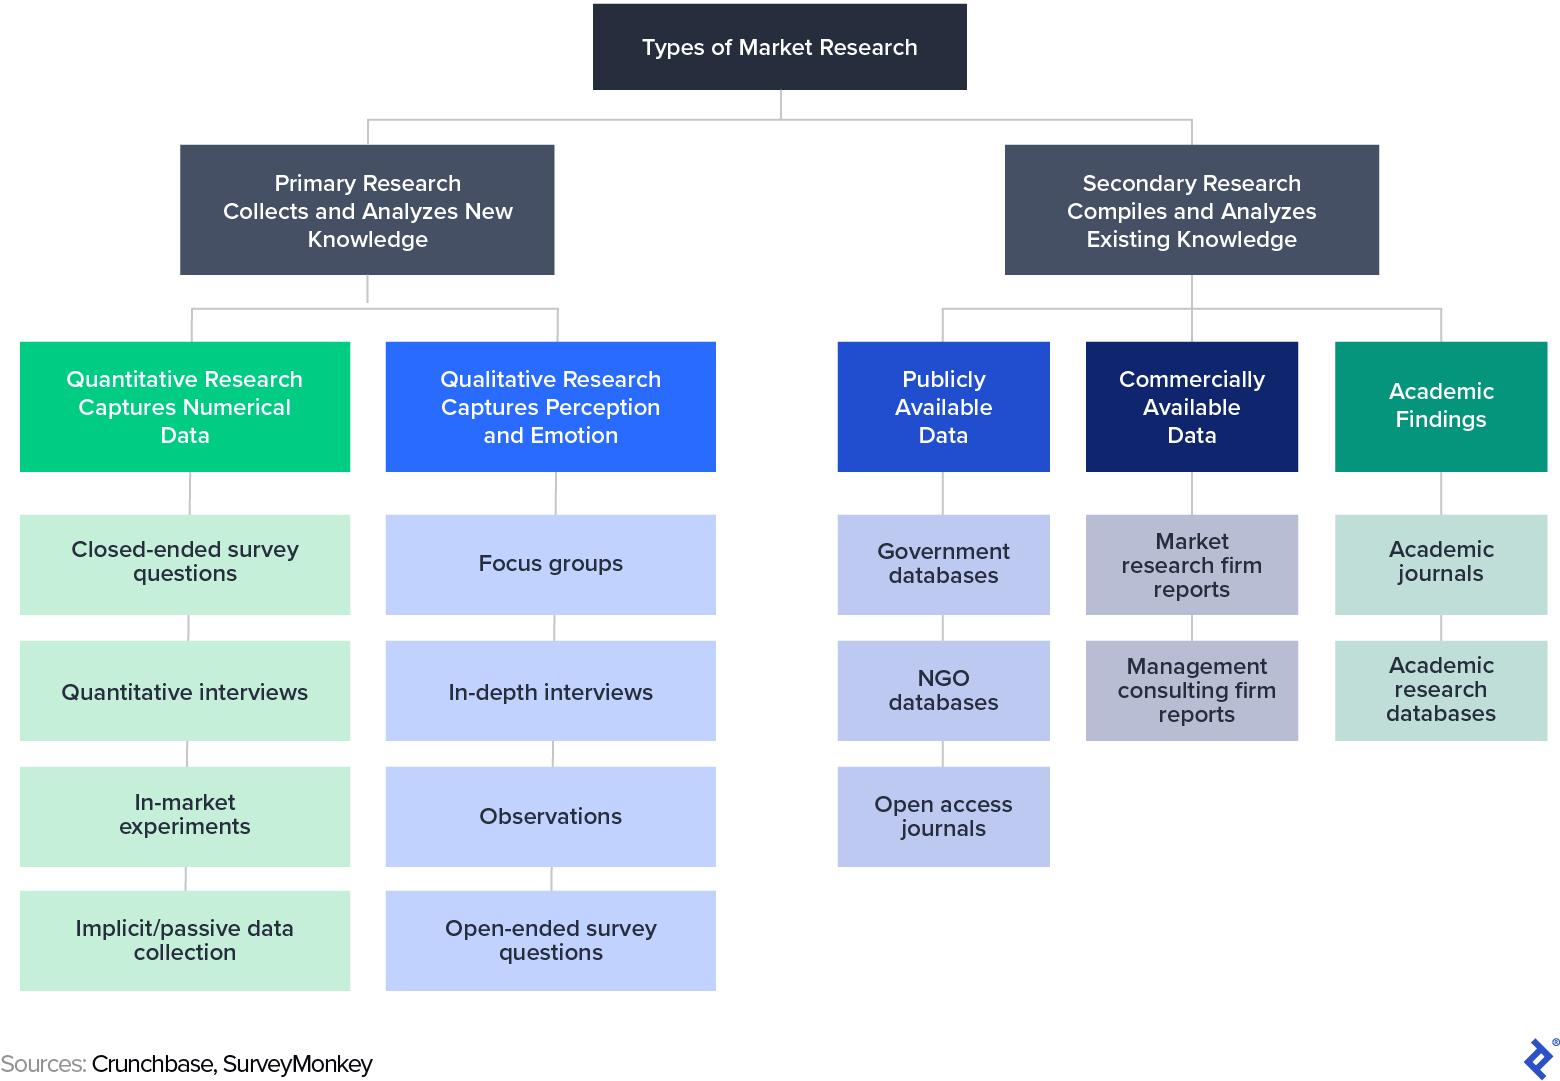
Even the most basic market research can produce powerful results for a company trying to define its customer base. Surveys of prospective customers are great sources of both qualitative and quantitative data, and I use them extensively, in the form of electronic questionnaires and remote interviews. In-depth interviews with current company employees, vendors, and customers can provide qualitative insights that you can use to shape company strategy to maximize the business’s value. I typically avoid focus groups, since I find them difficult to administer impartially.
I have also used market research to help companies produce quantitative statistics that are often included in pitch decks and can help improve aspects of operations, such as the cost of acquiring customers. For instance, I once helped an early-stage automated manufacturing company design and conduct a survey of its potential customers, which were established firms in that industry. The survey gathered a broad range of quantitative data, such as head count and revenue, as well as qualitative responses characterizing industry challenges the companies were facing.
We incentivized survey respondents by giving them anonymized copies of responses, to help them understand how they compared with other companies in their industry. With the data we collected, we were able to help our client clearly define the following key variables in its business:
- Customer acquisition cost, a critical metric for many startups
- Customer lifetime value, which informs revenue projections
- Operating margins, which helped to determine the amount of money the company needed to raise
- Competitive differentiation, which helped the firm position itself in the context of the current issues the industry faced at the time
Using projections based on this data helped the company raise $25 million from a large venture fund, and that investment has paid off for all parties: The company has since met or exceeded expectations by developing Fortune 500 clients while navigating a path to becoming a market leader in its industry.
Pricing: Create Value for Your Customers, Then Capture Your Fair Share
The second pillar in a startup’s metrics strategy is to adopt the most lucrative and sustainable pricing mechanism in order to maximize sales revenue. However, I’ve noticed that few entrepreneurs fully explore the variety of pricing strategies available to them.
Pricing can seem like a dark art. Charge too much, and you lose customers. Charge too little, and you leave money on the table and undermine your fundraising goals. The balance is delicate but you can achieve it.
First, you need to understand pricing fundamentals:
- Cost-plus pricing: Calculating the cost of your product or service and then adding a reasonable margin
- Competitive pricing: Determining your price based on what competitors or potential competitors are charging
- Penetration pricing: Initially undercutting your competition by pricing lower than prevailing industry rates to build a customer base
- Value-based pricing: Using market research to estimate the value your potential customers place on your product or service
While each approach has its benefits, I believe that 90% of startups will fare best using value-based pricing. I agree with pricing expert Madhavan Ramanujam’s assessment that companies should expect to recoup about 20% to 25% of the total value they create for customers. This creates a sustainable balance between your bottom line and the customer’s benefit.
Use this framework to determine your product or service’s ideal price. (An example follows each step to illustrate how the process works.)
-
Quantify the dollar value your product or service provides for customers. How much money does it save them in time, effort, or both? Or how much more money can they earn using it?
- Example: Using Sample Corp.’s widgets, Buyers Unlimited is X% likely to achieve sales worth $A.
-
Determine by percentage how much more successful your client is using your product than not using it.
- Example: Without Sample Corp.’s widgets, Buyers Unlimited is Y% likely to achieve sales worth $A. Thus, Sample Corp.’s widgets are worth $B = $A x (X% - Y%) to Buyers Unlimited.
-
Multiply the product of those two figures by 20% to arrive at your lowest price or 25% to arrive at your highest price.
- Example: Sample Corp. should earn between $B x 20% and $B x 25% for providing widgets to Buyers Unlimited.
To show the formula in action, let’s say that purchasing Sample Corp.’s widgets means Buyer’s Unlimited is 15 percentage points more likely to make $100,000 in additional sales per year. That means the widgets are worth 15% x $100,000, or $15,000 to Buyers Unlimited. Then 25% of $15,000 gives you a high price of $3,750 and 20% gives you a low price of $3,000.
As the math indicates, the higher the ROI your product or service delivers, the higher the price you can set.

Just as important as charging the right price is charging the customer the right way.
For many startups, especially those in the tech sector, there will already be some kind of established norm for your business model. If your company seeks to compete with social networking firms or search engines, the model is to offer the service to consumers for free and make money from advertising. If you’re developing a streaming service, you would typically follow suit with other streaming services and adopt the freemium model, offering a stripped-down version for free and hoping to upsell customers on a premium subscription. The same is true for business-to-business models, especially software as a service, the pricing model of which is typically built around subscription services with tiers based on the overall number of users.
While it’s possible to adopt a different approach from your competitors, the reality is that the more competitive an industry, the more difficult it is to depart from its norm. That said, a disruptive pricing approach can be an important differentiator in a crowded field, so don’t discount it entirely.
If you opt to align with industry norms, you will still have opportunities to increase revenue within those norms by using demand pricing, pricing tiers, and special fees where appropriate. For instance, I worked with a client that built a business around managing healthcare clinics. We developed a pricing schedule that included not just the management fee for overseeing operations, but also consulting fees for advising on the opening of new clinics, profit-sharing for providing financing, and fees for other specific services at the clinics.
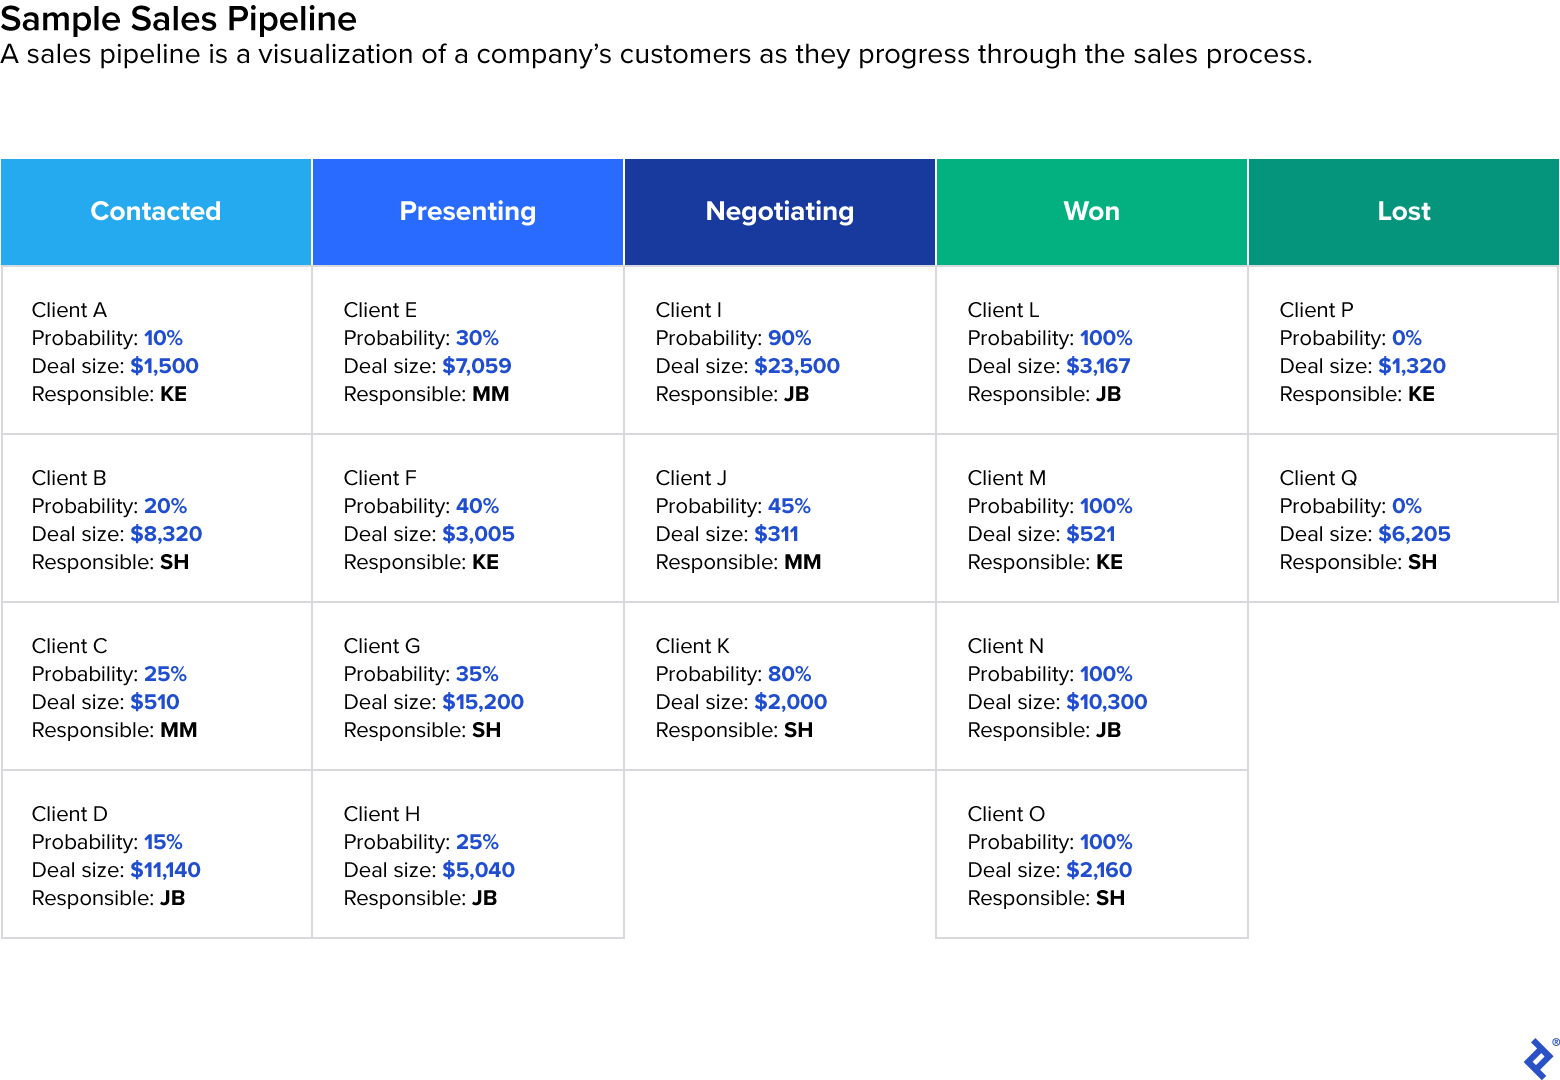
The Sales Pipeline: Track Conversions and Sales
For the third and final pillar, I advise startups to maximize revenue forecasts by developing and refining metrics around customer acquisition and sales. This means producing the most efficient sales pipeline possible. A sales pipeline allows founders, executives, sales personnel, and investors to visualize the movement of customers through the different stages in a company’s sales cycle. By estimating the probability of conversion of potential customers to actual customers based on their stages, you can generate revenue forecasts.
Conversion data is particularly powerful from an operations and tactics perspective. With this data, you can project how many new leads you need to generate over a certain time frame to reach the annual revenue forecasts.
You can use a spreadsheet to create a sales pipeline, but I recommend investing in a customer relationship management system, or CRM. At its simplest, a CRM is an application with a number of tools to coordinate a company’s customer relationships and track interactions such as calls, presentations, and other engagements. The CRM serves as a single source of truth about your customers, a one-stop shop for managing sales and prospect information. It’s vital because it enables your company to store information about its relationships and to organize that data internally as it grows. Those capabilities can provide you with a more feature-rich pipeline than a spreadsheet can—I like to say a CRM gives you a 3D view while a spreadsheet can only handle 2D.
There are numerous providers, with options like Salesforce on one end of the price spectrum serving large enterprise clients. On the other end, there are more budget-conscious platforms like HubSpot, with entry-level pricing that makes it particularly popular with growth companies.
Once the CRM is in place, you can then translate information about prospective customers into your sales pipeline. While the larger goal is to produce topline metrics like pipeline value and a revenue forecast for investors, the application is also useful for providing insights into operations, such as sales pipeline velocity and conversion rate per stage.
This data can also be used to estimate customer acquisition cost and customer lifetime value, which can inform a broader conversation with your marketing team about sourcing leads and tailoring a customer acquisition strategy.
A recent experience I had working with an early-stage marketing startup is instructive here. Although the founder is a top-notch salesperson, the company’s CRM was rudimentary, with a sales log on one basic application and contact information on another. My first step was to upload all this information onto one platform through HubSpot. Then we were able to customize it according to the founder’s sales cycle and to develop a sales pipeline that gave her a clear view of her customer relationship funnel. This allowed her to calculate revenue forecasts more efficiently and accurately.
To customize your pipeline, remember that each stage should reflect a clearly defined sales process, from initial contacts and referrals to diligence, pitches, proposals, negotiations, and outcomes. You can then assign different probabilities of conversion for each stage or for each deal. Often, the CRM can do that automatically, but I typically adjust that estimate using historical data. I also try to err on the side of the most conservative estimate. As you move through the sales stages, the odds of conversion should always increase.
The adoption of a versatile CRM and creation of a pipeline are two essential steps for generating an annual revenue forecast that will impress investors. There are two reasons for putting in the time and effort to develop defensible sales metrics: The first is the data strategy it will establish and the second is the fundraising payoff. I tell my early-stage startup clients that they should expect to invest around 200 hours into this process, the first 100 working to maximize their revenue forecast and produce other key performance indicators and the second 100 hours networking and pitching to investors. It’s a significant investment of time and resources, but in my experience, it increases the odds of getting funded up to fourfold while increasing the amount of funding received by as much as five times.
Quantitative forecasting without a strong financial history is difficult but achievable. Best of all, if you put in the effort on the front end, you will not only improve your fundraising prospects, but also position your business for strategic growth in the years to come.
Advanced Financial Modeling Best Practices: Hacks for Intelligent, Error-free Modeling
Further Reading on the Toptal Blog:
Understanding the basics
Qualitative forecasts are projections based on insights or opinions by subject matter experts. Quantitative forecasts are mathematical projections derived from existing data and fact-based assumptions. A market outlook is a qualitative forecast, while a sales projection is typically a quantitative forecast.
Quantitative forecasts are essential for making plans and decisions that depend on hard numbers. For example, you would need accurate sales projections to know how much inventory to purchase.
Qualitative forecasts are helpful for subjective plans and decisions. For example, if a stronger than average travel season is forecasted for the summer, hotels might consider adjusting their marketing strategy to make the most of it.