
Helping AI See Clearly: A Dashboard Design Case Study
In this dashboard design case study, Toptal UI expert Fellype Silva describes how he built a user interface that improved the image recognition capabilities of automated AI systems.

In this dashboard design case study, Toptal UI expert Fellype Silva describes how he built a user interface that improved the image recognition capabilities of automated AI systems.

Fellype is an experienced digital product designer who specializes in user interfaces. His user-focused designs support the business needs of multiple clients, including a market research firm, a pediatric mental health app developer, a real estate marketing startup, and a venture capital studio.
Expertise
Previously At

Artificial intelligence (AI) is hard at work in many industries today. It helps retailers manage inventory and predict demand, makes it easier for doctors to identify cancer in lung scans, and enables cars to drive themselves.
But AI-powered automation continues to evolve and still requires human intervention. In this dashboard design case study, I detail how I developed UIs that help human operators improve AI recognition processes.
The Client
The client was a US startup that helps its customers solve AI image recognition errors for multiple industries in real time. The solutions it provides improve automated systems that enable terrain mapping, plant classification, retail product identification, barcode scanning, and more.
AI image recognition systems are trained to recognize and interpret visual input and make decisions based on what they “see.” But sometimes these systems encounter exceptions—images that they aren’t able to process because the object has an unexpected appearance. An exception can cause an AI system to fail to identify crucial information or misidentify what it sees. For example, a grocery product scanner might not recognize a carton of orange juice because the container has changed or a self-driving farm robot may become confused by an obstacle. Problems like these can cause delays or disruptions to a business’s operations.
To solve these problems, the client’s software integrates with its customers’ AI systems, enabling human operators to review and resolve recognition issues in real time. But operators do more than solve exceptions: They also teach AI systems what to do the next time they encounter something similar. This results in AI systems that are better equipped to identify a wider range of images.
The Brief
Over the course of two months, I worked with the client to deliver designs for an operator dashboard and a customer dashboard. I also prepared a component library and style guide that accompanied these deliverables.
My approach follows the design thinking process, which involves research, brainstorming, low-fidelity prototyping, high-fidelity prototyping, and user testing. I always adapt this process based on the availability of time, capital, and people.
During the project, I worked closely with the client’s founding team and front-end developer, sharing daily updates that helped everyone stay informed of my progress. I also collaborated with two operators who provided invaluable insight into their day-to-day work.
Improving the Operator Dashboard
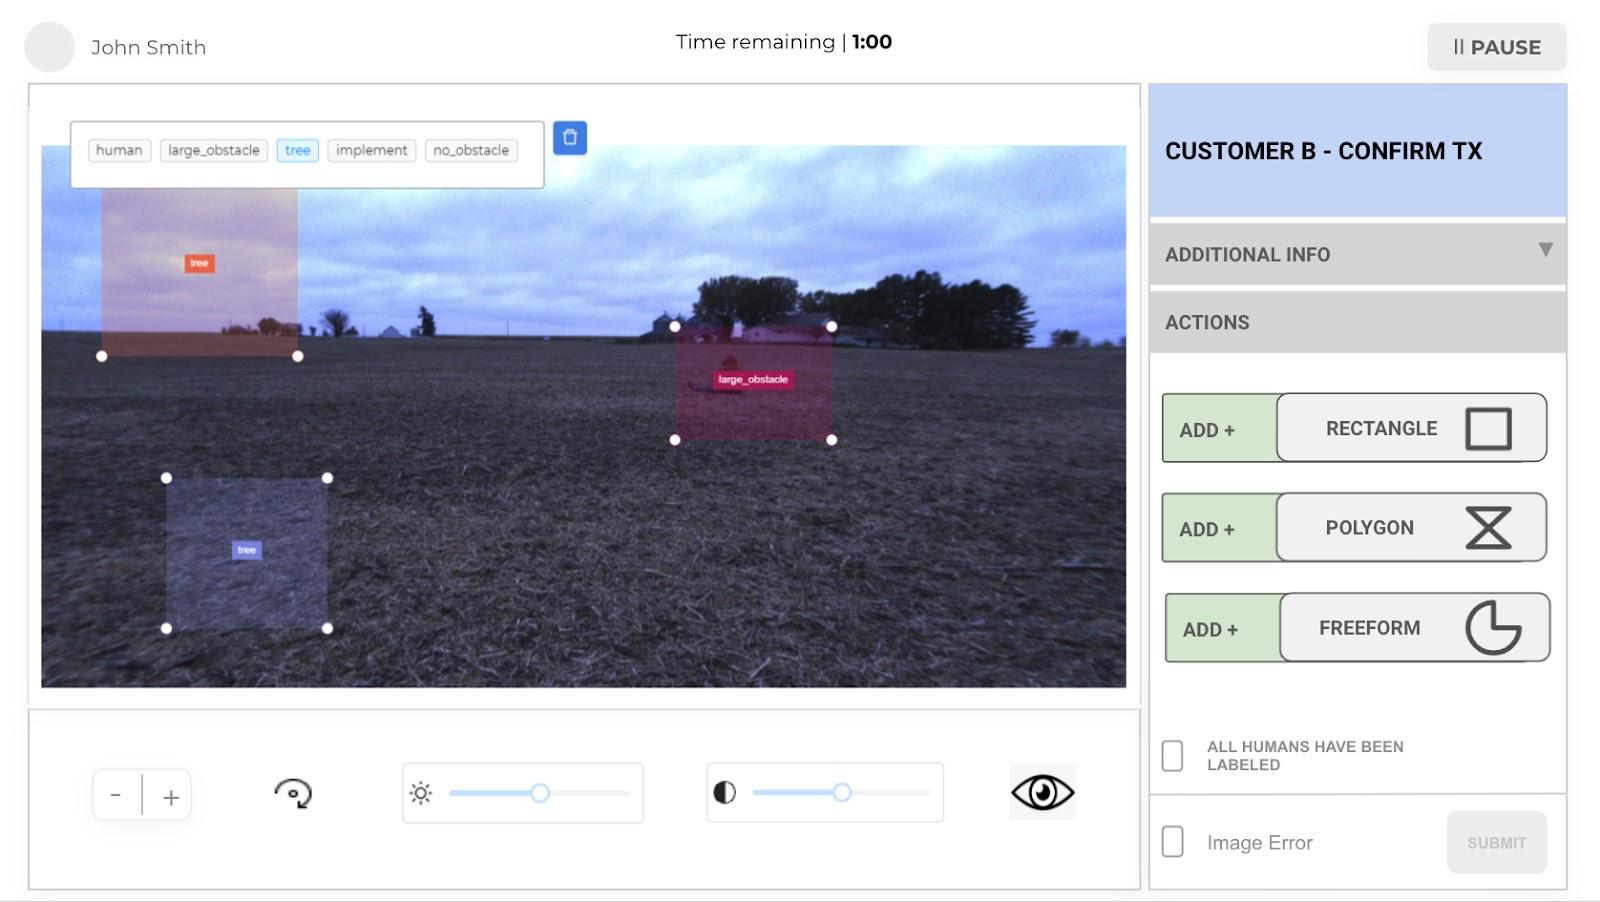
At the heart of the client’s product is the operator dashboard—the interface that its AI specialists use to resolve image recognition issues. When an AI system has trouble identifying an image, that image is sent to an operator’s dashboard. The operator manually labels the image by marking each object and classifying it based on predetermined labels, such as “human,” “tree,” or “large obstacle.”
When I interviewed the client’s operators, they showed me the current state of the software they were using and allowed me to observe them doing their work. From this initial research, I collected insights, pain points, and opportunities for improvement that would inform my designs.
I discovered that important functionality was missing and that certain tasks were unnecessarily complicated, which made the interface hard to use. For example, in order to label an image, the operator needed to go back and forth between the toolbar and the image each time to select, label, review, and submit. Likewise, the ability to undo or redo an action was also missing, which meant operators had to repeat tasks or take extra steps when they made a mistake.
Another concern was that the interface did not have a unified look and feel since it relied mostly on a mix of ready-made components. These inconsistencies made certain elements and functions hard to find or use.
With these opportunities for improvement in mind, I brainstormed initial concepts and created wireframes, which I shared with the two operators. Every day, over the course of a week, I presented wireframes to the operators and discussed their initial impressions via virtual feedback sessions. The sessions were highly collaborative and helped me compile ideas for refining the dashboard.
One interesting point that came up during the feedback session involved the amount of information shown on the right-hand toolbar, where operators selected their actions. My original design suggested a very minimalist solution—a toolbar that could be collapsed into a narrow panel showing only icons. This, I believed, would allow the focus to be on the central image.
However, the operators didn’t like the idea because it was hard to understand at a glance what the icons meant and what the main actions were. With that important insight, I realized that simpler is not always better. In this case, leaving more information visible helped the operators work more efficiently.
After improving and refining the initial wireframes, I created an interactive, low-fidelity prototype in Figma and sent it to the operators and stakeholders so they could test it. Once I received their feedback, I iterated the design until everyone was satisfied.

As I mentioned, the original dashboard was created using a mix of ready-made UI components, and the in-product experience was not consistent throughout.
However, in the interest of time and budget, the stakeholders wanted to retain the ready-made components where possible. So, working with the front-end developer, I customized the existing components, which included buttons, forms and fields, and other UI elements, to match the look and feel of the new dashboards. These tweaks impacted colors, typefaces, spacing, and other details. In cases where it was impossible to update existing components, such as the live-view progress animations, we created new ones. Most of the operator dashboard was built from scratch this way.
I then produced a navigable, high-fidelity prototype that incorporated color and the types of photos operators would typically see in the software. I also included selection tools such as rectangles, pencils, and polygons, and added a panel at the bottom of the screen where operators could make image enhancements. Finally, I sent the prototype, along with specifications for microinteractions animated in After Effects, to the front-end developer so they could build the dashboard.

Designing a Customer Dashboard From Scratch
The second phase of the project was a customer dashboard that allows owners of the AI systems to observe the progress of their issues being resolved. The client wanted to improve this experience before launching the product to more customers.
Originally, the client’s customers had to request progress reports via email. Each report was a PDF or CSV file that indicated which exceptions were resolved or still in progress. The client needed a way for customers to check the status of each exception at a glance.

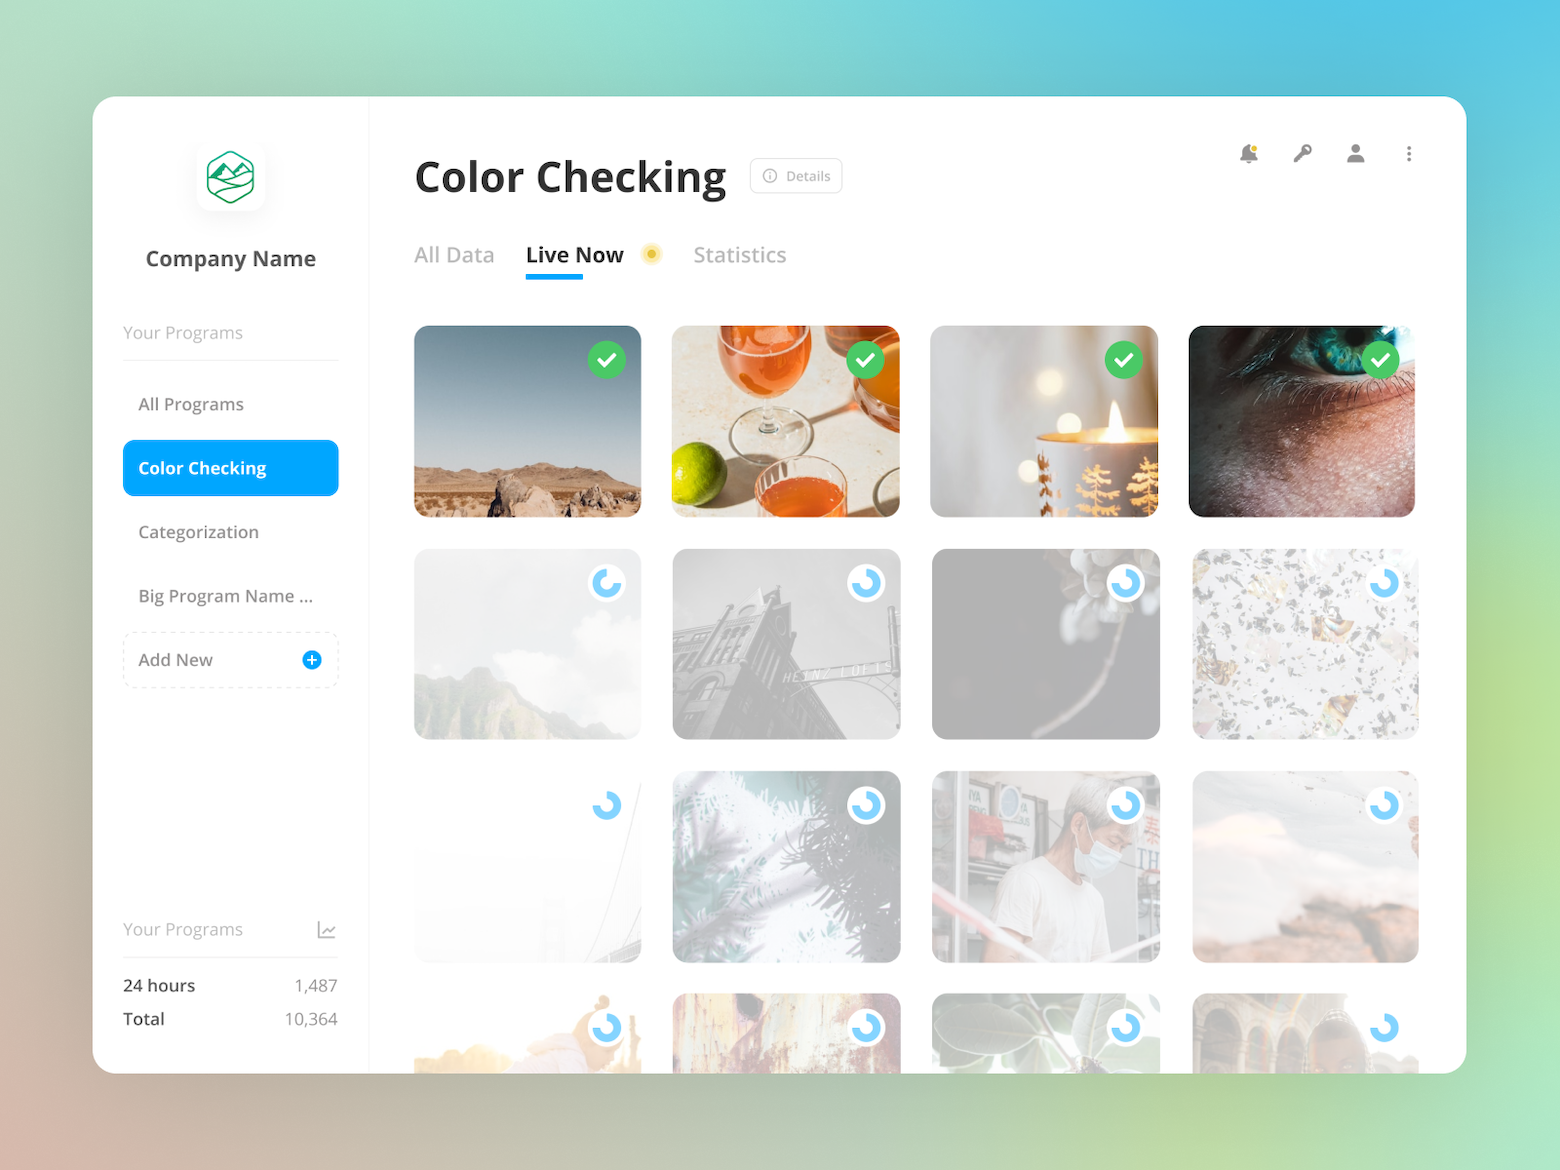
With the dashboard I designed, customers can log in and monitor the progress of each exception in real time. They can see the images that have come in, the ones that are being reviewed, and the exceptions that have already been resolved. They can also view the details of each solution to better understand how the issue was resolved.
The dashboard features graphs and visualizations to help customers better comprehend summary data such as total engagements and total resolutions. Customers can also easily access and manage the business aspects of their accounts, including payment methods and login information.
For the customer dashboard prototype, I created animations in After Effects to demonstrate how certain UI elements would behave. For instance, I created a progress animation to show an exception in review, which becomes a check mark when the exception has been resolved. I also designed a pulsing dot to show when a project is live.
Building a Component Library in Figma
One important aspect of designing products that are scalable and easy to maintain is to create a component library and style guide. Having standardized and reusable design components ensures both consistency and speed when scaling and adding features to a digital product.
I chose to house the client’s library in Figma because it makes it easy to modify components and update them wherever they appear in a design. All components and styles were documented using an eight-point grid. The library included core components such as menus, sidebars, tabs, input icons, and buttons, while the style guide covered elements such as typography, colors, icons, spacing, and grids.
In the future, the component library can evolve into a full-fledged design system. But for now, it serves as a foundation for growing the product and as a reference for future designers, be they in-house staff, freelancers, or agency professionals.

User Research Matters
This project was rewarding because it provided me with the opportunity to refine a digital product that’s enhancing automated systems in multiple industries and shaping the way AI interprets the world. It also reinforced the importance of user research and direct observation. Being able to watch the operators do their jobs and ask questions was essential to delivering dashboards that enabled them to work more efficiently and effectively. A designer can’t improve the way someone works until they understand their experience in the first place.
Further Reading on the Toptal Blog:
Understanding the basics
The core objective of a dashboard UI is to make complex information accessible and easy to digest. Priority data should be presented first while allowing access to supporting or secondary metrics or functions through dashboard UI elements such as menus, buttons, and inputs.
Dashboard UI elements can vary depending on the dashboard’s key function, but it’s important to present all essential information at a glance. In addition to metrics and data visualizations, dashboards may include illustrative visuals, labels, and animations.
A dashboard UI is an interface where users can access and browse through important information and metrics. User research, progressive disclosure, and a clear visual hierarchy are essential to designing effective dashboards.

Fellype Silva
Brasília - Federal District, Brazil
Member since July 6, 2020
About the author
Fellype is an experienced digital product designer who specializes in user interfaces. His user-focused designs support the business needs of multiple clients, including a market research firm, a pediatric mental health app developer, a real estate marketing startup, and a venture capital studio.
Expertise
PREVIOUSLY AT