Real Estate Valuation Using Regression Analysis – A Tutorial
Traditional approaches to valuing real estate can lean towards the qualitative side, relying more on intuition over sound rationale. Linear regression analysis, however, can offer a robust model for using past transactions in an area, to provide better guidance on property valuations.
Traditional approaches to valuing real estate can lean towards the qualitative side, relying more on intuition over sound rationale. Linear regression analysis, however, can offer a robust model for using past transactions in an area, to provide better guidance on property valuations.
Dan has deep expertise in all CFO functions, having led team of Controllers responsible for over $185 Bn of transactions at Credit Suisse.
Expertise
PREVIOUSLY AT

Executive Summary
Regression analysis offers a more scientific approach for real estate valuation
- Traditionally, there are three approaches for valuing property: comparable sales, income, and cost.
- Regression models provide an alternative that is more flexible and objective. It's also a process that once a model is made, becomes autonomous, allowing for real estate entrepreneurs to focus on their core competencies.
- A model can be built with numerous variables that are tested for impact on the value of a property, such as square footage and the number of bedrooms.
- Regressions are not a magic bullet. There is always the danger that variables contain autocorrelation and/or multicollinearity, or that correlation between variables is spurious.
Example: building a regression valuation model for Allegheny County, Pennsylvania
- There is a plethora of real estate information that can be accessed electronically to input into models. Government agencies, professional data providers, and Multiple Listing Services are three such sources.
- Initial data dumps require some cleaning to ensure that there are no irregular sets of information. For example, in our sample, houses that were transferred as gifts were removed, so as not to distort the results of fair market value.
- Using a random sample from 10% of the data, SPSS returned the following five variables as being most predictive for real estate value:
- Grade based on the quality of construction ranked 1-19 (1=Very Poor and 19=Excellent)
- Finished Living Area
- Air Conditioning (Yes/No)
- Lot Size
- Grade for physical condition or state of repair ranked 1-8
- Testing the results is critical, with the Durbin-Watson test used for autocorrelation and Breusch-Pagan test for heteroscedasticity. In our model, there were slight heteroscedastic tendencies, which indicates that the variability of some variables was unequal across the full range of values.
Can regression-based real estate analysis be useful for your business?
- Aside from valuing properties, regression analysis within real estate can be particularly beneficial in other areas:
- Testing returns performance on past deals
- Pricing analysis for list prices and rental rates
- Demographic and psychographic analysis of residential buyers and tenants
- Identifying targets for direct marketing
- ROI analysis for marketing campaigns
- In addition, when assessing candidates to build regression models, be wary of those who promise the world from day one. Building a robust regression model is an iterative process, so instead focus on those who are naturally curious and can think on the spot (i.e. can answer brainteasers with a thought process).
Too often in real estate, the process of valuation can come across as a high-brow exercise of thumb-sucking. The realtor will come over, kick the proverbial tires, and then produce an estimated value with very little “quantitative” insight. Perhaps the process is exacerbated by the emotional attachment that owning property brings given that for many, a house will be the largest financial investment made in a lifetime.
Yet, there is a method to this madness. Well, three to be precise.
How is Property Valued?
The comparable sales approach is most common in residential real estate and uses recent sales of similar properties to determine the value of a subject property. The sales price of the “comps” are adjusted based on differences between them and the subject property. For example, if a comparable property has an additional bathroom, then the estimated value of the bathroom is subtracted from its observed sales price.
Commercial real estate is considered to be more heterogeneous, so the comparable sales approach is used less frequently. The income approach, based on the concept that the intrinsic value of an asset is equivalent to the sum of all its discounted cash flows, is more commonly applied across two methods:
- Similar to the present value of an annuity, the direct capitalization method uses the net operating income (NOI) of a property divided by the “cap rate” to establish a value. The cap rate contains an implied discount rate and future growth rate of net operating income.
- The discounted cash flow method provides the present value of future cash flows over a set period of time, with a terminal value that is estimated from using a terminal cap rate.
The final technique is the cost approach, which estimates value based on the cost of acquiring an identical piece of land and building a replica of the subject property. Then the cost of the project is depreciated based on the current state of obsolescence of the subject property. Similar to the adjustments in the comparable sales approach, the goal is to closely match the subject property. The cost approach is less frequently used than the other two approaches.
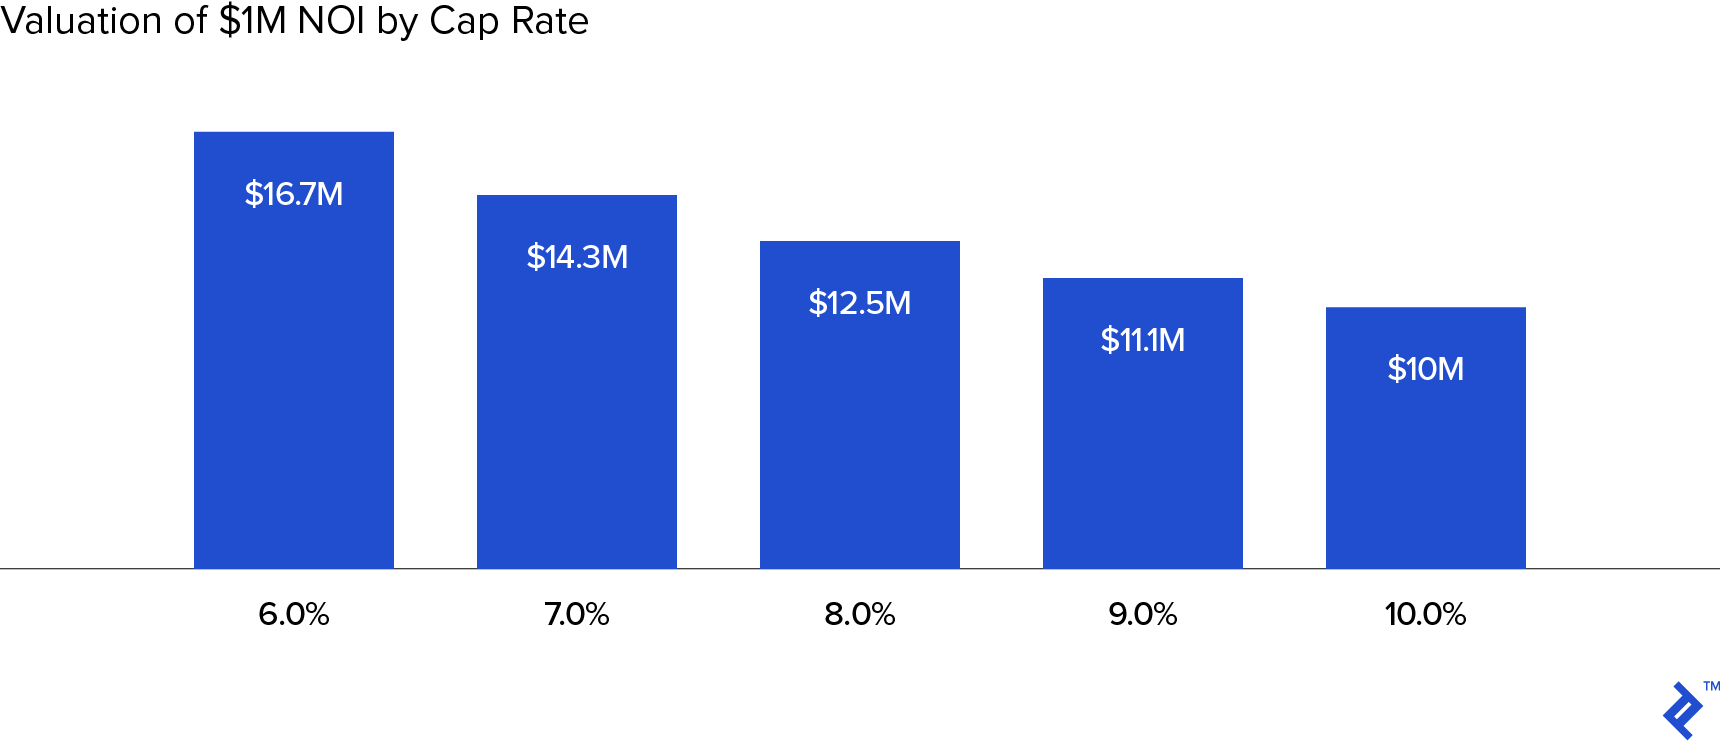
All traditional real estate valuation methods are subjective, due to the selection of the inputs used for valuation. For example, the choice of cap rate has a significant impact on a property valuation: when valuing a property with an NOI of $1M a 4% increase in the in the cap rate (from 6% to 10%) will decrease the value of the property by 40% (Chart Below).
Benefits of Using Regression Models in Real Estate Valuation
There are numerous benefits to using regression models for real estate valuation. The retail industry has embraced its use for site selection, but the real estate industry, for the most part, has overlooked its potential advantages. Regression analysis is particularly suitable for analyzing large amounts of data. It would be practically impossible to have a strong knowledge of every local real estate market in the country, but regression modeling can help narrow the search.
1. Flexibility
The greatest benefit of using regression modeling is its inherent flexibility - they can work independently of other models or in concert with them.
The most direct approach is to use existing sales data to predict the value of a subject property, as an output to the model. There are numerous sources of free data from local, state, and federal agencies which can be supplemented with private data providers.
Another option is to use regression models to more accurately predict inputs for other traditional valuation methods. For example, when analyzing a mixed-use commercial project, a developer could build one model to predict the sales per square foot for the retail space, and another model to predict rental rates for the residential component. Both of these could then be used as an input to an income approach for valuation.
2. Objective Approach
Using sound statistical principles yields a more objective approach to valuation. It’s one of the best ways to avoid confirmation bias, which occurs when people seek out information that confirms their preexisting opinion or reject new information that contradicts it. When I have built models for retailers to predict new store sales, they were often surprised to learn that many retailers benefit from being near a competitor. In fact, colocation with Walmart, who was often their largest competitor, was one of the most common variables used in my models. Relying on existing biases can lead to missed opportunities, or even worse, hide disasters right around the corner.
Some of the objective advantages of statistical valuation are the following:
- Statistical analysis allows you to determine the statistical significance (reliability) of individual factors in the model.
- While scenario or sensitivity analysis can give you a general idea about changes to inputs in more traditional methods, it’s more akin to making multiple predictions rather than giving you a better idea of the accuracy of the original prediction. On the other hand, when building a regression model, you will know what the range of outcomes will be based on a certain level of confidence.
Regression models are unique in the fact that they have a built-in check for accuracy. After building a model on a sample of the total population, you can use the model on out-of-sample data to detect possible sampling bias.
3. Sticking to Your Core Competency
Traditional valuation methods all have a significant risk of selection bias. When choosing comparable properties, it’s very easy to fall into the trap of selecting the best outcomes and assuming they are most like your project. There is also an emphasis on predicting variables, such as the rate of return in the income approach. Eliminating the need for this prediction could be attractive to many real estate investors, which is why regression-based valuation is a useful approach.
Potential Problems with Regression Analysis
The amount of jokes quoting the varying percentages of statistics that are made up is indeed a joke within itself. We are bombarded almost every day with media headlines about the results of a new research study, many of which seem to contradict a study published last year. In a world of soundbites, there is no time to discuss the rigorousness of the methods employed by the researchers.
There are many types of regression analysis, but the most common is linear regression. There are certain assumptions about linear regressions that shouldn’t be violated to consider the model valid. Violating these assumptions distorts statistical tests calculating the predictive power of the inputs and overall model.
Linear Regression Assumptions
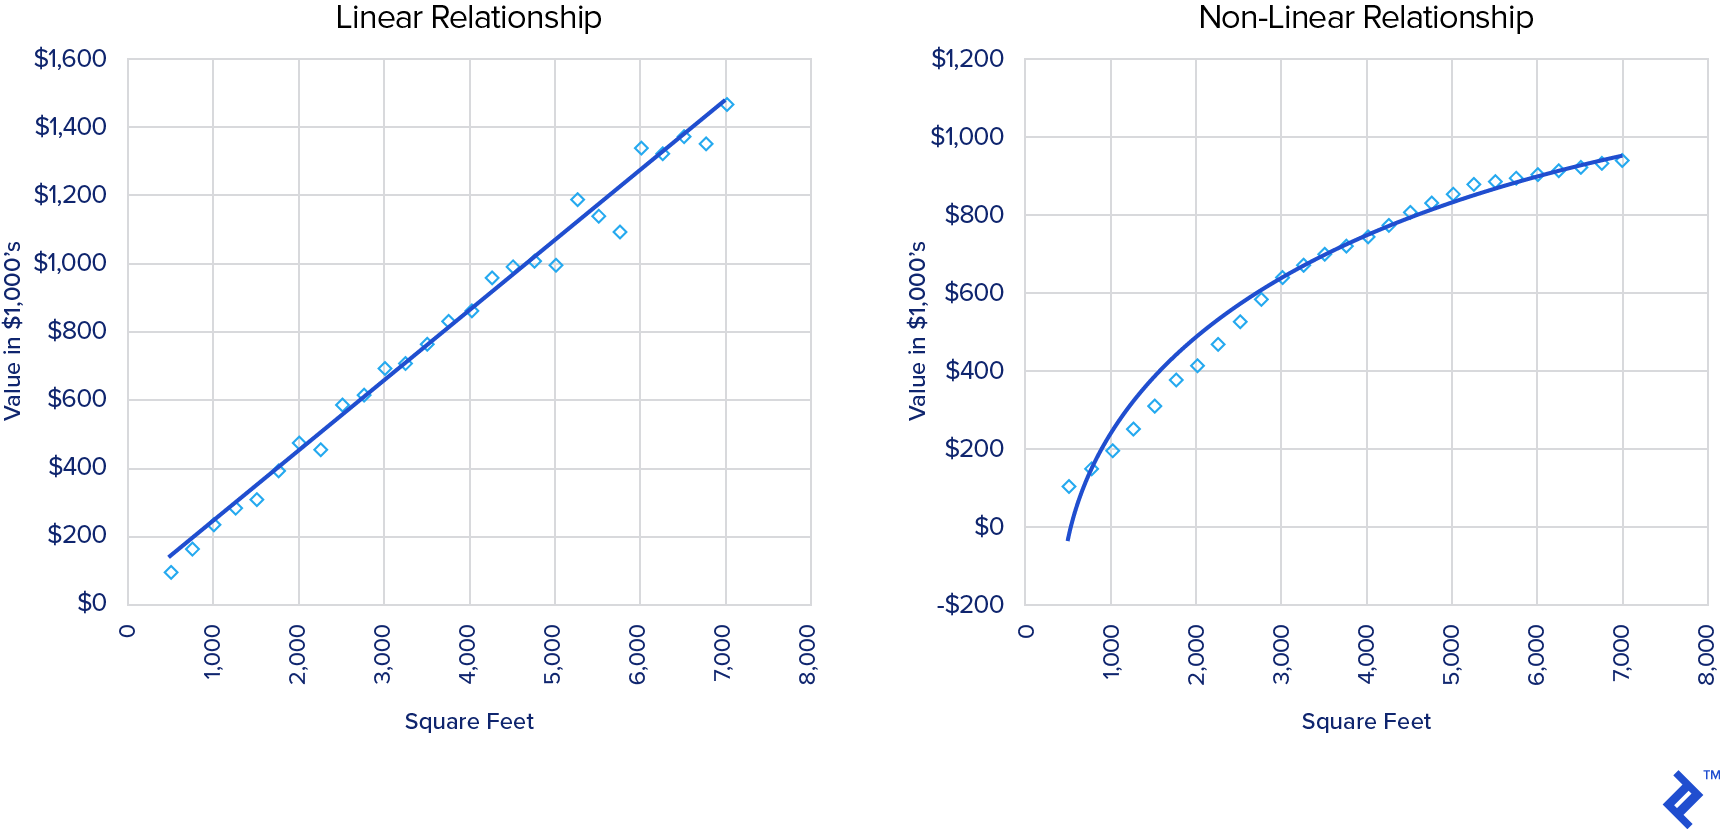
There should be a linear relationship between the inputs (independent variables) and the output (dependent variable). For example, we could assume that there is a linear relationship between the heated square feet in a home and its overall value. However, due to diminishing returns, we could discover that the relationship is non-linear, requiring a transformation of the raw data.
The independent variables should not be random. Put simply, the observations for each independent variable in the model are fixed and assumed to have no error in their measurement. For example, if we are using the number of units to model the value of an apartment building, all of the buildings in our sample data will have a fixed number of units that won’t change, regardless of how we build the model.
The “residuals” of the model (i.e. the difference between the model’s predicted result and actual observations) will sum to 0, or in simpler terms: the model we will use will represent the line of best fit.
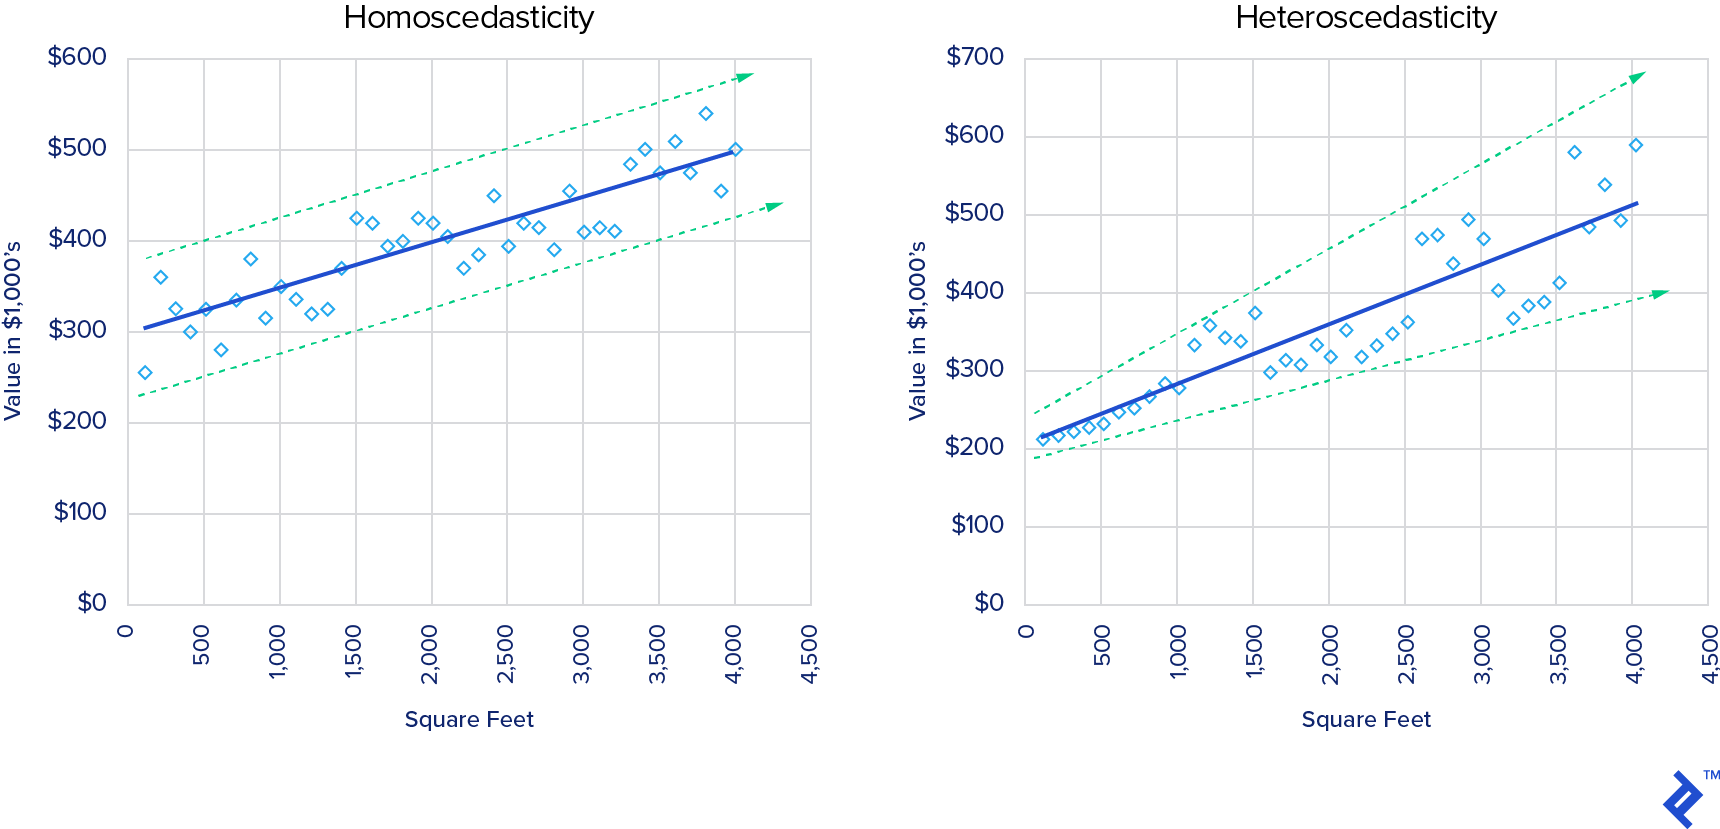
The model should be accurate for all observations for each independent variable. If we predicted the value of a home based on its square footage, we wouldn’t want to use the model if it was extremely accurate in predicting values for houses under 1,500 square feet, but there was a large amount of error for homes over 3,000 square feet. This is known as heteroscedasticity.
One of the most common problems with linear regression when looking at the real estate industry is a correlation of residual errors between observations. You can think of this as white noise that has no pattern. However, if there is a pattern to the residuals, then most likely we need to make an adjustment. This problem is difficult to conceptualize, but there are two main areas where this is a concern in the real estate industry.
1. Autocorrelation
Building a model based on observations over a long period of time would be inappropriate for predicting current values. Suppose we built a model to predict the value of a hotel property using the average room rate as an independent variable. The predictive power of this variable could be misleading because room rates have risen consistently over time. In statistical terms, there is an autocorrelation between observed average room rates showing a positive trend over time (i.e. inflation) that wouldn’t be accounted for in the model. The traditional comparable sales approach most widely used in residential real estate eliminates this issue by using only the most recent data. Since there are far fewer numbers of commercial transactions, this time restriction often renders the comparable sales approach ineffective. However, there are techniques using linear regression that can overcome the problems of autocorrelation.
The cluster effect is also a significant challenge in modeling real estate valuation. This can be thought of as spatial autocorrelation. The simplest way to think of this problem is to imagine building a model to predict the value of houses in two neighborhoods (A and B) on either side of a highway. As a whole, the model may work well in predicting values, but when we examine the residual errors we notice there is a pattern. The houses in neighborhood A are generally about 10% overvalued, and the houses in neighborhood B are roughly 10% undervalued. To improve our model, we need to account for this cluster effect or build one model for each neighborhood.
2. Multicollinearity
Ideally, variables within a model won’t be correlated to each other. This problem known is called multicollinearity. Using both square feet and the number of parking spots as inputs to a model valuing regional malls would likely demonstrate multicollinearity. This is intuitive because planning codes often require a certain number of parking spots based on the square footage of a commercial space. In this example, removing one of the variables would give a more accurate assessment of the adjusted model without significantly reducing its predictive power.
Other Considerations
Using observed data is the core of any empirical approach, but it’s important to remember that past results don’t always predict the future. Illiquid assets like real estate are particularly vulnerable to changes in the business cycle. The predictive power for certain variables is likely to change based on current economic conditions. This problem is not unique to linear regression and found with traditional approaches as well.
Correlation doesn’t equal causation. The purpose of model building is to find useful variables that will make valid predictions. You must be wary of spurious correlations. You may be surprised to learn that there is an extremely strong correlation between the divorce rate in Maine and per capita consumption of margarine. However, using divorce data from Maine wouldn’t make sense if you were trying to predict future margarine sales.
A Real-Life Example of Real Estate Valuation via Regression
Let’s now apply this knowledge practically and build a linear model from start to finish. For our example, we will attempt to build a real estate valuation model that predicts the value of single-family detached homes in Alleghany County, Pennsylvania. The choice of Alleghany County is arbitrary, and the principals demonstrated will work for any location. We will be using Excel and SPSS, which is a commonly used statistical software.
Finding data
Finding quality data is the first step in building an accurate model and perhaps the most important. Although we’ve all heard the phrase “garbage in, garbage out”, it’s important to remember there is no perfect dataset. This is fine as long as we can comfortably assume the sample data is representative of the whole population. There are three main sources of real estate data:
- The first and often best source of data comes from government agencies. Much of this data is either free or relatively low cost. Many companies will charge you for data that you could easily get for free, so always take a quick look on the internet before buying data. A web search will often yield results by searching for the county or city you are looking for and words like “tax assessor”, “tax appraisals”, “real estate records”, or “deed search”. Geographic Information Systems (GIS) departments are one of the most overlooked parts of many communities. They often have much of the data aggregated from various other local agencies. As a real estate developer, I often relied on their help to find high-quality data that I used to build models to help locate new properties for development. Economic development organizations can also be an excellent source of data.
- For-profit vendors are another option. They are particularly useful when you’re looking for data across multiple areas. Make sure you do your homework before paying large sums of money for their data. Don’t only rely on their sample data sets, because it could be misleading in terms of completeness. If you’re in doubt about what data they have available contact speak to a representative directly or inquire about a money-back guarantee.
- Finally, local Multiple Listing Services (MLS) are an invaluable resource. Most properties are marketed through a real estate agent that is a member of an MLS. Generally, members of an MLS are required to put all of their listings into the local system. Unfortunately, there are often many restrictions on joining an MLS, and the cost of data access can be quite high. It’s also important to make sure you don’t violate the terms of service when using their data and open yourself up to potential liability.
We will exclusively use free data for our example, sourced from the Western Pennsylvania Regional Data Center and the U.S. Census Bureau. The Alleghany Real Estate Sales data will give us a base file for our observations with sales price as our dependent variable (Y variable). We will also be testing variables using the walk score for each census tract and tax appraisal information.
One very useful variable to have when building real estate models is the latitude and longitude of each address. You can obtain this data through a geocoder which uses a street address to assign a latitude and longitude. The U.S. Census Bureau geocoder will also identify the census tract for each location which is commonly used to aggregate demographic and psychographic information.
Analyzing, transforming, and creating new variables.
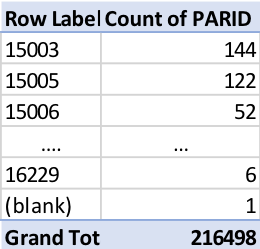
Now that we’ve selected our data sources, we need to examine the quality of the data. The easiest way to check for data quality is to run a frequency table for a few key variables. If there are a significant number of missing or corrupt entries, we will need to examine the data further. The table below shows that only 1 out of 216,498 records has a missing zip code in the sales file, and there are no erroneous zip codes like 99999 or 1X#45. This likely indicates that this is a high-quality dataset.
A data dictionary is an excellent resource when available. It will give a description of what each variable is measuring, and possible options for the variable. Our data contains an analysis of each sale performed in the county. This is key information, especially when working with raw deed records. All real estate transactions must be recorded to be enforceable by law, but not all transfers reflect the true fair market value of a property. For example, a sale between two family members could be at a below market price as a form of a gift or to avoid paying higher transaction costs like deed stamps. Luckily for us, the local government clearly marks transfers they believe to be not representative of current market values, so we will only use records reflecting a “valid sale”. These sales account for only about 18% of the total number of transactions, illustrating how important it is to understand your data before you begin using it for analysis. Based on my experience this ratio is quite common when analyzing deed records. It’s highly likely that if we built a model including the “invalid sales” our final results would be distorted.
Next, we will append our appraisal data and walk scores to the sales file. This gives us one single table to use for our model. At this point, we need to analyze the variables to see if they are appropriate for linear regression. Below is a table showing various types of variables.
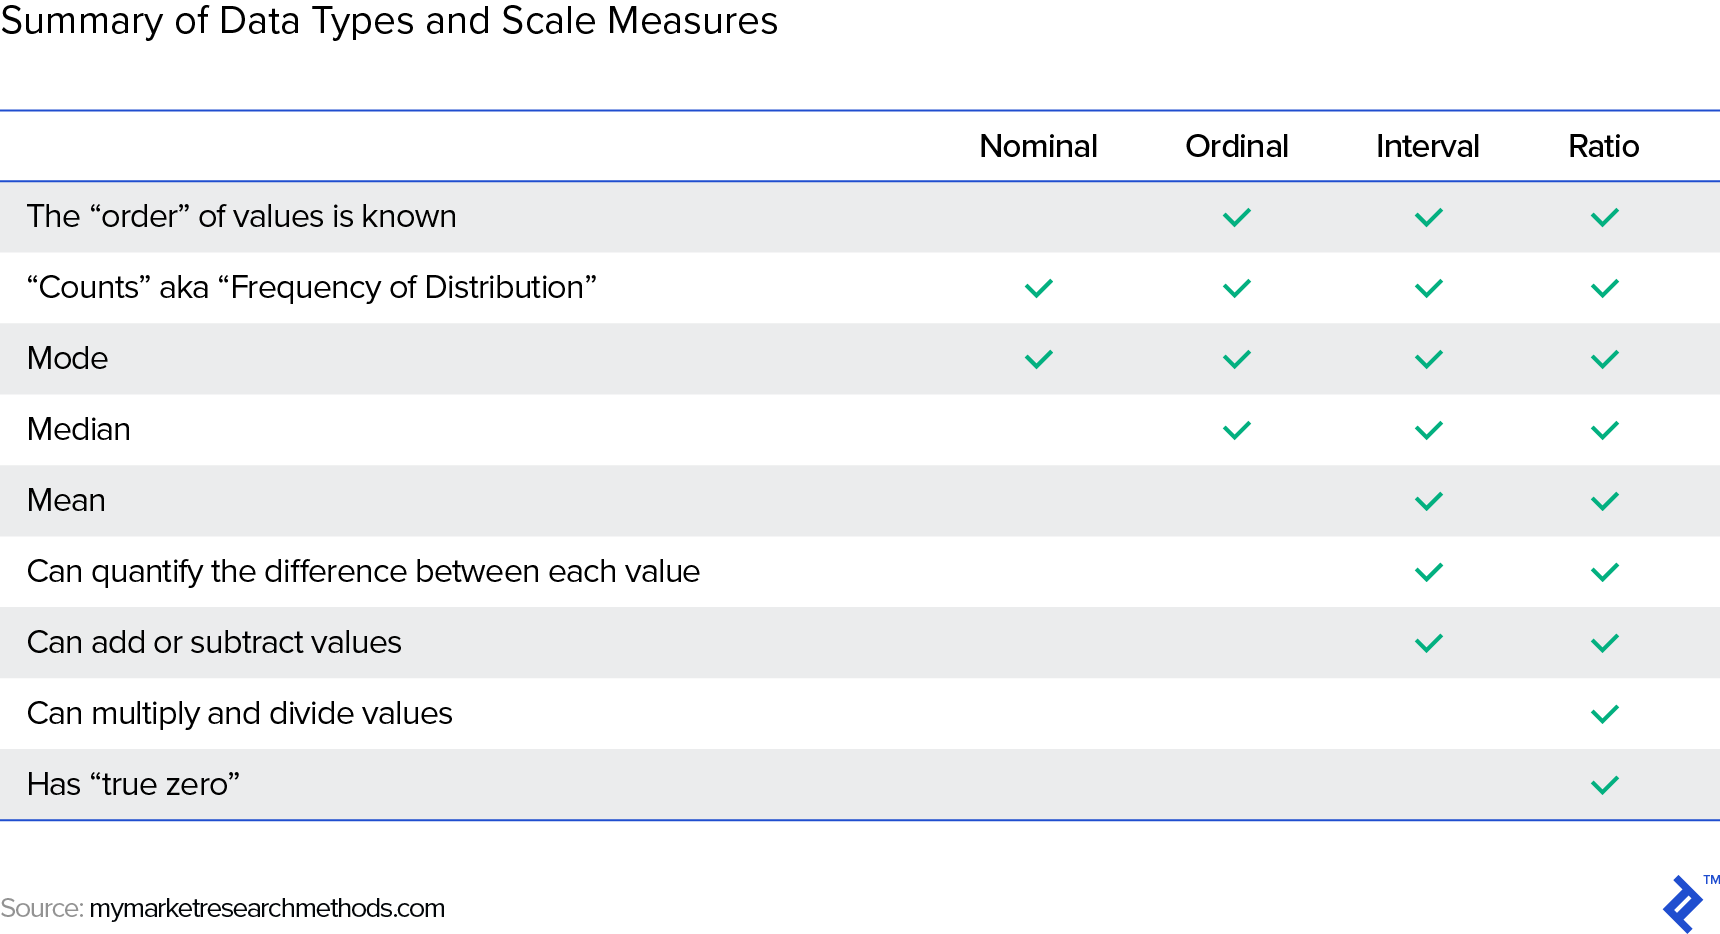
Our file contains several nominal values like neighborhood or zip code, which categorize data with no sense of order. Nominal values are inappropriate for linear regression without transformation. There are also several ordinal variables which grade the quality of construction, current condition of the property, etc. The use of ordinal data is only appropriate when we can reasonably assume that each rank is evenly spaced. For example, our data has a grade variable with 19 different classifications (A+, A, A-, etc.), so we can safely assume that these grades are likely evenly spaced.
There are also several variables that need to be transformed before we can use them in the model. One nominal value that can be transformed into a dummy variable for testing is the heating and cooling variable. We will set the variable to 0 for all properties without air conditioning and those with air conditioning to 1. Also, the letter grades need to be converted into numbers (e.g. 0=Worst, 1=Better, 2=Best) in order to see if there is a linear relationship with price.
Finally, we need to determine if it’s appropriate to use all of the observations. We want to predict the values of single-family detached homes, so we can eliminate all commercial properties, condos, and townhomes from the data. We also want to avoid potential problems with autocorrelation, so we only use data for sales in 2017 to limit the likelihood of this occurring. After we’ve eliminated all the extraneous records, we have our final data set to be tested.
Sample and variable selection
Selecting the correct sample size can be tricky. Among academic materials, there are a wide range of minimal numbers suggested and various rules of thumb. For our study, the overall population is quite large, so we don’t need to worry about having enough for a sample. Instead, we run the risk of having a sample so large that almost every variable will have a statistical significance in the model. In the end, about 10% of the records were randomly selected for modeling.
Variable selection can be one of the most difficult parts of the process without statistical software. However, SPSS allows us to quickly build many models from a combination of variables we’ve deemed appropriate for a linear regression. SPSS will automatically filter out variables based on our thresholds for statistical significance and return only the best models.
Building the model and reviewing results
From our sample data, SPSS produced five models. The model that was most predictive included the following 5 variables.
- Grade based on quality of construction ranked 1-19 (1=Very Poor and 19=Excellent)
- Finished Living Area
- Air Conditioning (Yes/No)
- Lot Size
- Grade for physical condition or state of repair ranked 1-8 (1=Uninhabitable and 8=excellent)
Let’s have a look at the results from SPSS. Our main focus will initially be on the R-squared value which tells us what percentage of variance in the dependent variable (price) is predicted by the regression. The best possible value would be 1, and the result of our model is quite promising. The standard error of the estimate which measures the precision of the model looks to be quite high at $73,091. However, if we compare that to the standard deviation of the sales price in the model ($160,429), the error seems reasonable.
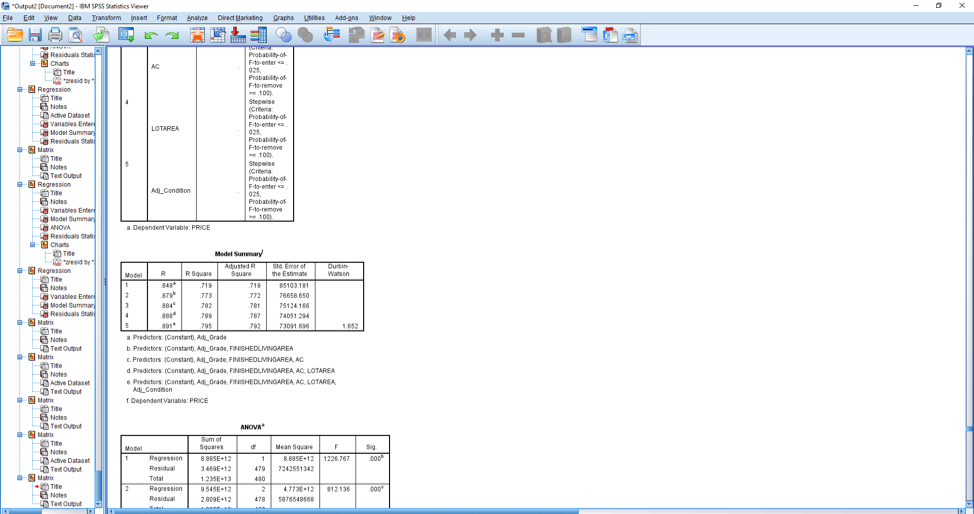
SPSS has built-in functionality to test for autocorrelation using the Durbin-Watson Test. Ideally, the value would be 2.0 on a scale of 0 to 4, but a value of 1.652 shouldn’t cause alarm.
Next, we test the results of the model to determine if there is any evidence of heteroscedasticity. There is no built-in functionality for SPSS, but using this macro written by Ahmad Daryanto we can use the Breusch-Pagan and Koenker tests. These tests show that there is heteroscedasticity present in our model since the significance level (Sig) in the chart below is below .005. Our model has violated one of the classical assumptions of linear regression. Most likely one of the variables in the model needs to be transformed in order to eliminate the problem. However, before we do this it’s a good idea to see what the effects of the heteroscedasticity are on the predictive power of our independent variables. Through the use of a macro developed by Andrew F. Hayes, we can look at the adjusted standard errors and significance levels for our independent variables.
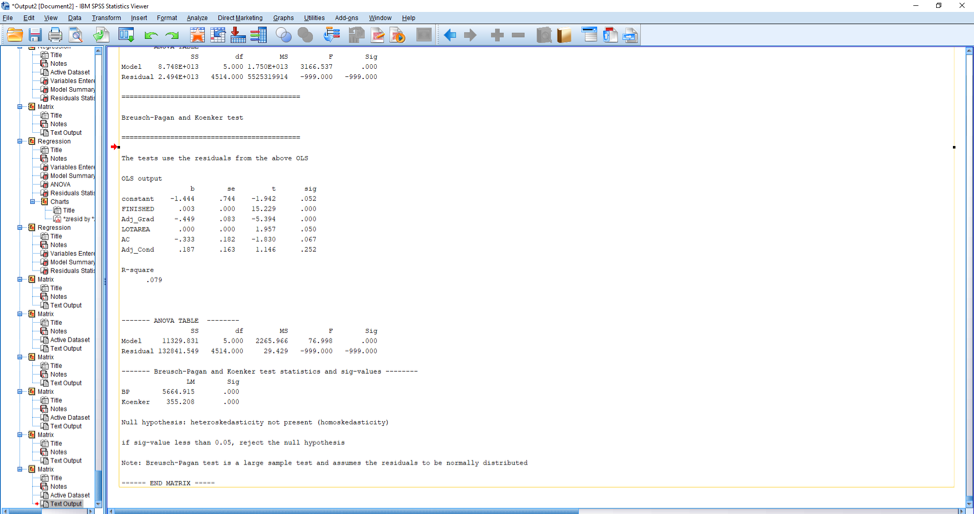
Further testing reveals that the independent variables remain statistically significant, after accounting for the heteroscedasticity in the model, so we don’t necessarily have to alter it for now.
Test and refine the model
As a final test, we will score all of the sales records that weren’t a part of the original sample with our model. This will help us see how the model performs on a larger set of data. The results of this test show that the R-squared value and standard error of the estimate didn’t change significantly on the large data set, which likely indicates that our model will perform as expected.
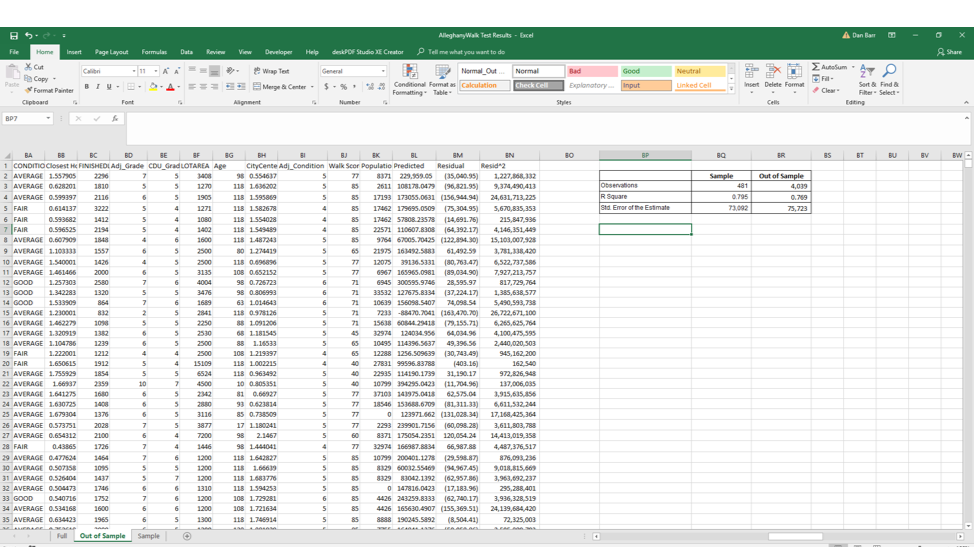
If we wanted to use our example model in real life, we would likely further segment the data to have several models that were more precise or look for additional data to enhance the precision of this single model. These steps would also likely remove the heteroscedasticity we saw present in the model. Based on the fact that we were attempting to use a single model to predict the value of houses in a county with over 1 million people, it should be no surprise that we were unable to build the “perfect” model in just a couple of hours.
Conclusions
Our goal was to build a model that predicts the value of single-family detached homes. Our analysis shows that we accomplished that goal with a reasonable amount of precision, but does our model make sense?
If we were to describe our model, we would say that the value of a house is dependent on the size of the lot, the square footage of the house, the quality of construction, the current state of repair, and whether or not it has air conditioning. This seems very reasonable. In fact, if we compare our model to the traditional valuation methods, we see that it is very similar to the cost approach, which adds the cost of acquiring land and constructing a new building adjusted for the current state of obsolescence. However, this similarity might be, to use a regression phrase, a spurious correlation.
Typically the cost approach is only recommended for valuing newer properties, due to problems with determining the appropriate method for depreciation of older properties. With our model, we’ve created a similar strategy that is useful for properties of any age, in fact, we’ve tested age as an independent variable and concluded that it has no statistically significant impact on the properties value!
Using Regression Analysis for Your Business
Hopefully, by now, you have a better understanding of the basics of regression analysis. The next question is: can it help your business? If you answer yes to any of these questions, then you probably could benefit from using regression analysis as a tool.
- Do you want a more scientific approach to determining value, making projections, or analyzing a particular market?
- Are you looking for better ways to identify potential real estate investments across large areas, regions, or even nationwide?
- Is your goal to attract large retailers, restaurants, or hospitality companies for your commercial real estate project?
- Do you think that you could potentially improve your decision-making process by incorporating new data points into the process?
- Are you concerned about the return on your investment in marketing for buyers and investors?
The example model above is a simple demonstration of the value of using regression modeling in real estate. The 2-3 hours it took to collect the data and build the model is far from showing its full potential. In practice, there are a wide variety of uses for regression analysis in the real estate industry beyond property valuation including:
- Pricing analysis for list prices and rental rates
- Demographic and Psychographic analysis of residential buyers and tenants.
- Identifying targets for direct marketing
- ROI analysis for marketing campaigns
Geospatial modeling uses the principles of regression analysis paired with the three most important things in real estate: location, location, location. Working as a residential developer for eight years I can attest to the power of geospatial modeling. Using ArcGIS, I was able to incorporate sales data, parcel maps, and lidar data to find properties that were ideal for development in the mountains of North Carolina.
Based on my experience, most of the money in real estate is made in the acquisition not the development of a project. Being able to identify opportunities that others miss can be a tremendous competitive advantage in real estate. Geospatial analytics is something large companies have taken advantage of for many years, but smaller companies often overlook.
How to Identify the Right Analytics Partner for Your Business
Very few people would rate statistics as their favorite subject. In fact, as a whole people are very bad at understanding even basic probabilities. If you’re doubtful of this opinion, take a trip to Las Vegas or Macau. Unfortunately, this can make it difficult to determine who to trust when you’re looking for advice on implementing regression analysis in your process. Here are some key things to look for when evaluating potential candidates
While people are bad at judging probabilities, intuition is actually rather good at detecting lies. You should be very skeptical of anyone who claims to be able to build a model that will answer all your questions! Don’t trust a guarantee of results. Hopefully, this article has illustrated the fact that regression analysis is based on empirical observation and sound science. It will always be the case that certain things are easier to predict than others. A trusted advisor will be open and honest when they can’t find the answers you’re looking for, and they won’t run through your budget trying to find one that isn’t there.
Look for Mr. Spock instead of Captain Kirk. Sound research can be an excellent marketing tool, but far too often people pay for sexy marketing materials with a whiff of pseudo-research and no logic to back it up. Some people are naturally more analytical, but great analytical skills come from practice. Ideally, anyone you hire to analyze data for your business will have experience finding solutions to a wide variety of problems. Someone with a narrow focus may be more susceptible to groupthink, especially when their experiences closely mirror your own.
Put potential candidates on the spot with questions that help demonstrate their reasoning abilities. This is not the time to rely on behavioral questions alone. Ideal candidates will have the ability to strategically use known information to reasonably estimate the answer to complex problems. Ask logical reasoning questions, like “How many tennis balls could you fit in the Empire State Building?”
Finally, you should look for someone with whom you can communicate. All of the information in the world won’t help if you can’t put it to good use. If someone uses so much jargon in an introductory conversation that your eyes start to glaze over, then they probably aren’t the right fit for your company.
Understanding the basics
What is the purpose of using a regression analysis?
A regression is useful for determining the strength of a relationship between one dependent variable (usually denoted by Y) and a series of other changing (independent) variables. This allows for running predictive tests on future outcomes based on past performance.
How can you value real estate?
There are four approaches, cost, income, comparable sales and via regression analysis.
What is autocorrelation?
It is when the similarity between observations is purely a function of the time lag between them. Not due to any kind of correlation
What is multicollinearity?
Ideally, variables within a model won’t be correlated to each other. When they are, this problem known is called multicollinearity.
What is heteroscedasticity?
When the variability of a variable is unequal across the range of values of another variable that is predicting it.
Daniel Barr, CFA, CAIA
Daniels, WV, United States
Member since January 15, 2018
About the author
Dan has deep expertise in all CFO functions, having led team of Controllers responsible for over $185 Bn of transactions at Credit Suisse.
Expertise
PREVIOUSLY AT

