Snapchat IPO: It’s All About the ARPU, Dummy
Ahead of Snap’s IPO, we take a look at whether the rumoured valuation makes sense, and find that whilst overall market concerns regarding DAU growth are justified, the market is likely under-valuing the company’s ARPU growth prospects. For us, Snap is a Buy.
Ahead of Snap’s IPO, we take a look at whether the rumoured valuation makes sense, and find that whilst overall market concerns regarding DAU growth are justified, the market is likely under-valuing the company’s ARPU growth prospects. For us, Snap is a Buy.
Joe has raised $1B+ for an energy project, advised on $500M+ in M&A deals, and managed high-growth businesses across different industries.
Expertise
PREVIOUSLY AT

For those who haven’t been following the news since Snap announced its intentions to go public, the press cycle has been on a rollercoaster ride. Initial valuation estimates in the $20-25bn range were quickly followed by a few bolder claims that the IPO may fetch the company a valuation as high as $40bn. With this in mind, immediate post-announcement commentary was decisively bearish, and largely centered around the company’s disproportionately high price compared to revenues of only $405m in 2016.
As time has gone by, more thoughtful analyses have shifted attention over to Snap’s growth prospects, and here significant concerns have emerged over the company’s slowing user growth, drawing comparisons to Twitter’s lacklustre post-IPO performance, and thus placing serious questions on the purported valuation figures. As a result, Snap has reportedly lowered its expectations, and certain estimates expect pricing to come as low as $14-$16 per share, implying a valuation of $16-19bn.
Ahead of its expected pricing (anticipated on March 1st) we take a look at whether the rumoured valuation makes sense, and provide our own guidance on where investors should be pricing the stock (the company will trade on the NYSE and is expected to trade under the ticker “SNAP”).
We find that whilst overall market concerns regarding DAU growth are justified, the market is likely under-valuing the company’s ARPU growth prospects, and conclude that there is significant upside on the table for investors. For us, Snap is a Buy.
Growth is the answer
As mentioned, initial reports largely focused on comparing Snap’s purported valuation to its revenues, which when compared to its peers, admittedly looks very expensive (table 1).
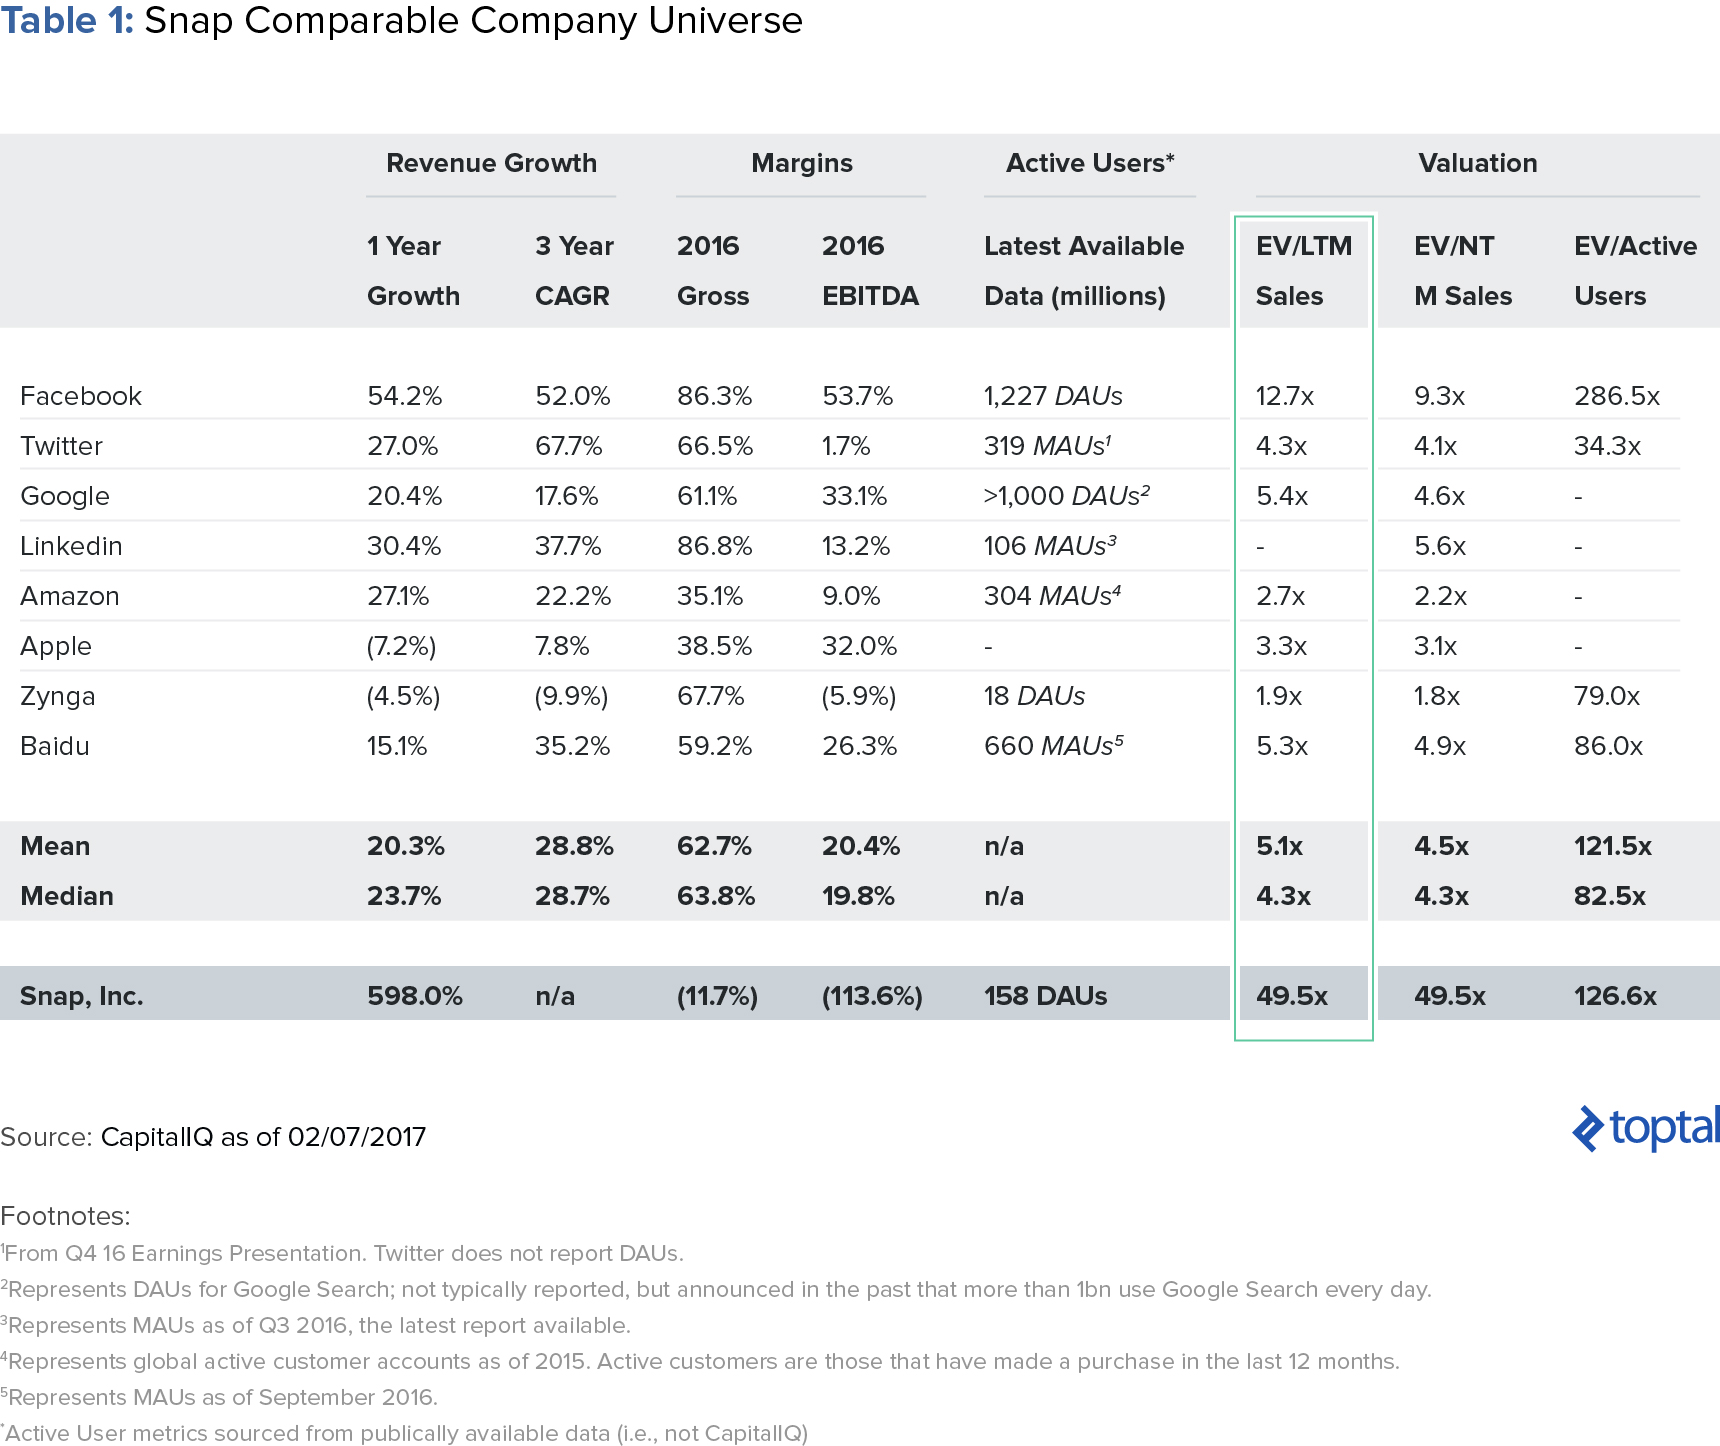
But such an analysis misses the mark completely in two important ways. Firstly, many of the companies in Snap’s peer universe are not directly comparable (Google is a search company and Amazon is an online retailer, to name a few). Limiting the peer universe to Snap’s most directly comparable peers, Facebook and Twitter, is a more appropriate juxtaposition (charts 1 and 2).
But even when just limiting one’s comparison to Facebook and Twitter, the maturity profiles of the respective companies are very different and must be accounted for. A fairer analysis would look at the metrics pre-IPO for all three (charts 3 and 4). In doing so, readers will notice that the relative valuation, albeit still expensive, looks less so than in the prior charts.
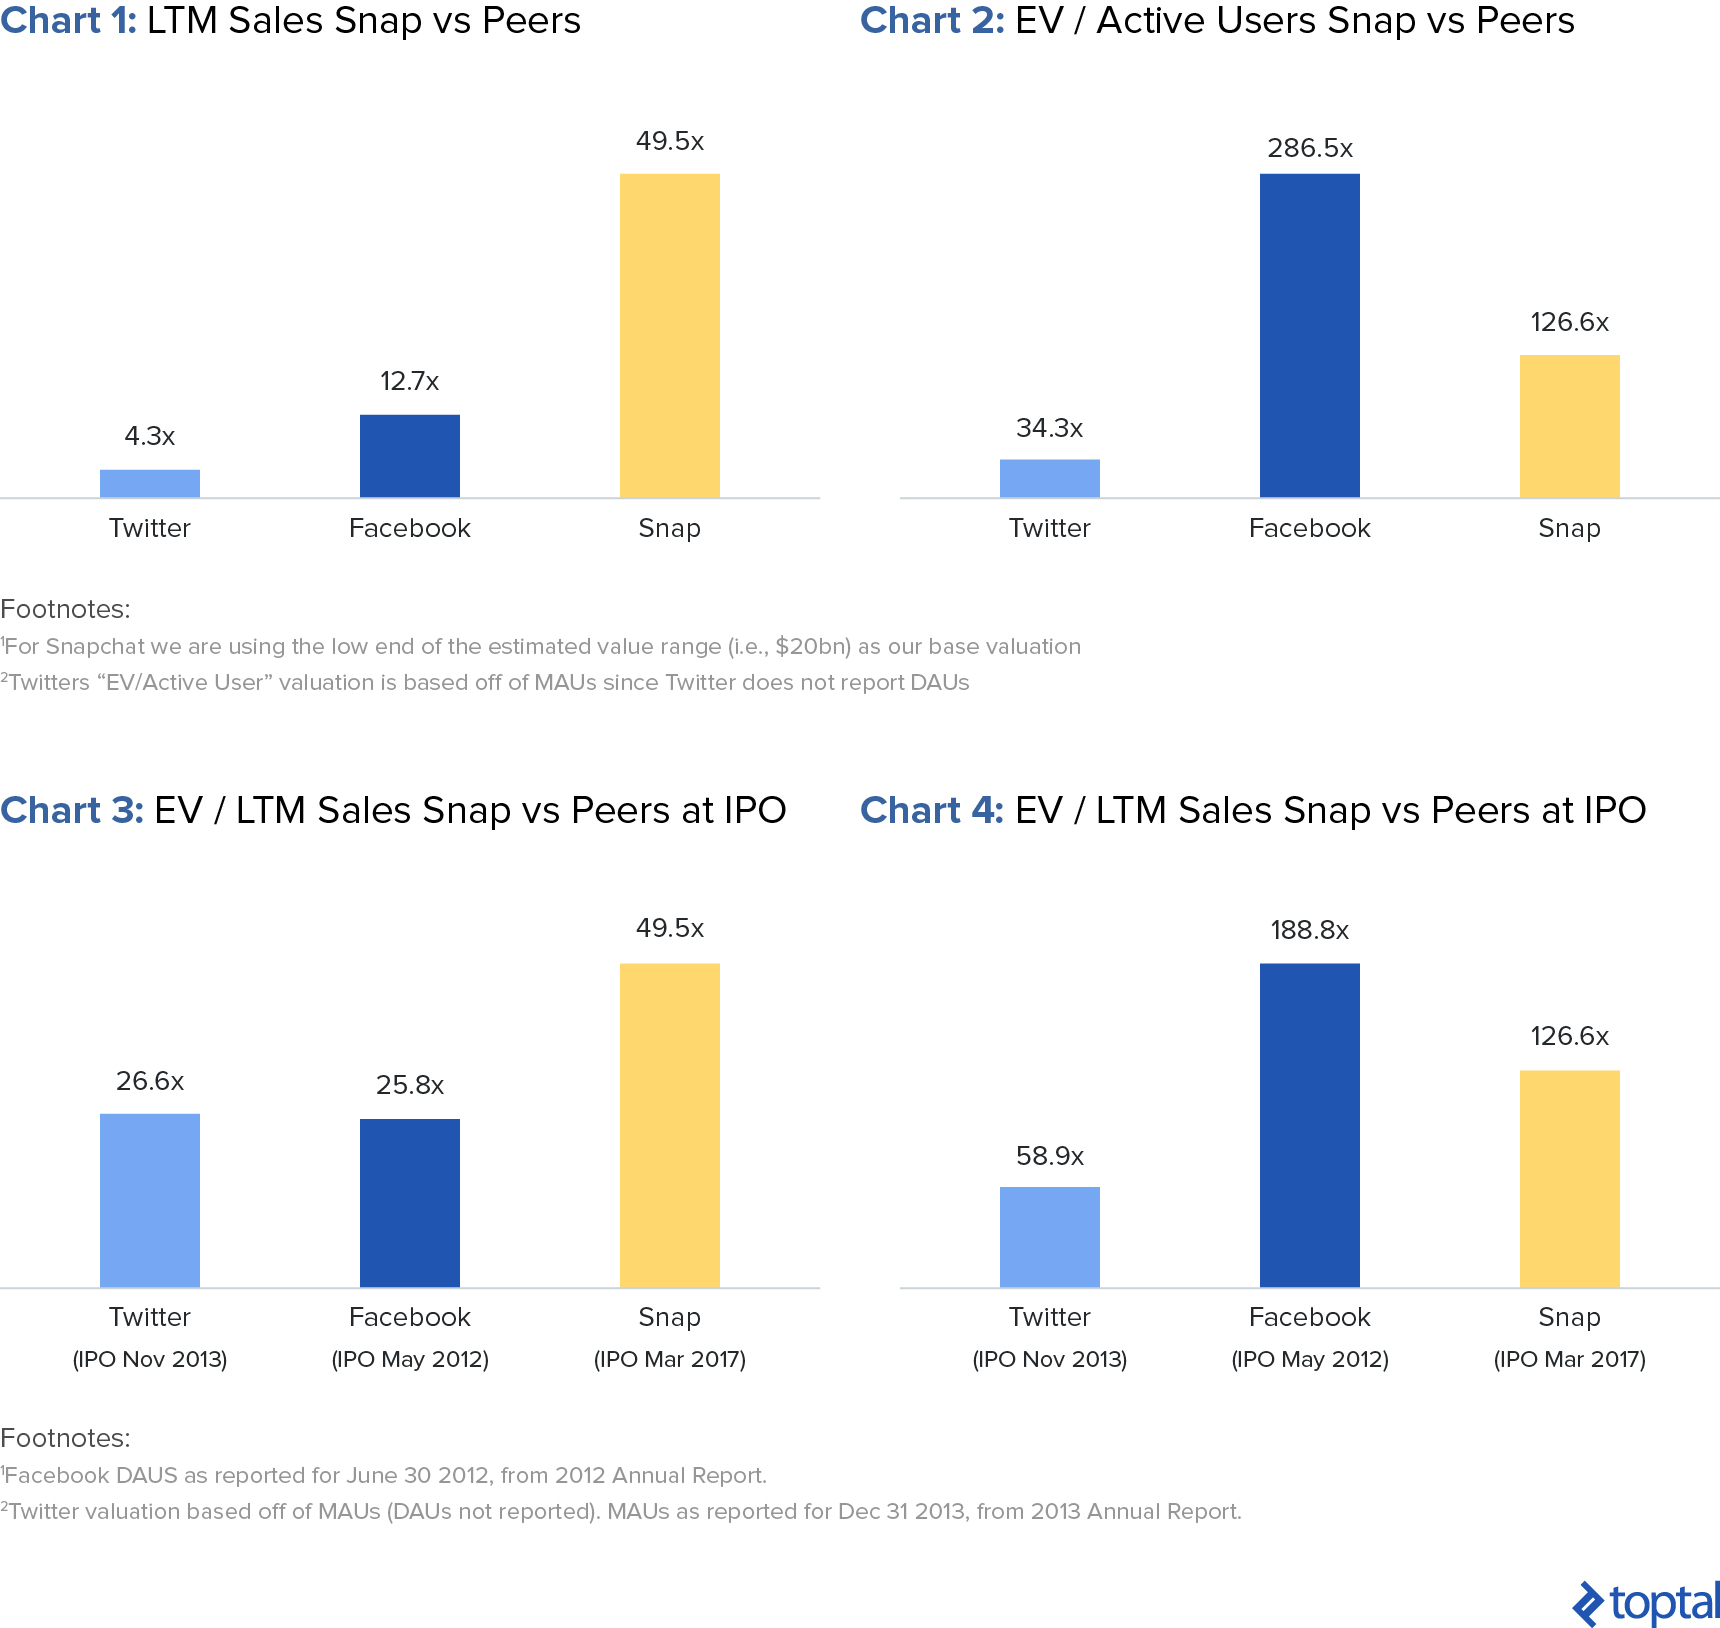
There are still timing issues with such a comparison though. For reference, Facebook was eight years old and Twitter was seven at the time of their IPOs. Snap is only five, and with 2-3 more years of growth under its belt, Snap could be a very different company.
Moreover, Snap is a direct-to-mobile platform while Facebook and Twitter went public in a world in which desktop-delivery still played a dominant role. Considering the shift from desktop to mobile, Snap is entering a market with a growing user base (mobile taking share from desktop) on a delivery platform that is capturing increasing user engagement (charts 5 and 6).
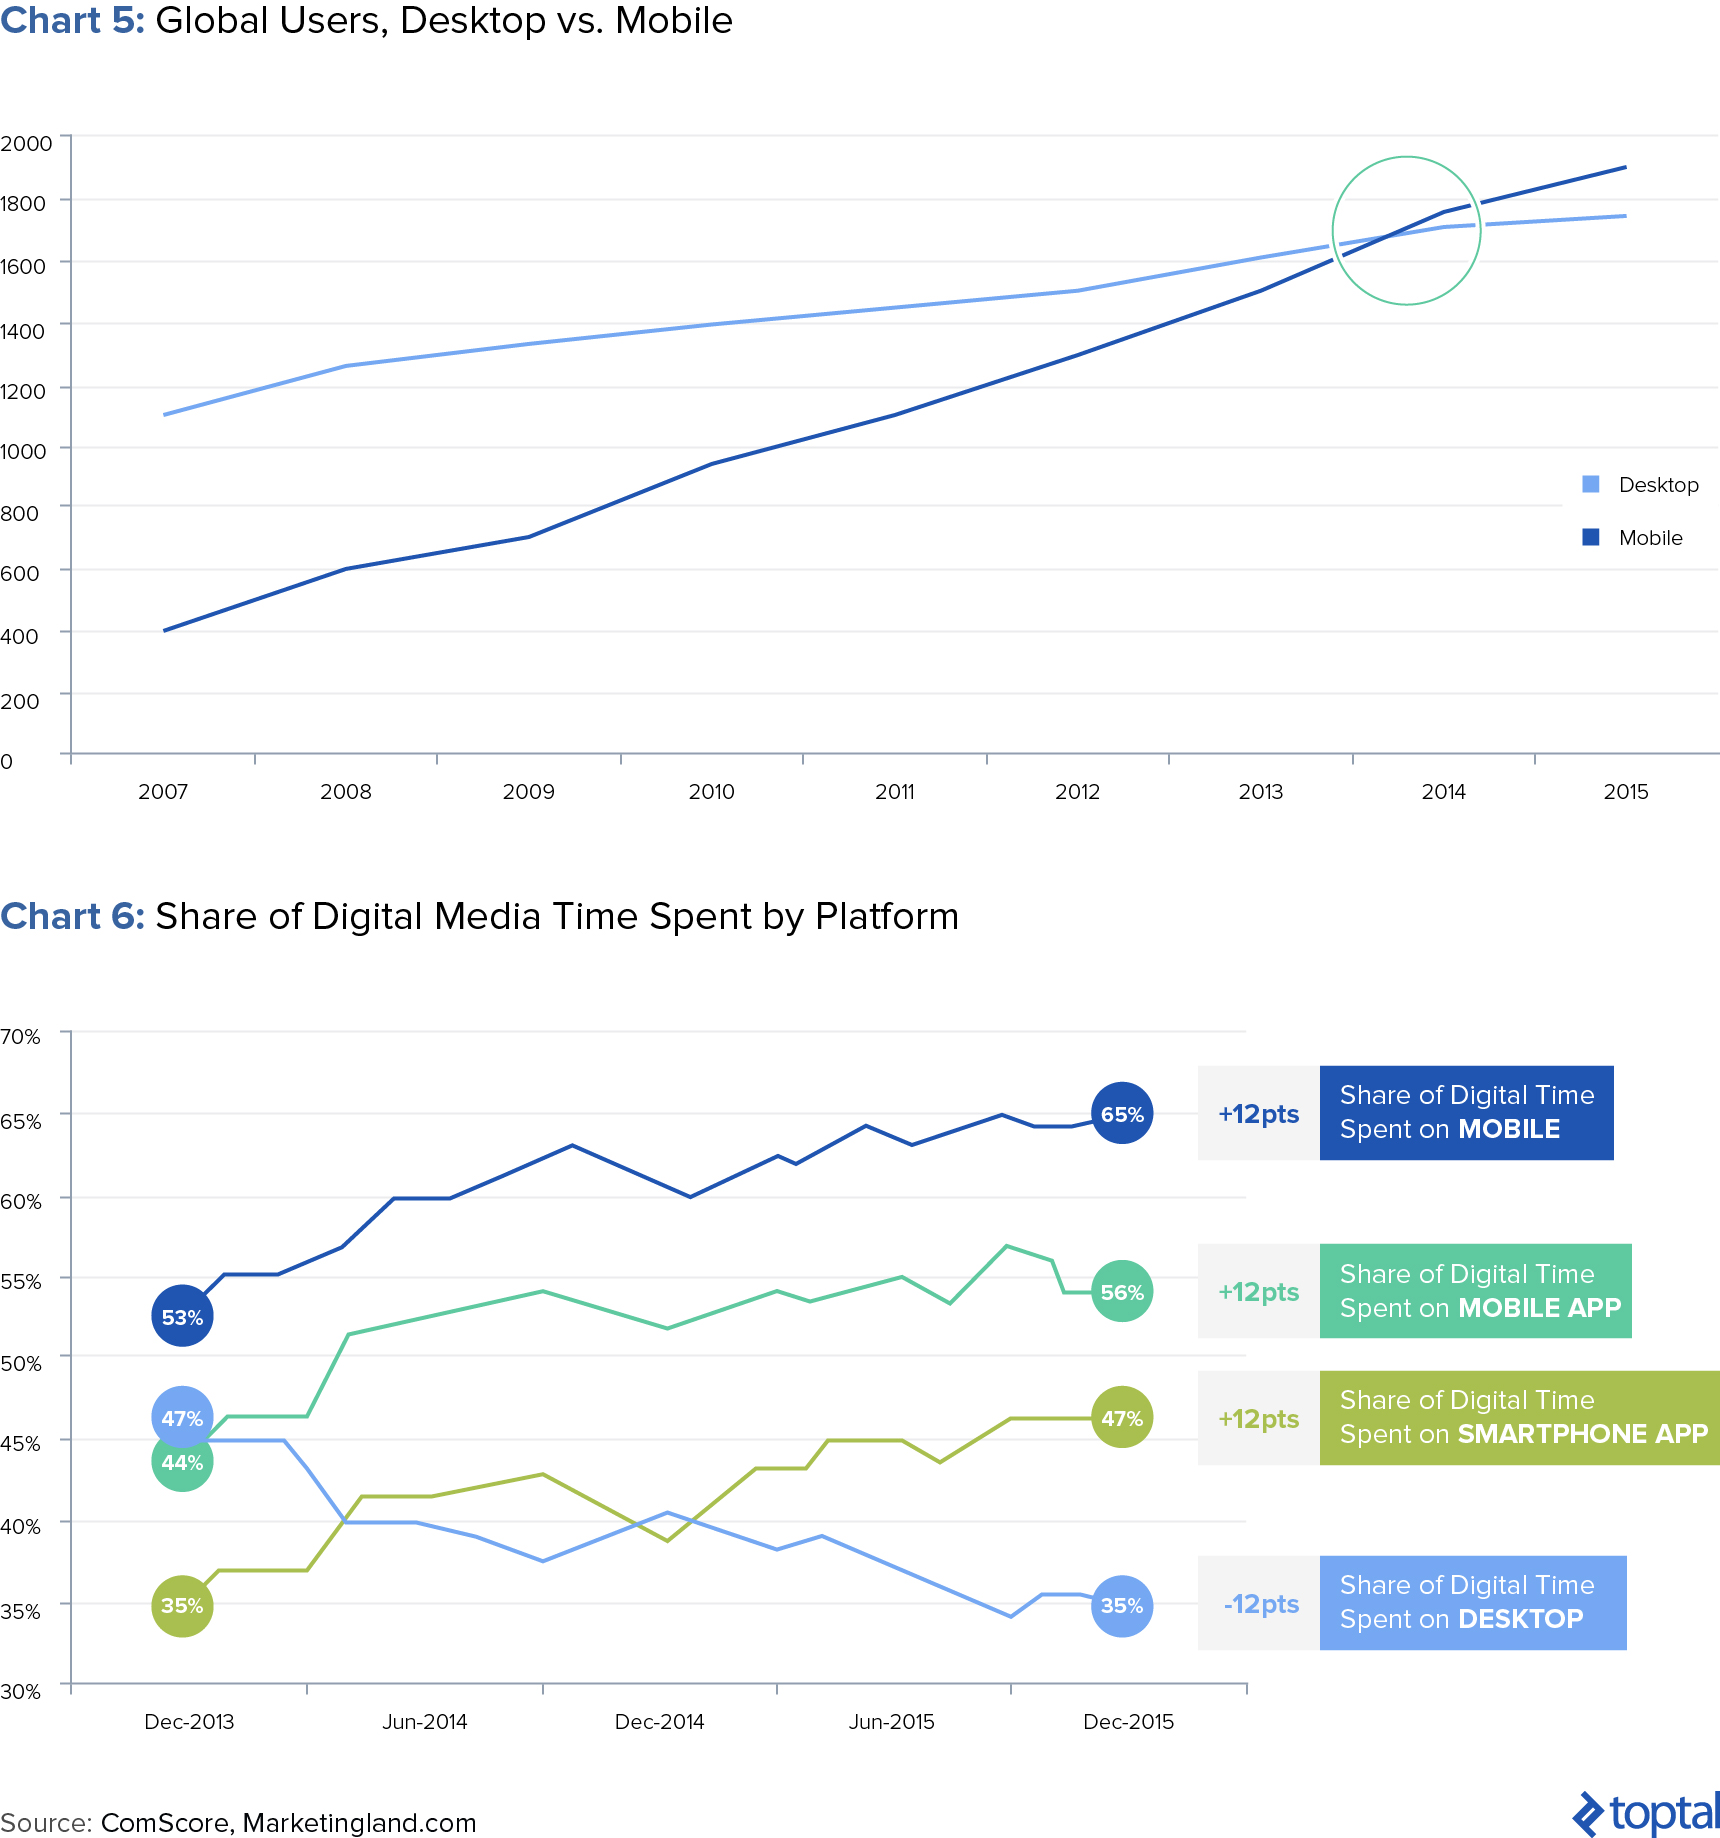
In summary, the different maturity profiles coupled with the different delivery platforms, both now as well as at IPO, make for a troublesome comparables-based approach when assessing Snap’s valuation. Snap may look expensive when compared to its peers, but comparing to its peers is not the right approach.
With the above in mind, a Snap-only analysis makes most sense. And such an analysis should almost solely be focused on one thing: growth. For any company at Snap’s stage, growth is paramount to valuation, and to this end, there are fundamentally two things that affect growth going forward:
1) Growth in Daily Active Users (DAUs), and
2) Growth in Average Revenue Per User (ARPU)
We look at these in turn.
DAU Growth: Doubts Loom
Much of the more insightful analysis which emerged a few weeks after the filing has in fact focused on DAU growth. And the hawks are out in flock. Unfortunately for Snap, whilst initial user growth performance was impressive (chart 7), there has been a significant downtick in new users joining the platform in recent months. Despite outperforming both Facebook and Twitter in terms of user growth in the six quarters leading up to its IPO, Snap saw quarterly growth rates drop from double digit figures to only 7% in Q3 16 and, even more worryingly, to a paltry 3.3% in Q4 16 (chart 8).
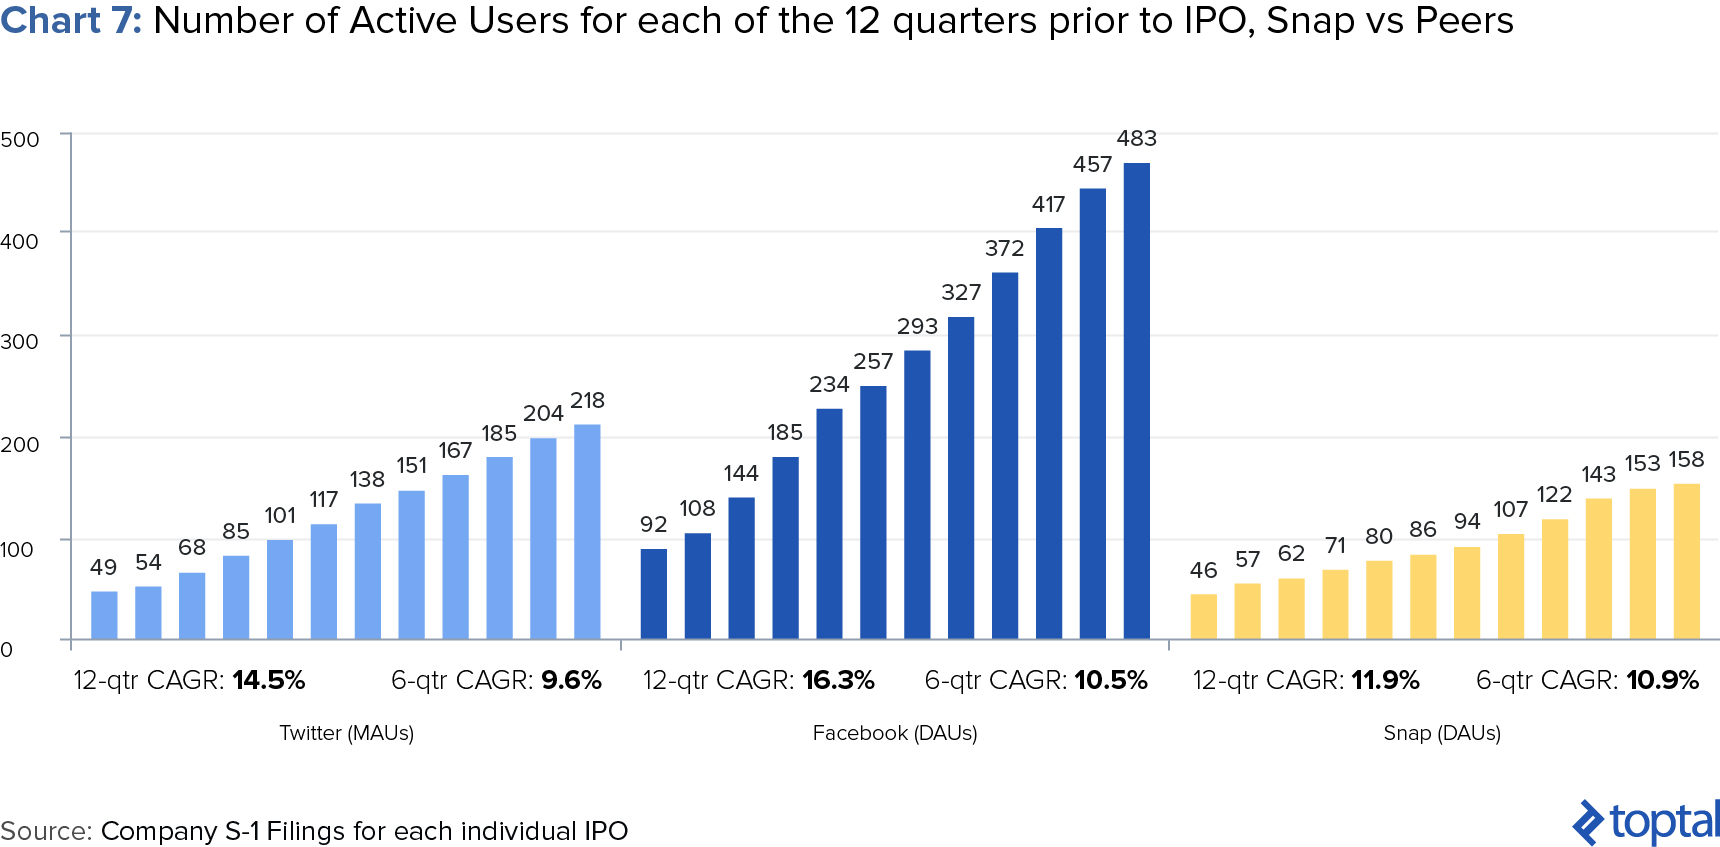
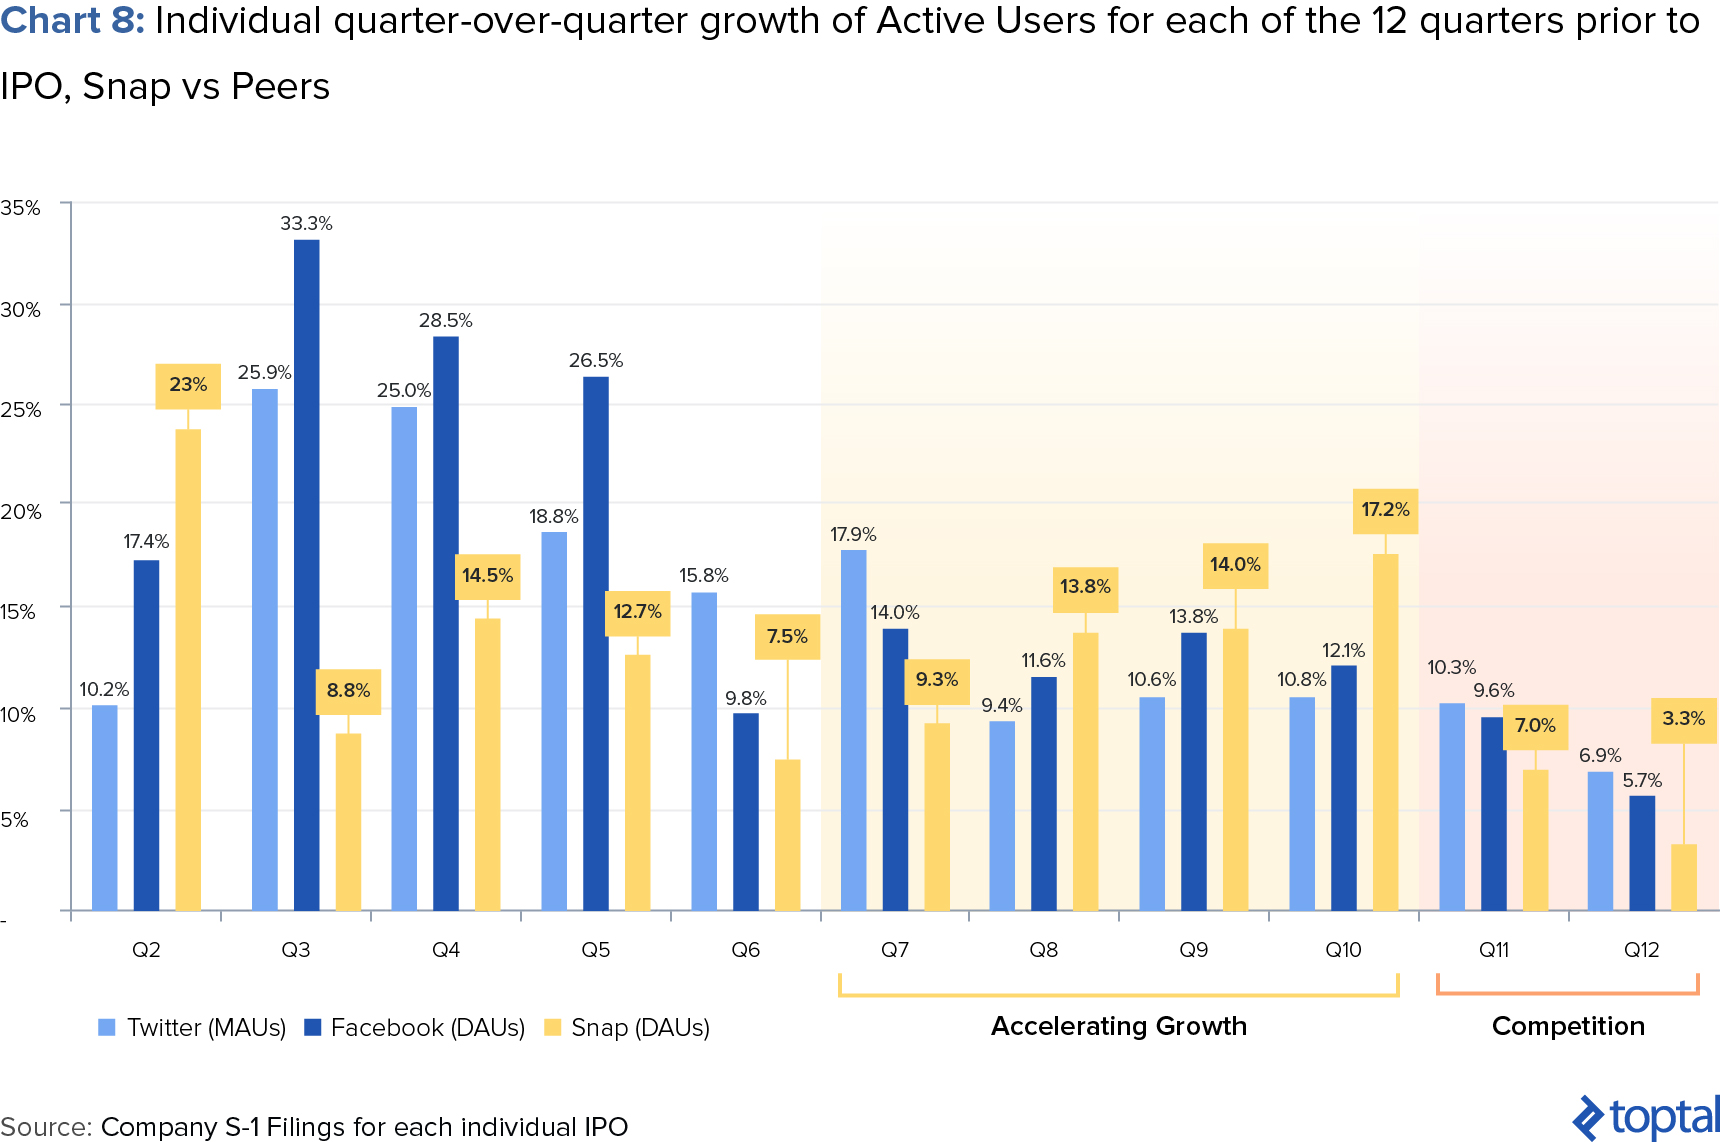
Management’s justification for the following can be found in their S1, where they state:
The rate of net additional Daily Active Users was relatively flat in the early part of the quarter ended December 31, 2016, and accelerated in the month of December. Although we have historically experienced lumpiness in the growth of our Daily Active Users, we believe that the flat growth in the early part of the quarter was primarily related to accelerated growth in user engagement earlier in the year, diminished product performance, and increased competition.
The rate of net additional Daily Active Users accelerated in the first half of 2016 compared to the second half of 2015, largely due to increased user engagement from product launches and increased adoption rates among older demographics and international markets. This created a higher baseline of Daily Active Users heading into the third and fourth quarters, so incremental net additions within these quarters were more difficult even with strong year-over-year growth. Additionally, in mid-2016, we launched several products and released multiple updates, which introduced a number of technical issues that diminished the performance of our application. We believe these performance issues resulted in a reduction in the growth of our Daily Active Users, particularly among Android users and regions with a higher percentage of Android devices. Finally, we also saw increased competition both domestically and internationally in 2016, as many of our competitors launched products with similar functionality to ours.
The above explanation thus emphasizes two key potential causes for the slowdown in growth: technical issues with their Android product, and/or increasing competition.
The former, whilst problematic, would not be a significant cause for concern. One would think that a company funded to the tune of $2.6bn and with nearly 2000 employees (many of them in Engineering) would be able to solve this and revert the company’s growth course back to what it was at the beginning of 2016.
But the more worrying concern revolves around competition. Snap faces increasing pressure from competitors, particularly Facebook and Instagram, which, if unresolved, could continue to limit DAU growth going forward. In fact, it is no wonder that Snapchat’s growth numbers began suffering in Q3 16, as this was exactly when Instagram launched Stories, a near-blatant copy of Snapchat’s namesake.
Unfortunately for Snap, data regarding growth in DAU by geography only lends further weight to the competition concerns. In fact, on a geographical basis, much of the slowdown in Snap’s DAUs appears to have been primarily in the “Rest of World” region (chart 9). Given Instagram’s significantly larger user base abroad (80% of Instagram’s c.300m DAUs are international), one could see how the incentives for installing Snapchat diminishes as Instagram (and other competitors) begin to offer the key features that Snapchat has to-date sold itself on.
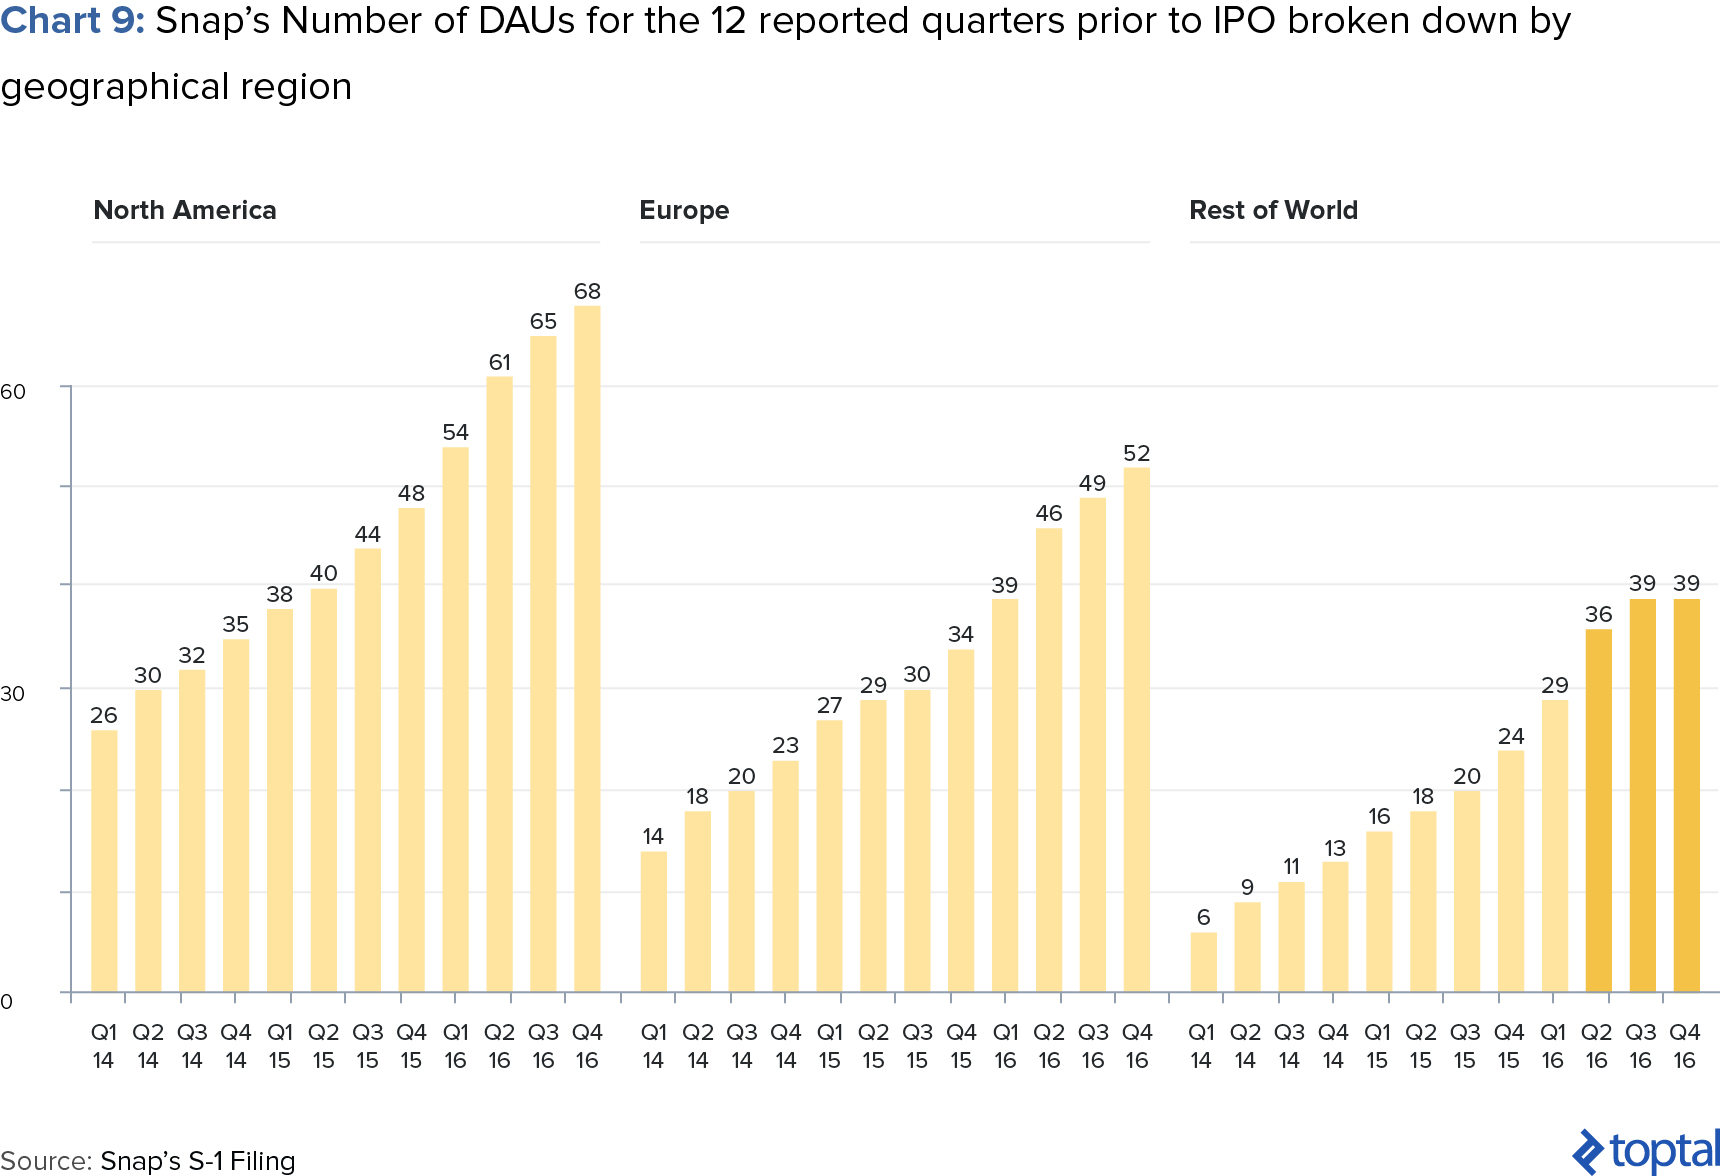
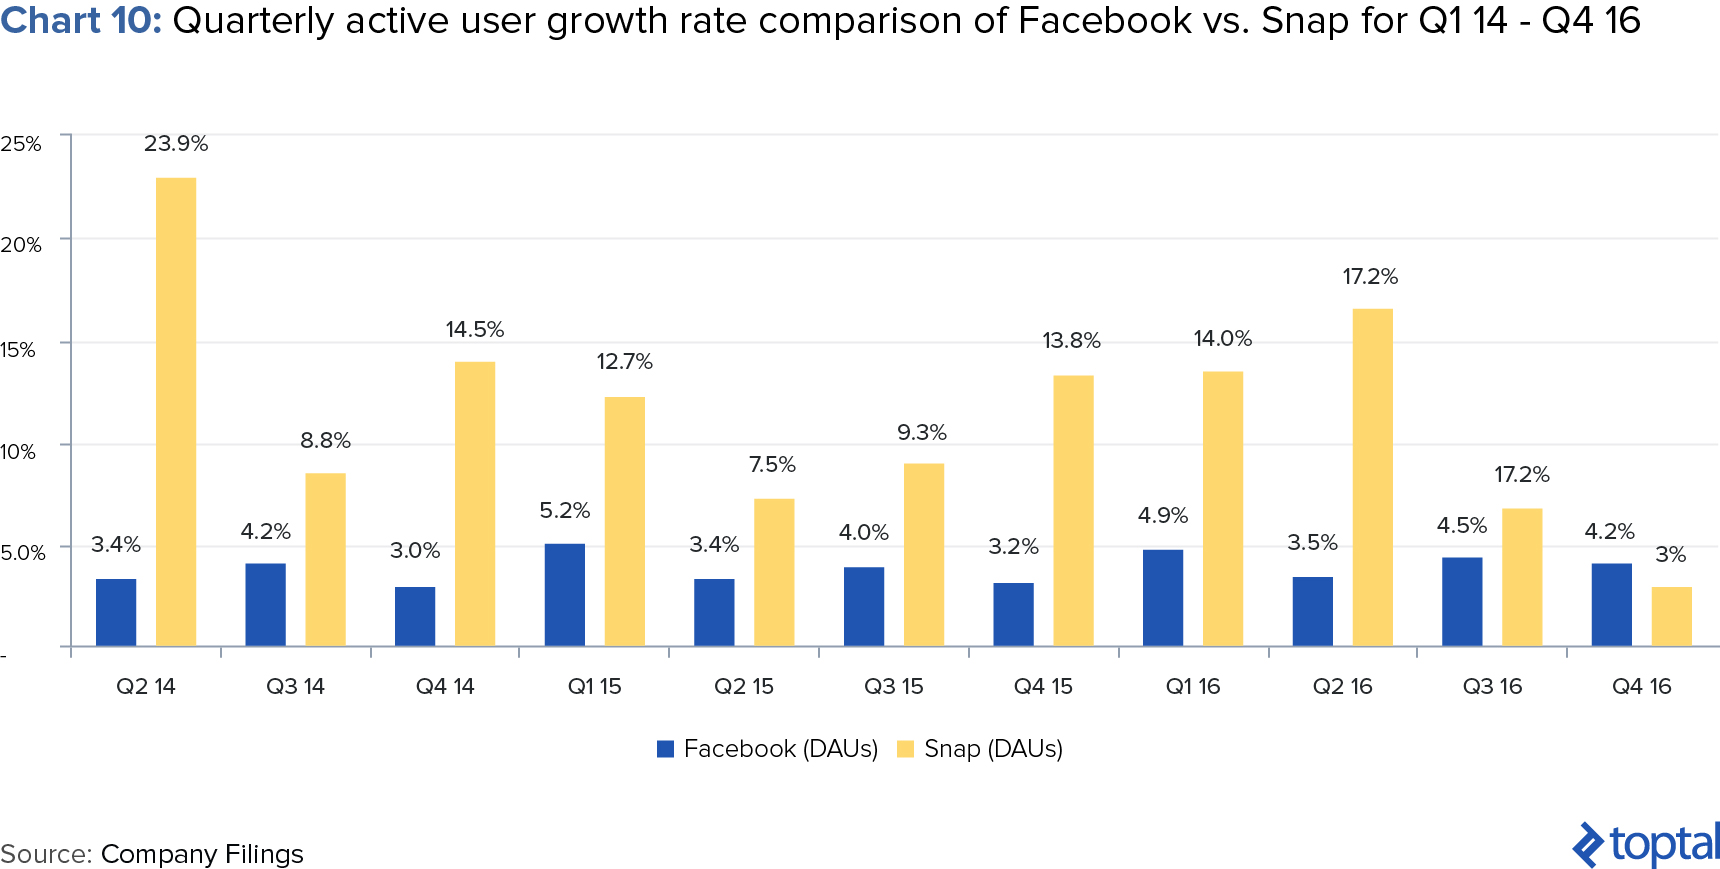
To summarize, things don’t look good for Snapchat from a DAU growth perspective. Not only was Q4 16 Snap’s lowest growing quarter since the beginning of its publicly available data, but it was even slower than that of Facebook, a far more mature company (chart 10). Given these headwinds, Snap will have to effectively convince investors that it can address its decelerating quarter-over-quarter DAU growth if it wishes to hit the valuation numbers that have been publicized.
Looking Ahead: Facebook Growth or Twitter Struggles?
With the above in mind, our expectation is that Snap, going forward, will experience a user growth profile more akin to Twitter’s than to Facebook’s. Whilst growth will be sustained by its continued popularity in the United States, competition from Facebook, Instagram, and other international competitors will continue to limit Snap’s growth internationally.
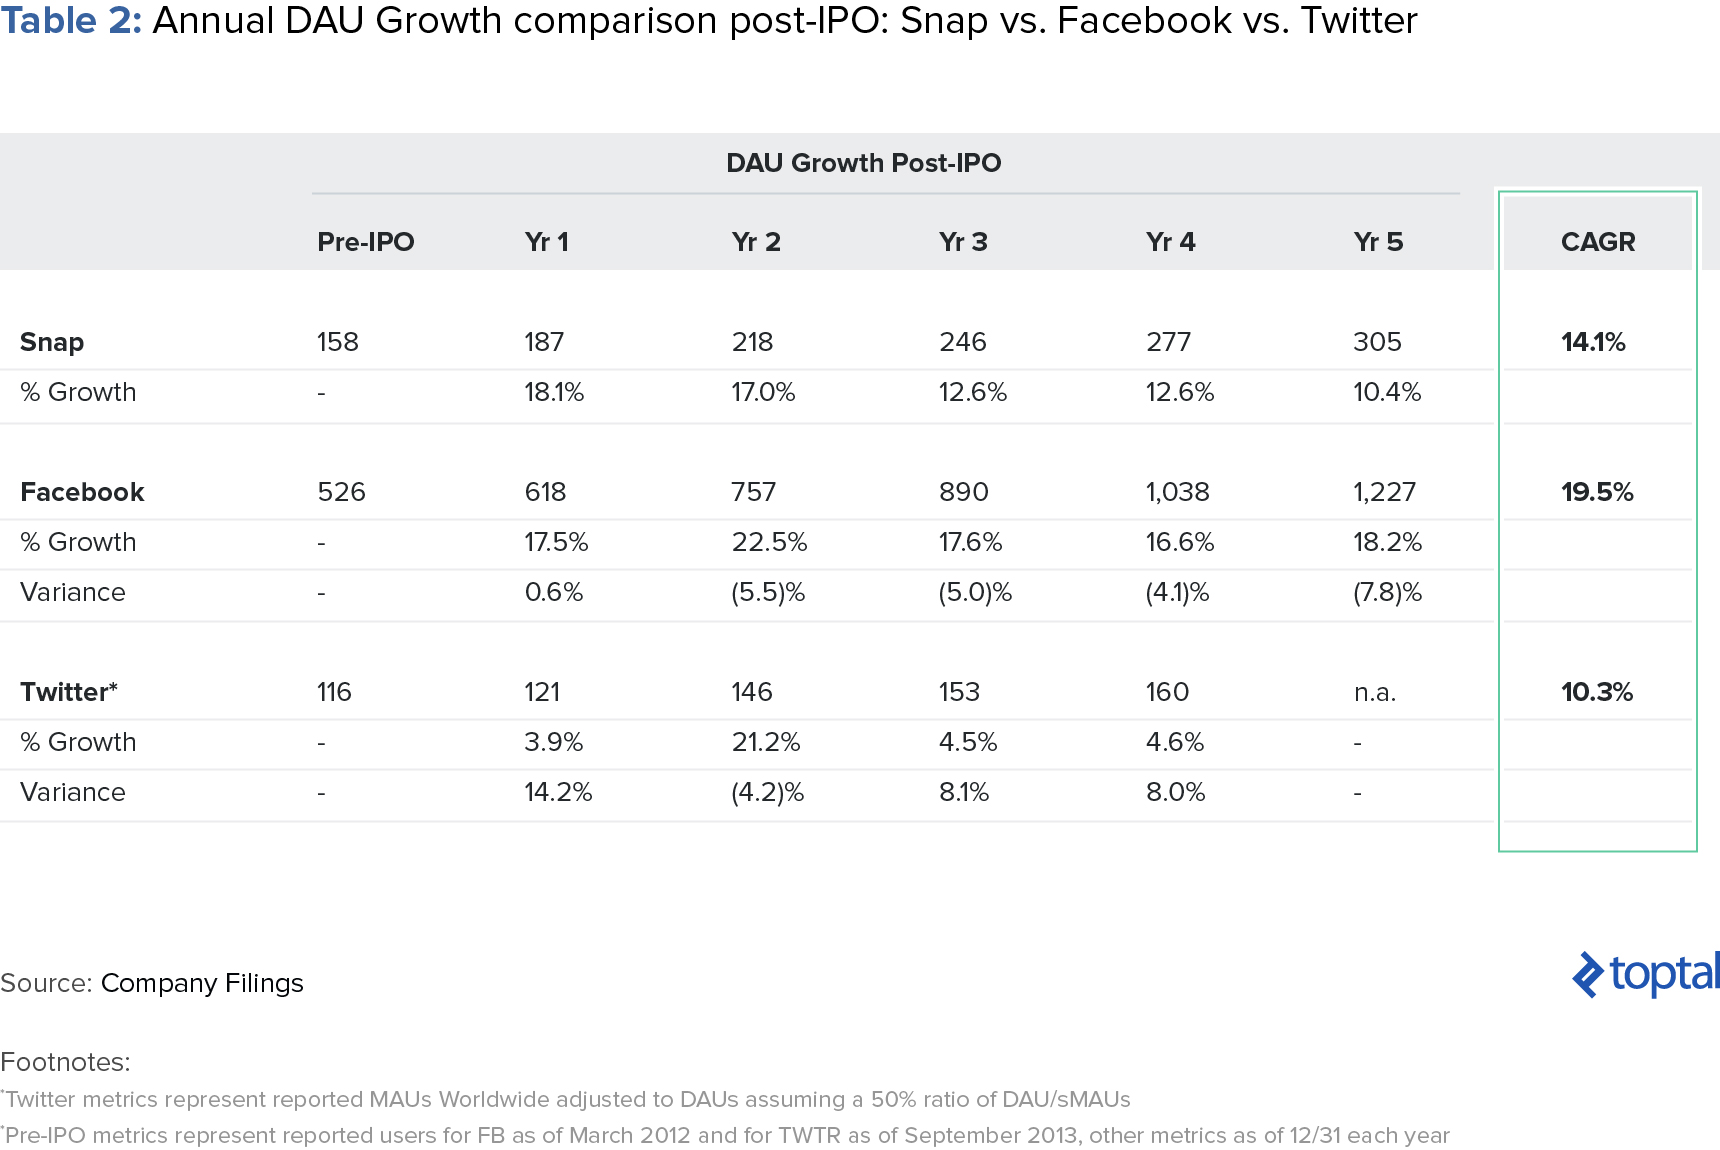
Our base case expectation is therefore for an average of 14.1% growth per year post-IPO, almost right in between Facebook’s and Twitter’s annual average growth rates of 19.1% and 10.3%, respectively (table 2). The primary source of the growth premium to Twitter derives from Snapchat’s ability to innovate on product features better than Twitter (more on this below).
ARPU Growth: Solid Start with Ample Upside Remaining
Whilst the above DAU estimates are nothing for investors to get excited about, and fall largely in line with most market commentary, stopping one’s analysis at DAU performance is shortsighted. In particular, it misses the key other side of the coin: ARPU. And when it comes to ARPU growth, we see a radically different story. Our view is that Snapchat will see strong ARPU growth going forward, driven by the following factors:
- A more monetization-friendly product
- A more advantageous position with a key user demographic
- A generally more monetization-focused management mindset
All of these will in turn be boosted by general underlying strength in the mobile advertising space. We look at these in turn.
Snapchat is a very monetization-friendly product
One of the most attractive features of Snapchat from an ARPU standpoint is that the product itself appears to lend itself very well, arguably better than its competitors, to monetization. The effectiveness of the platform is largely driven by Snap’s ability to innovate on product features and stay ahead of the competition, and has allowed Snap to build impressively strong positions in image sharing and in video.
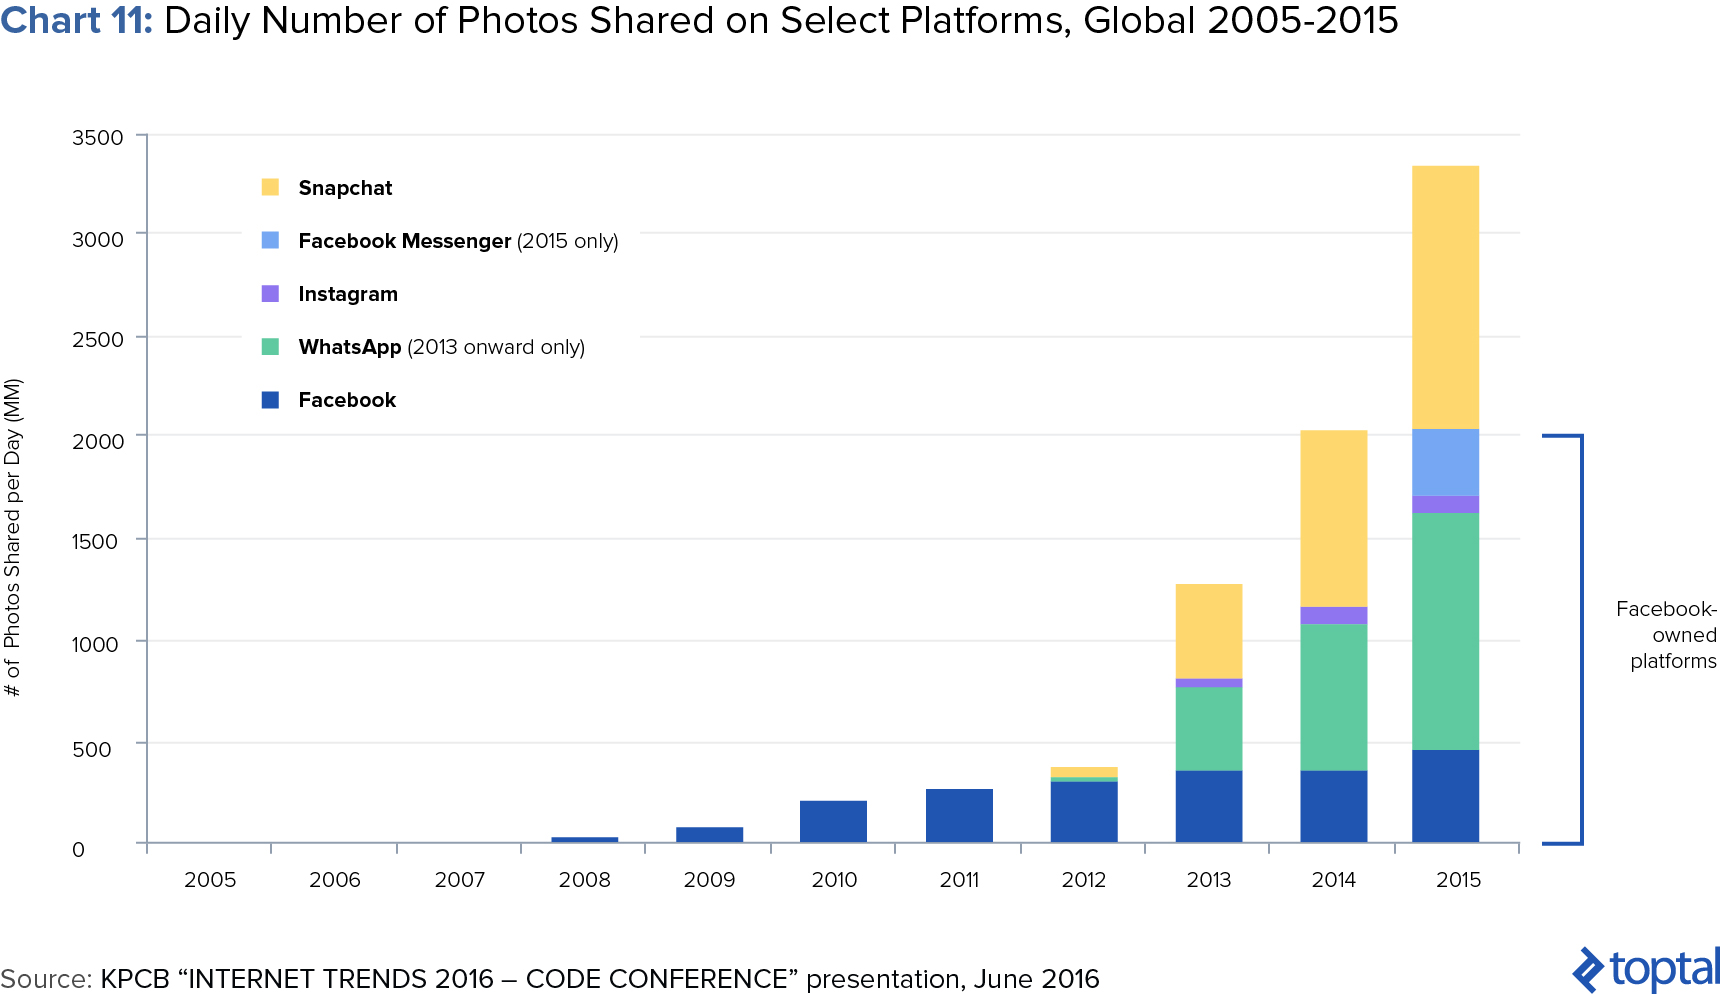
Looking first at image sharing, Snap has caught up rapidly with its competitors (chart 11) largely thanks to its ability to innovate with the format (initially with disappearing messages, later with filters, Stories, etc.). The implication of this is significant in that it has allowed Snap to lead the industry in terms of developing and delivering sponsored / branded content for this type of format. For instance, focusing on sponsored filters, Snap’s ability to reach a large audience far exceeds Facebook despite its significantly smaller user base (chart 12).

The growth in image sharing and the innovation surrounding its product features has positioned Snap favourably amongst advertisers, allowing Snap to strike important partnerships with very significant brands worldwide. One of the examples of such campaigns that Snap highlights in its S1 relates to how Wendy’s blanketed its U.S. stores with Sponsored Geofilters that promoted the Jalapeño Fresco Chicken Sandwich. Snap’s measurement tool reported that the Sponsored Geofilter drove over 42,000 incremental people to a Wendy’s location within seven days of viewing the Sponsored Geofilter.
Perhaps more important than image sharing, Snap has developed a dominant position in video, converting it into a serious threat to Facebook. According to the KCPB presentation, as of Q1 16 Snap has surpassed Facebook in terms of daily video views despite its significantly smaller user base (chart 13).

This success to date has been been driven by Snap’s unique approach to the video format. KCPB refers to Snaps approach as “3V Advertising”: (1) Vertical - made for mobile viewing, (2) Video - a great way to tell a story, (3) Viewing - always full screen.
The combination of these three has made video advertising that much more effective on Snapchat. In fact, according to the KCPB presentation, outside of Snapchat many video ads are ineffective with 81% of people muting the ads. However, Snap points out in its S-1 that on average, 60% of all Snap Ads are watched with the sound on.
The above again points to Snap’s effectiveness as a monetization platform, as well as the management team’s ability to keep innovating on product and stay ahead of the curve when it comes to marrying fun and engaging product features with monetization avenues. A recent example of success with video would Gatorade’s sponsored lens during the Super Bowl, a campaign which led to 60 million plays in total, 165 million views and an increase of 8 points in purchase intent.

Snap has developed the ultimate trifecta - a robust advertising platform that combines communications (chatting), image creation and sharing, and video content. This has lead to numerous marketing campaigns achieving above average industry impact, performance, and ROI. This should support rapid growth of ARPU as more marketers recognize these benefits and decide to move advertising dollars over to Snap.
Snap is very strong with a key user demographic
As the pool of mobile advertising investment dollars rises, more advertisers are looking to target Millennials and younger demographics. In 2015, Marketers dedicated over a third (34%) of their annual marketing budgets to targeting these groups. That figure was likely even greater with teens and “tweens” included.
The above phenomenon is largely because Millennials are expected to drive consumer spending in the years to come. Millennials are 80 million strong, the largest demographic in the United States, and as of March 2015, also the largest demographic in the workforce.
This of course translates into huge spending power. Estimates indicate Millennials could be spending $1.4 trillion annually by 2020 and could inherit as much as $30 billion in the coming years. Even teens and tweens are generating significant spending power, spending as much as Baby Boomers in 2015.
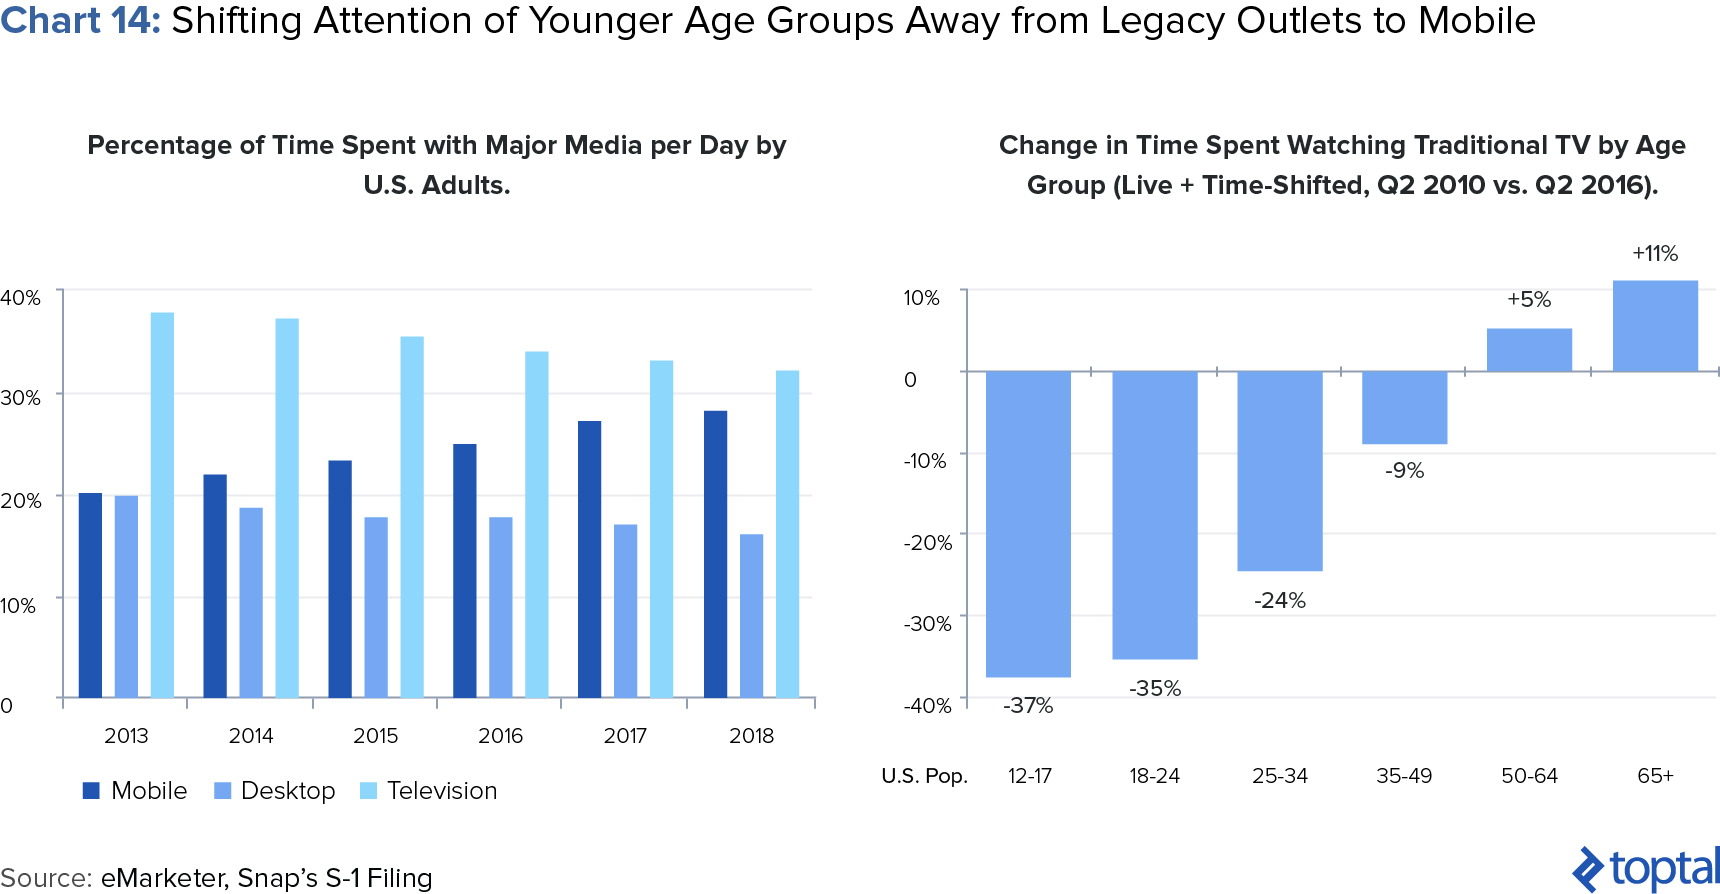
The issue advertisers face is that Millennials are moving away from traditional advertising channels to their phones (chart 14). Companies like Snap, as well as its competitors, provide an optimal channel through which to target these groups.
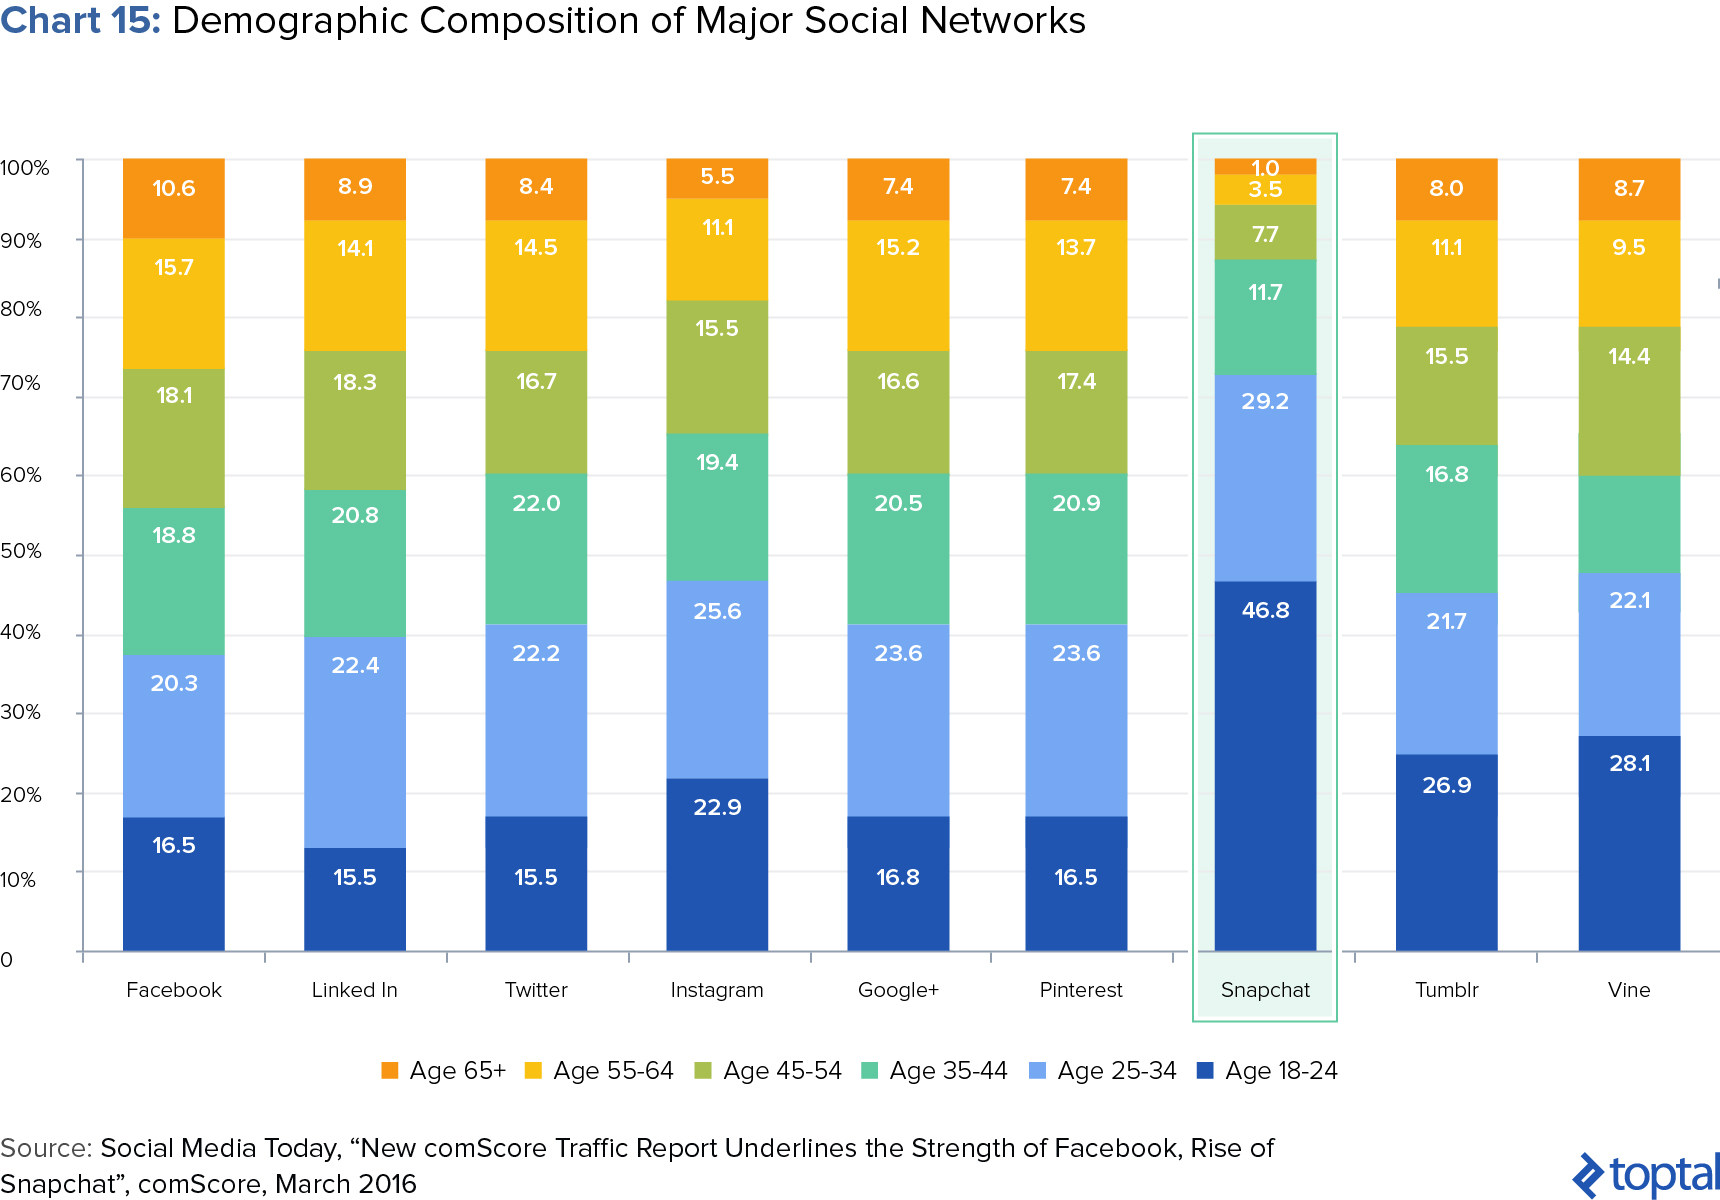
Fortunately for Snap, they seem to have developed a very strong position in these age-groups. With 63% of Snap users in the 18-34 age category, and 22% between 13-17 years of age, Snap has captured the attention of a highly coveted marketing demographic (chart 15; note: chart is from a 2016 comScore report, as such the data does not perfectly tie with Snap’s latest demographics reported in its S-1).
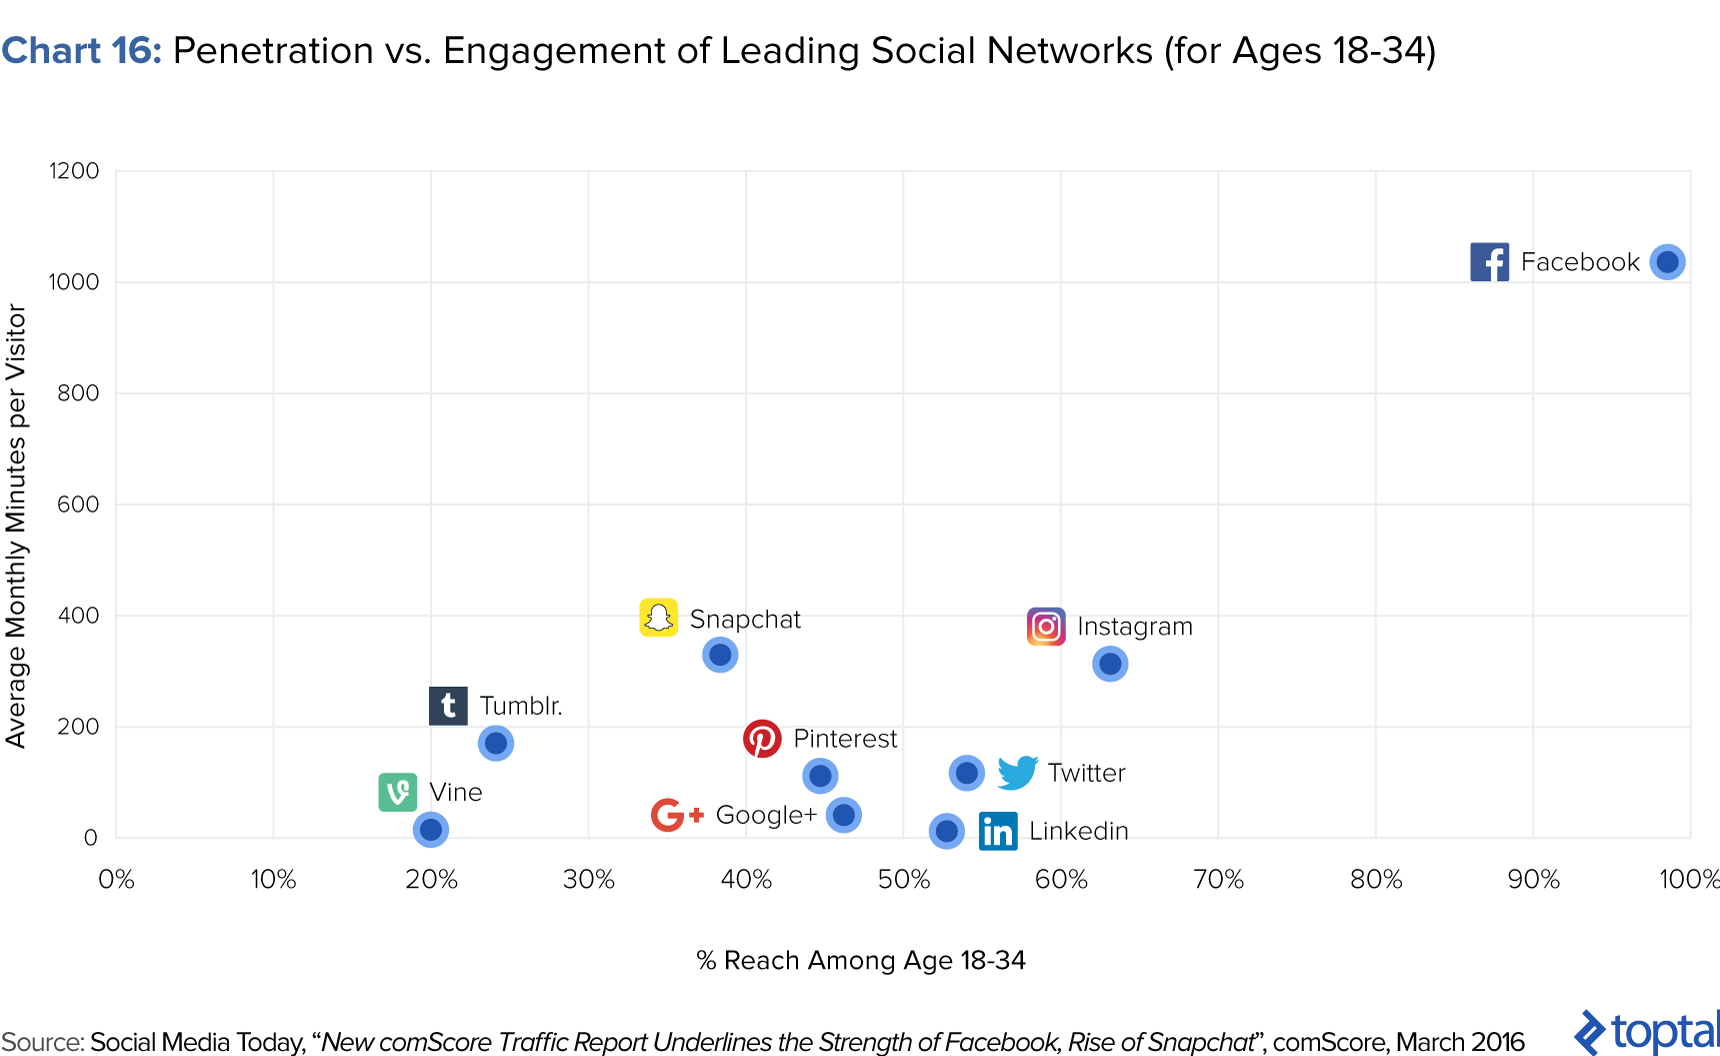
More importantly, Snap has become a leading platform in terms of its engagement within 18-34 age demographic (chart 16). Facebook is clearly a dominant player with massive reach and significant engagement, but Snapchat is the second leading platform in terms of average monthly minutes per visitor. As Snap continues to expand its reach and further penetrate this key age group, Snap should move higher and further to the right on this chart as it continues to threaten Facebook’s leadership.
This all bodes very well for Snap. The company has continued to rapidly expand its reach within the 18-24 category while also broadening its penetration within older age groups. As of December 2015, according to comScore, more than three-out-of-five 18-24 year olds now actively use Snapchat, with older age groups also on the rise (chart 17).
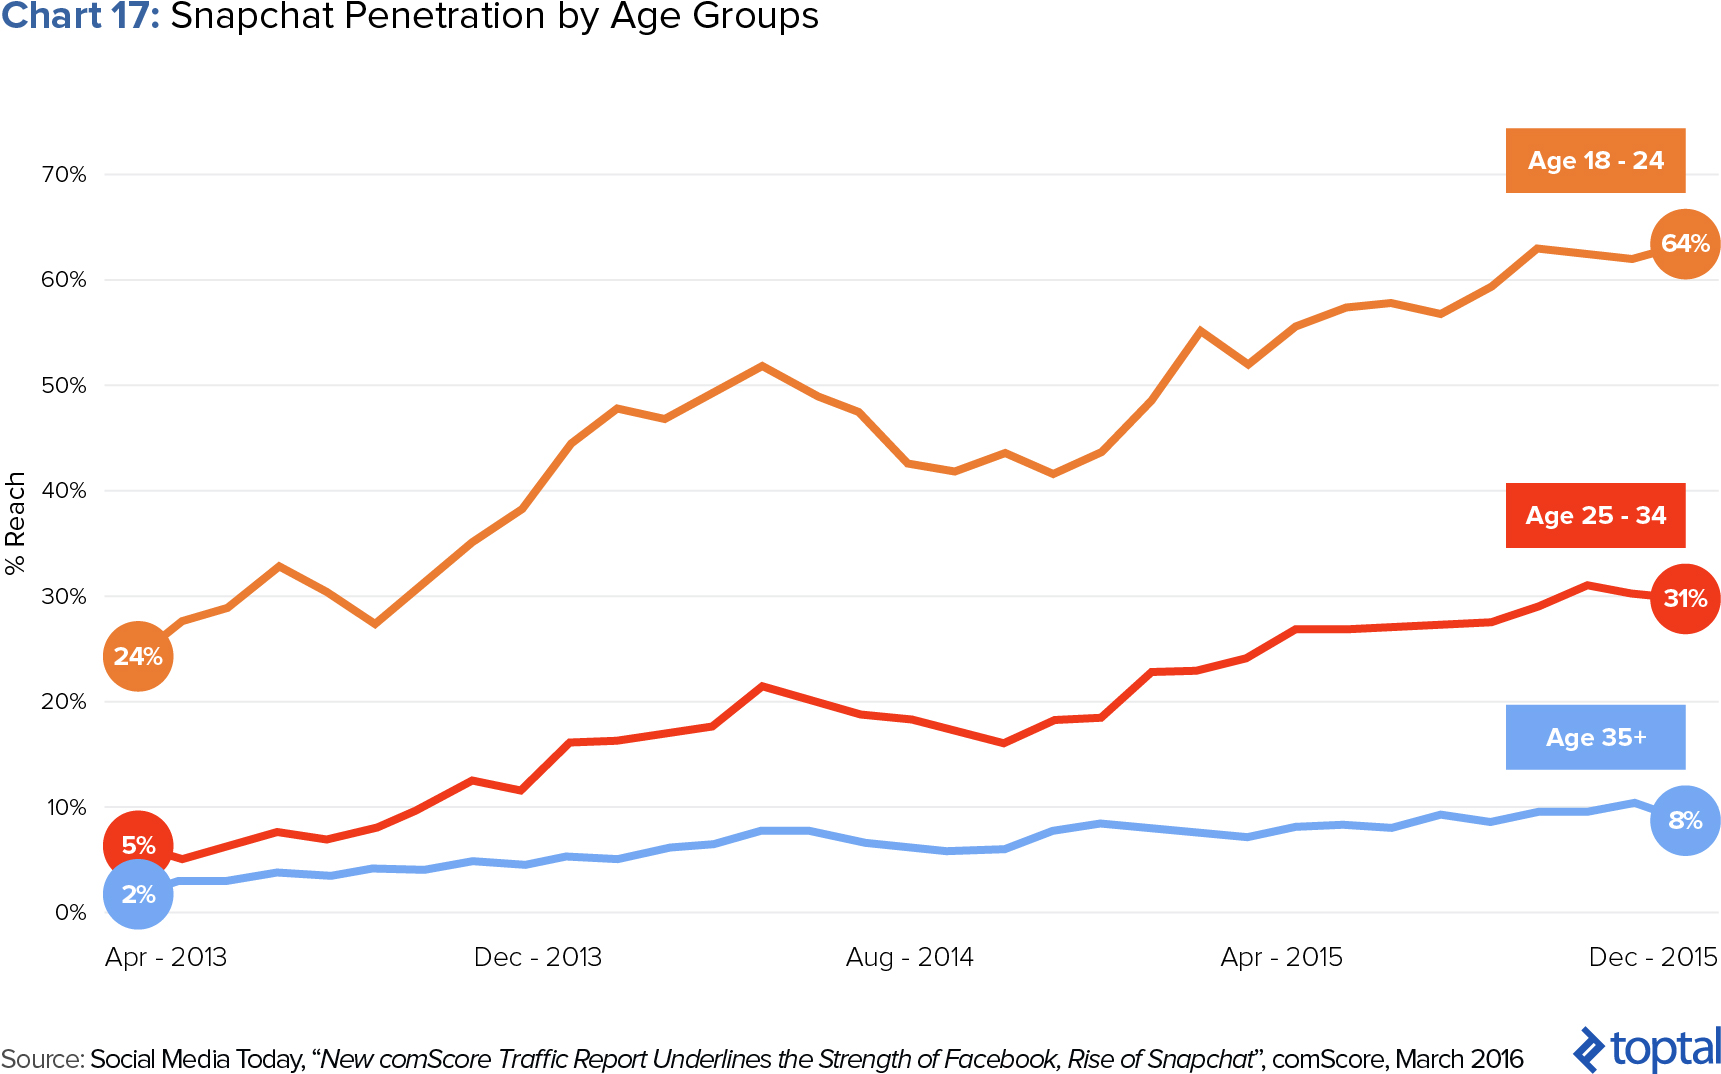
With a dominance in the Millennial, Teen, and Tween demographics, the second leading platform in terms of monthly engagement, and further expansion of its reach within each of those key demographics Snap should receive an outsized portion of advertising dollars going forward. This should support rapid ARPU expansion in the coming years.
Snap management is more monetization focused
Putting the above two tactical points aside, the most encouraging thing about Snap is that management has consistently shown a greater predisposition and knack for converting fun new product features into monetization avenues. In short: Snap management appears to be excellent at monetization.
And the results bear this out. When comparing to Facebook and Twitter, Snap started monetizing earlier, and has grown faster in terms of ARPU than both of its comparables,despite being several years “younger” as a company (charts 18 and 19).
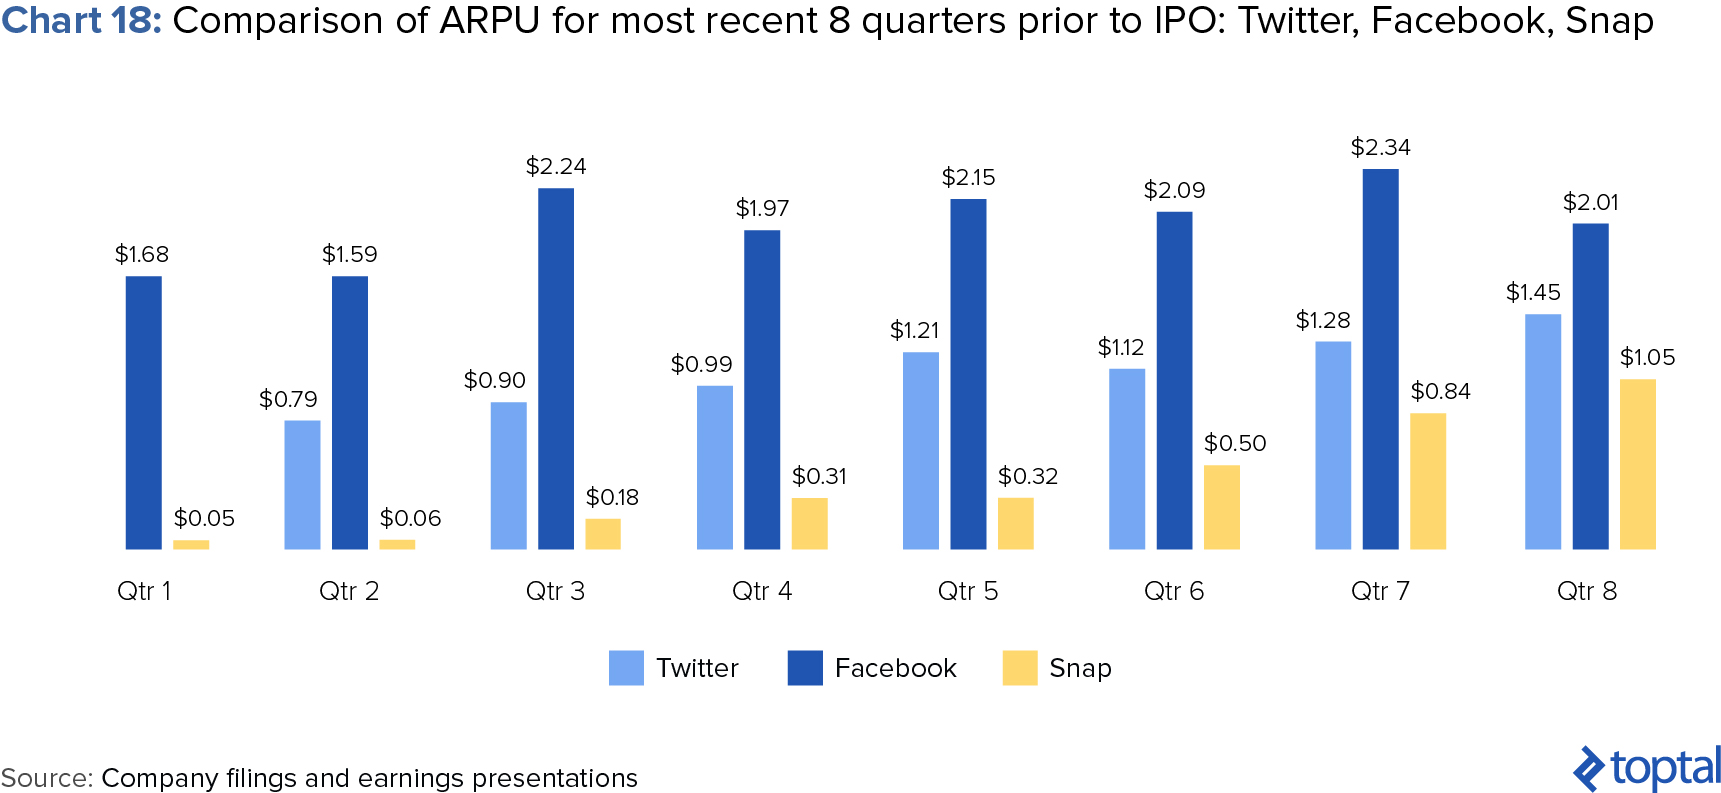
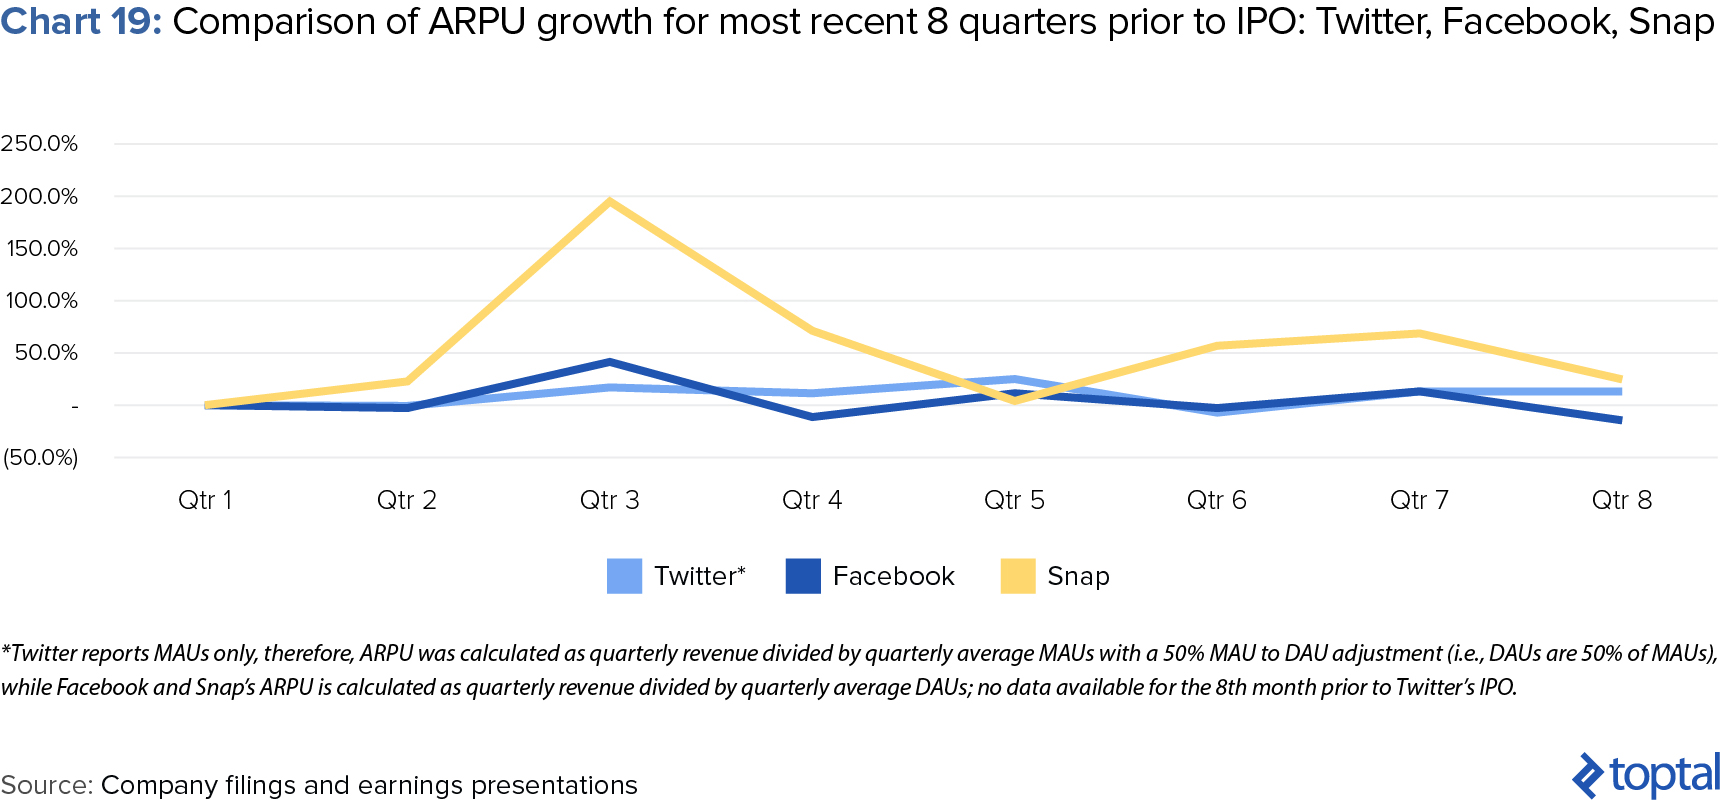
Admittedly, claiming that Snap is simply better at monetizing than its comps is a subjective and difficult-to-prove assertion. However, if you believe this, then what makes this an even more interesting point is when you consider how much upside could still be left for Snap to capture. To this end, a simple side-by-side comparison of ARPU numbers with Facebook and Twitter suggests that Snap’s ARPU could rise as much as 7x what it is today (chart 20).
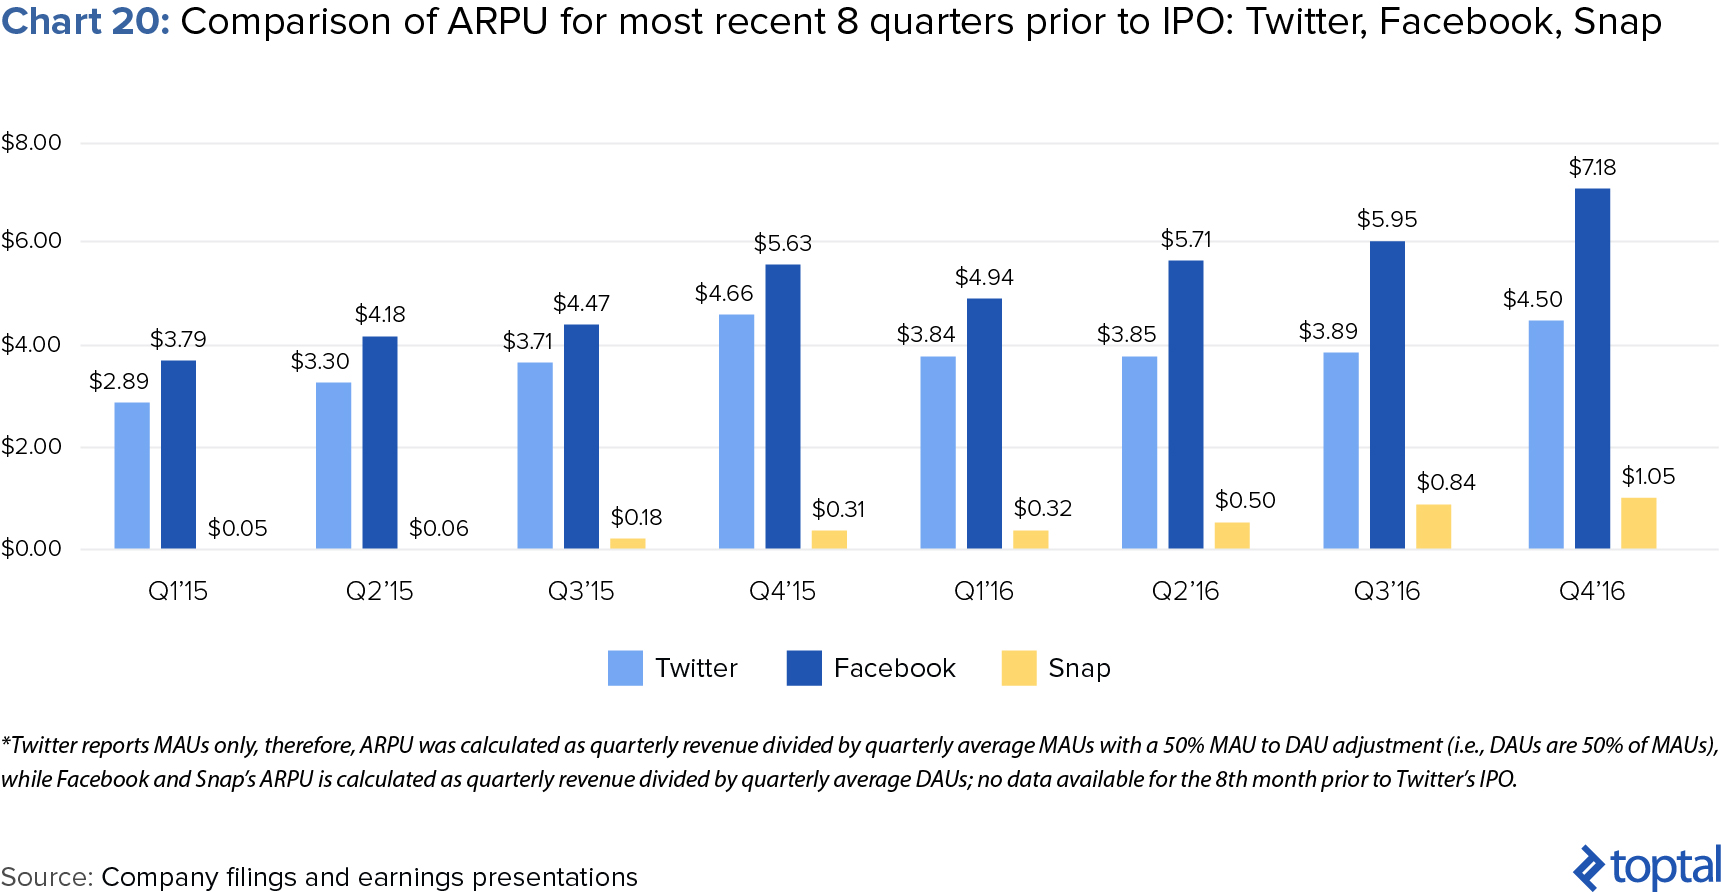
For us, Snap’s impressive historical performance in ARPU driven by its clear ability to innovate in product and monetization, combined with the tremendous upside still there for the taking, points to strong and rapid catch-up in terms of ARPU in the years to come. It is therefore not surprising to us that after having failed to acquire Snapchat, Facebook has now reverted to replicating its features consistently.
Overall Industry Growth will keep supporting Snap ARPU Growth
Aside from the intrinsic strengths of Snap as a company, it’s also obvious that overall underlying industry strength will help sustain ARPU growth in the coming years (although the extent to which this will be remains a question).
According to a report from IDC, ad spending is expected to grow from $652 billion in 2016 to $767 billion in 2020 with mobile specific spending growing 3x from $66 billion in 2016 to $196 billion in 2020. Social media marketing in particular is expected to grow 20% per year to $50.2bn in 2019, comfortably overtaking newspaper advertising by 2020.
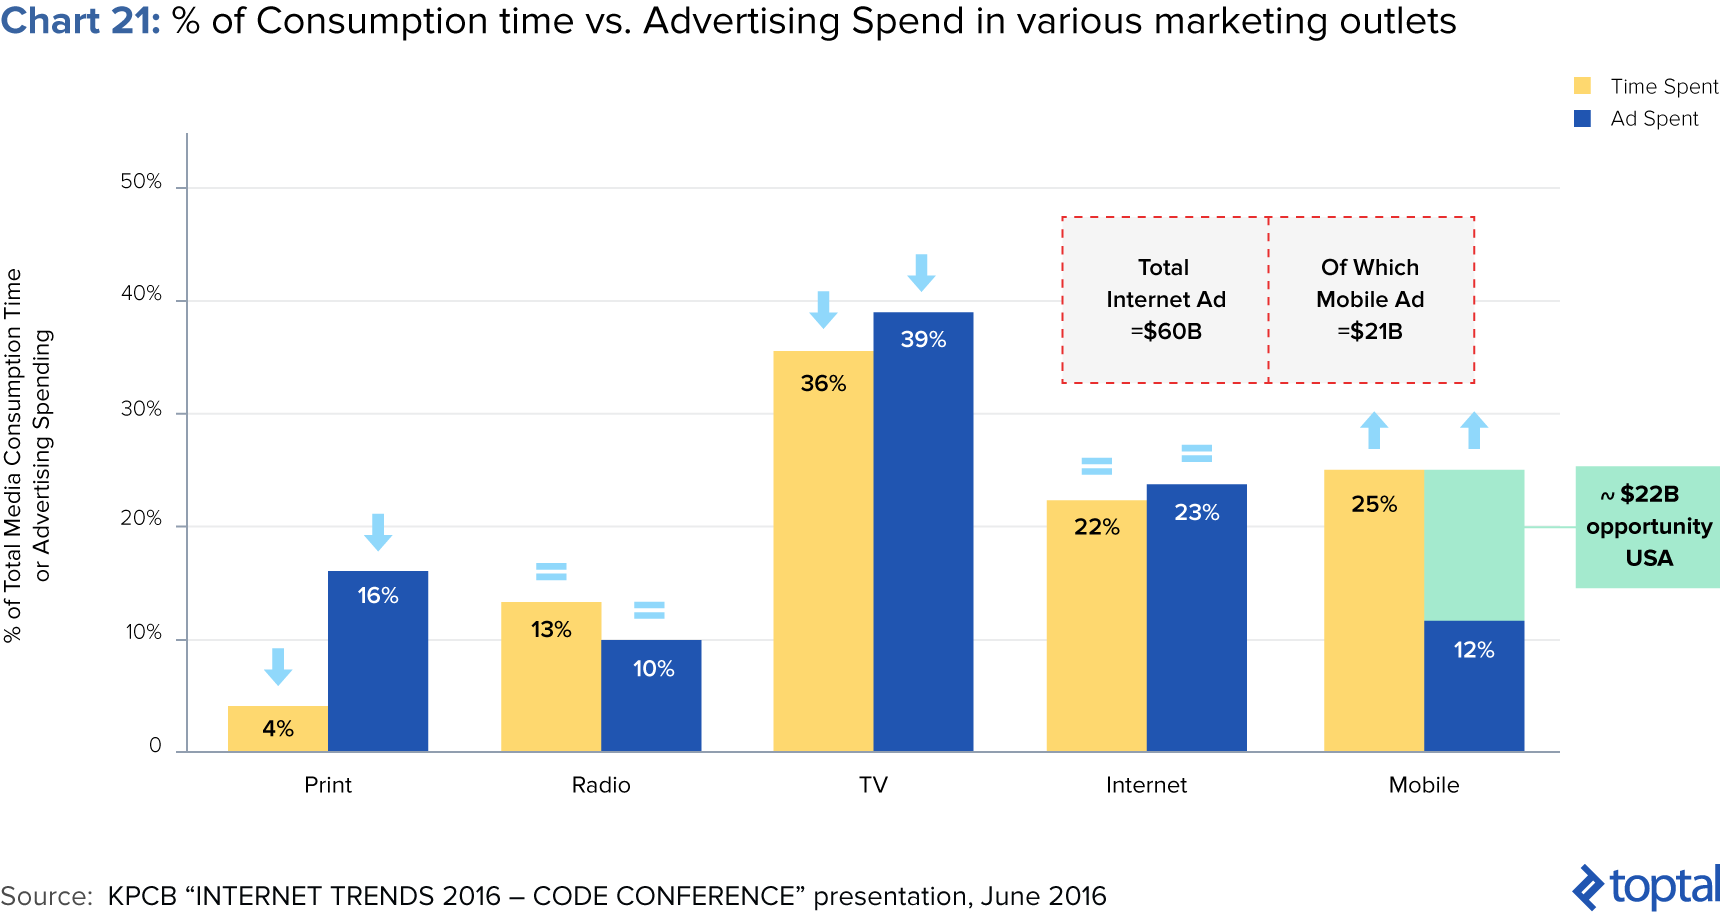
Moreover, according to KPCB, there is a $22bn market opportunity in mobile advertising as it is the only growing outlet in terms of % of consumption time. This should continue to encourage marketers to shift away from more legacy outlets like TV and print and into mobile (chart 21). Given that Snap’s entire advertising inventory is on mobile, a growing pool of total mobile advertising dollars will certainly benefit Snap going forward.
Rabbit from a hat: Ancillary product launches may add further upside to ARPU
For further revenue upside one can’t overlook Snap’s potential to develop ancillary products.
Snap has already demonstrated a willingness to explore new product categories with the launch of Spectacles in September 2016, its first ever hardware product. New product developments outside of software could potentially provide Snap with a very interesting monetization model that is different from their competitors (FB is exploring VR) and a unique way of owning more of the user’s share of mind.
Spectacles are wearable glasses with a built-in camera that links seamlessly to a smartphone to create unique Snaps from a “human perspective.” The company views Spectacles as an extension of Snapchat and intends to use the glasses to create a unique circular format for video as opposed to the standard rectangular viewing perspective (once again reinventing the standard video delivery model).
Spectacles do generate revenue for Snap, but for 2016 the revenues were not material and, thus, not reported in the company’s filing. Going forward, Spectacles could represent a much larger portion of Snap’s revenue.
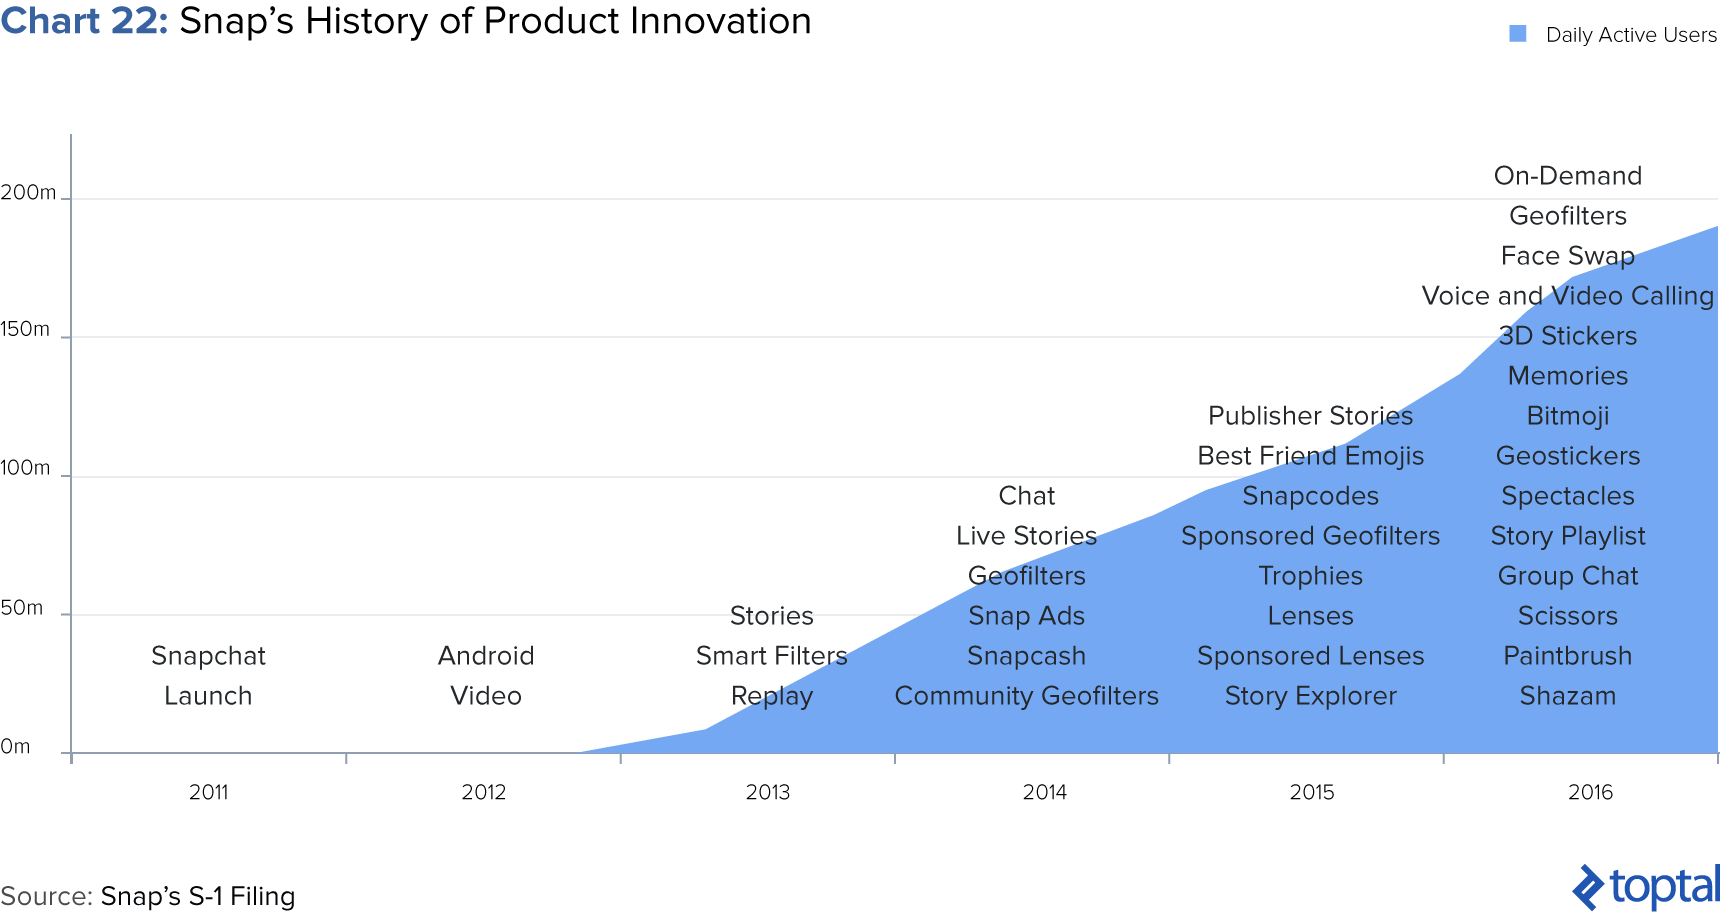
It’s unclear what other types of new products Snap is planning to bring to market, but Snap has demonstrated a strong ability to create innovative and sticky products that drive incremental user growth and revenue (chart 22). Expect each new product introduction to be strategic in driving user growth, enhancing user engagement, and increasing share of mind, all things that should bring create even greater revenue opportunities for Snap.
ARPU Growth Going Forward: A Monetization Machine
Looking ahead and given all of the above, our expectation is that despite slowing user growth, Snap’s platform should support very strong ARPU growth going forward. We see Snap’s ARPU catching up with Facebook’s in the next 5 years, and it would not surprise us if it surpasses it further out. In other words, despite Twitter-like user growth, Snap is likely to experience more of a Facebook-like, if not better, ARPU growth profile.
The biggest risk to this scenario playing out mainly relates to Facebook and other competitors’ ability to replicate Snap’s features both quickly and effectively. Should this be the case, Snap’s leadership in product innovation will likely fail to spill over into significant ARPU growth. However, should competitors struggle to play the “catch-up game” well enough, Snap will likely see ARPU growth rates in line with what we predict below. The latter has been interestingly described as the “Gingerbread strategy” in this article.
With that in mind we anticipate two possible ARPU growth trajectories. Our downside case projections are more in line with other commentaries and essentially consider the latter scenario of product innovation followed by effective catch-up by competitors. The base case is instead predicated on management’s ability to keep innovating on product, and competitors’ relative ineffectiveness at copying such features.
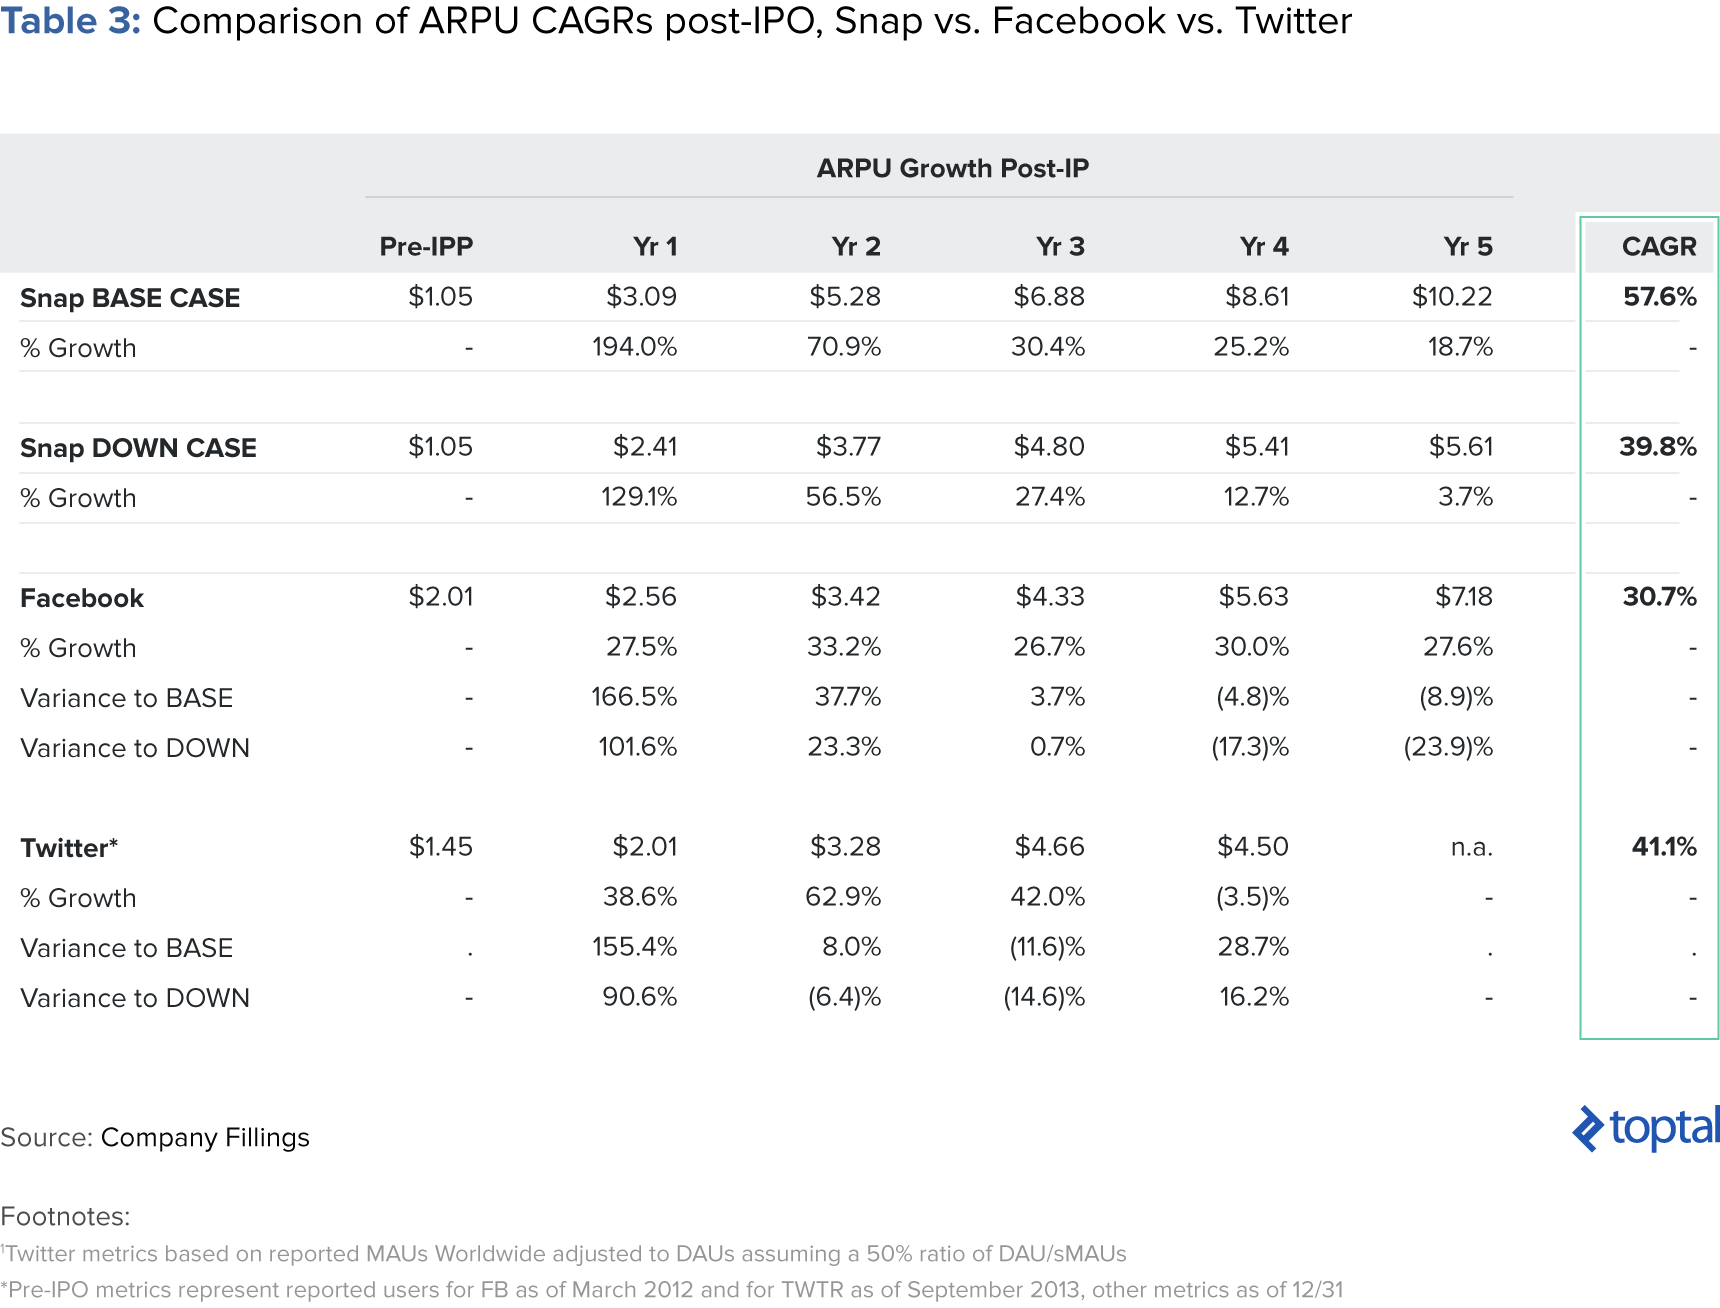
The numbers of both cases are displayed in table 3 below, but the highlight is that in our base case projections, we anticipate north of 50% CAGR over the next five years, with ARPU catching up to Facebook’s 2016 numbers by 2019/2020.
Putting This All Together: What is Snap worth?
With all of the above in mind, we can now proceed to calculating our estimated valuation for Snap. We first look at what Snap’s revenues will look like going forward, based on our DAU and ARPU assumptions outlined above, and then move into a valuation analysis using these revenue estimates.
Financial Forecasts
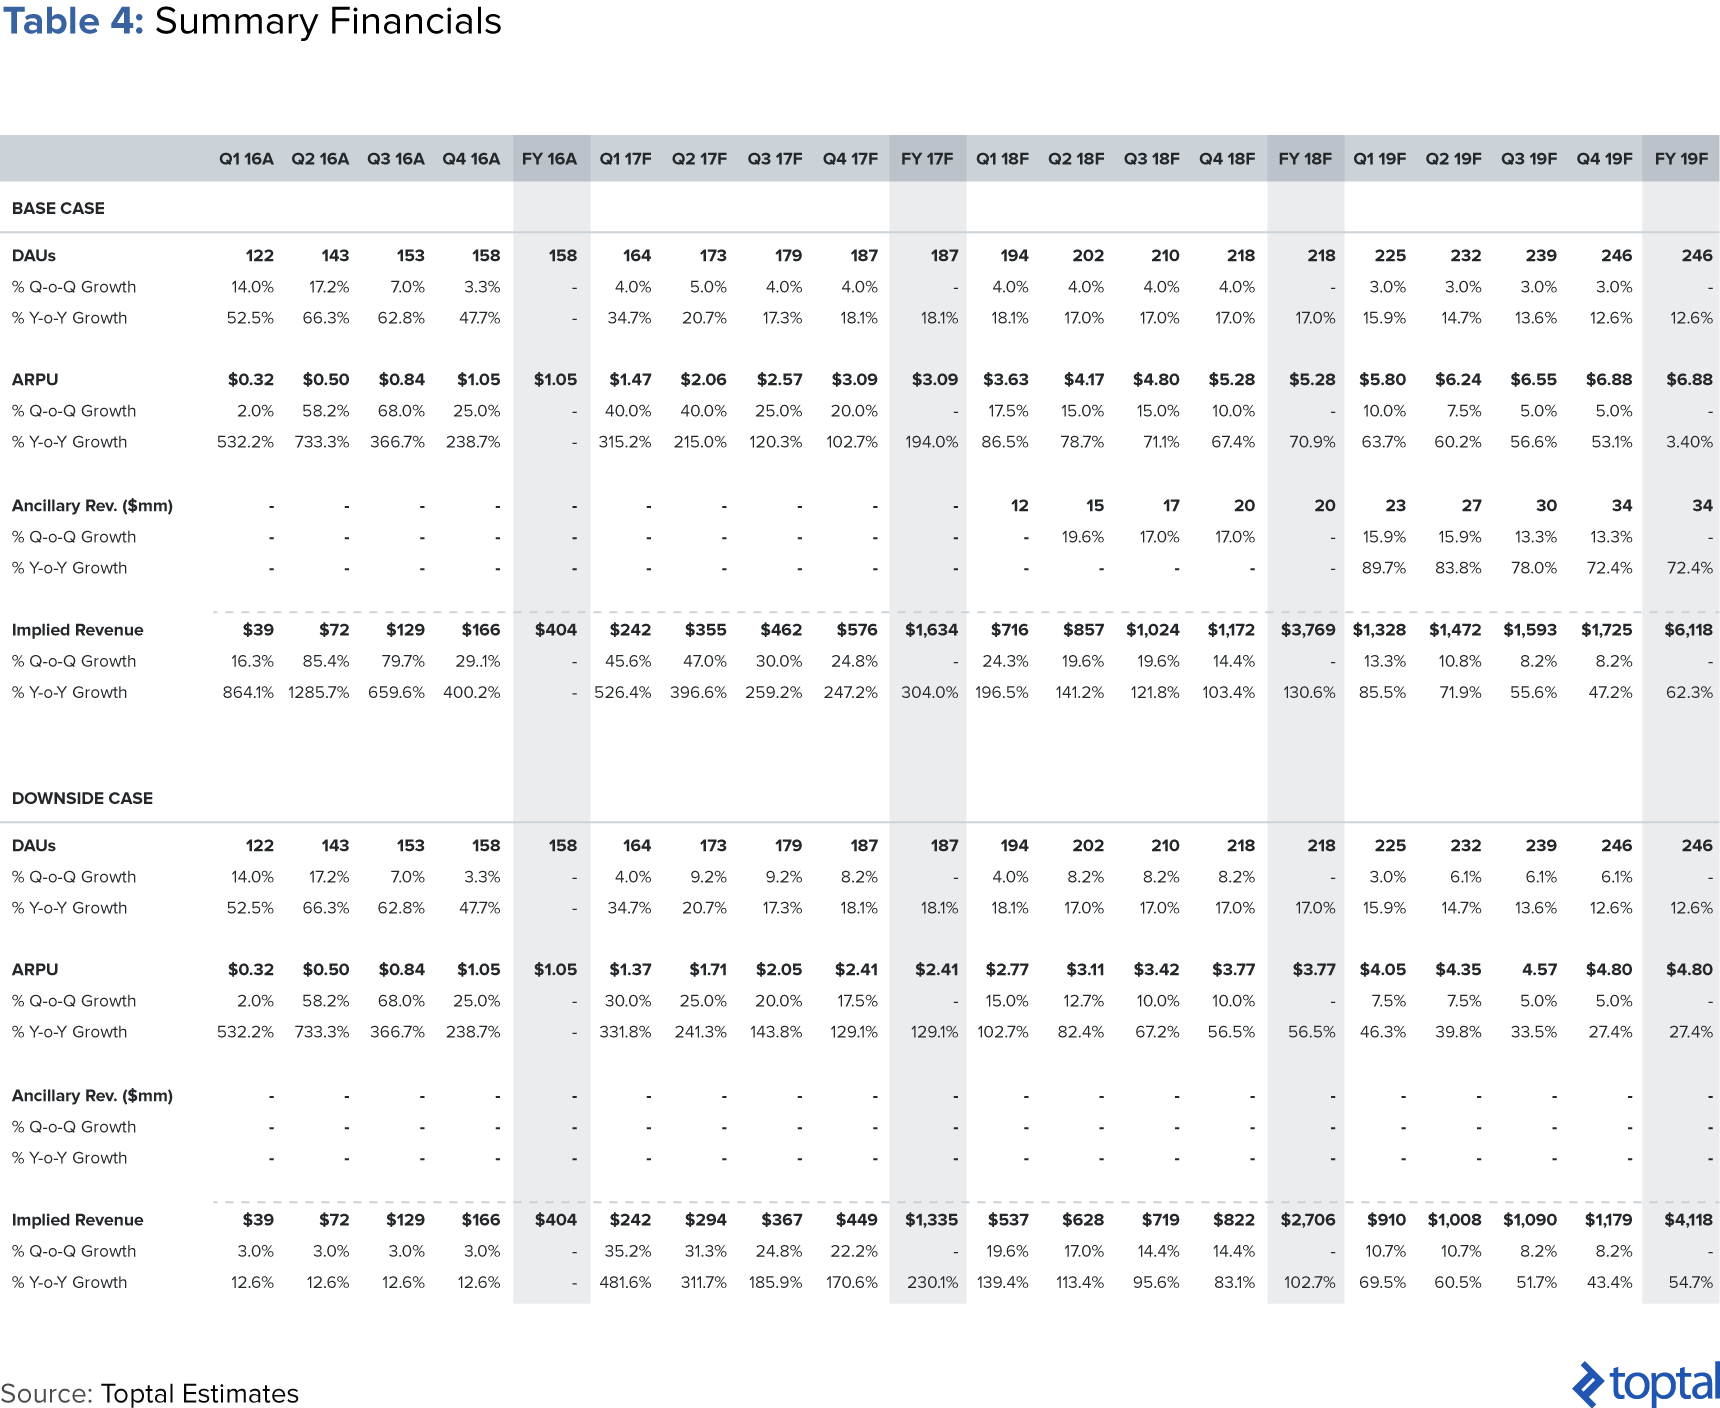
Our financial forecasts are summarized in Table 4, but the headline numbers we want to highlight are the following:
- DAU growth in between Twitter and Facebook’s post-IPO performance, reaching 246 million DAUs by 2019
- Strong ARPU catch-up and growth, reaching $6.88 per user by 2019, nearly equaling Facebook’s current 2016 ARPU numbers, in the Base Case
- More limited ARPU growth in the Downside Case, reaching $4.80 by 2019, in line with Twitter’s current ARPU numbers
- Total Revenues of $1.6 billion and $3.8 billion achieved in in 2017 and 2018, respectively, in the Base Case
- Total Revenues of $1.3 billion and $2.7billion achieved in in 2017 and 2018, respectively, in the Downside Case
Valuation
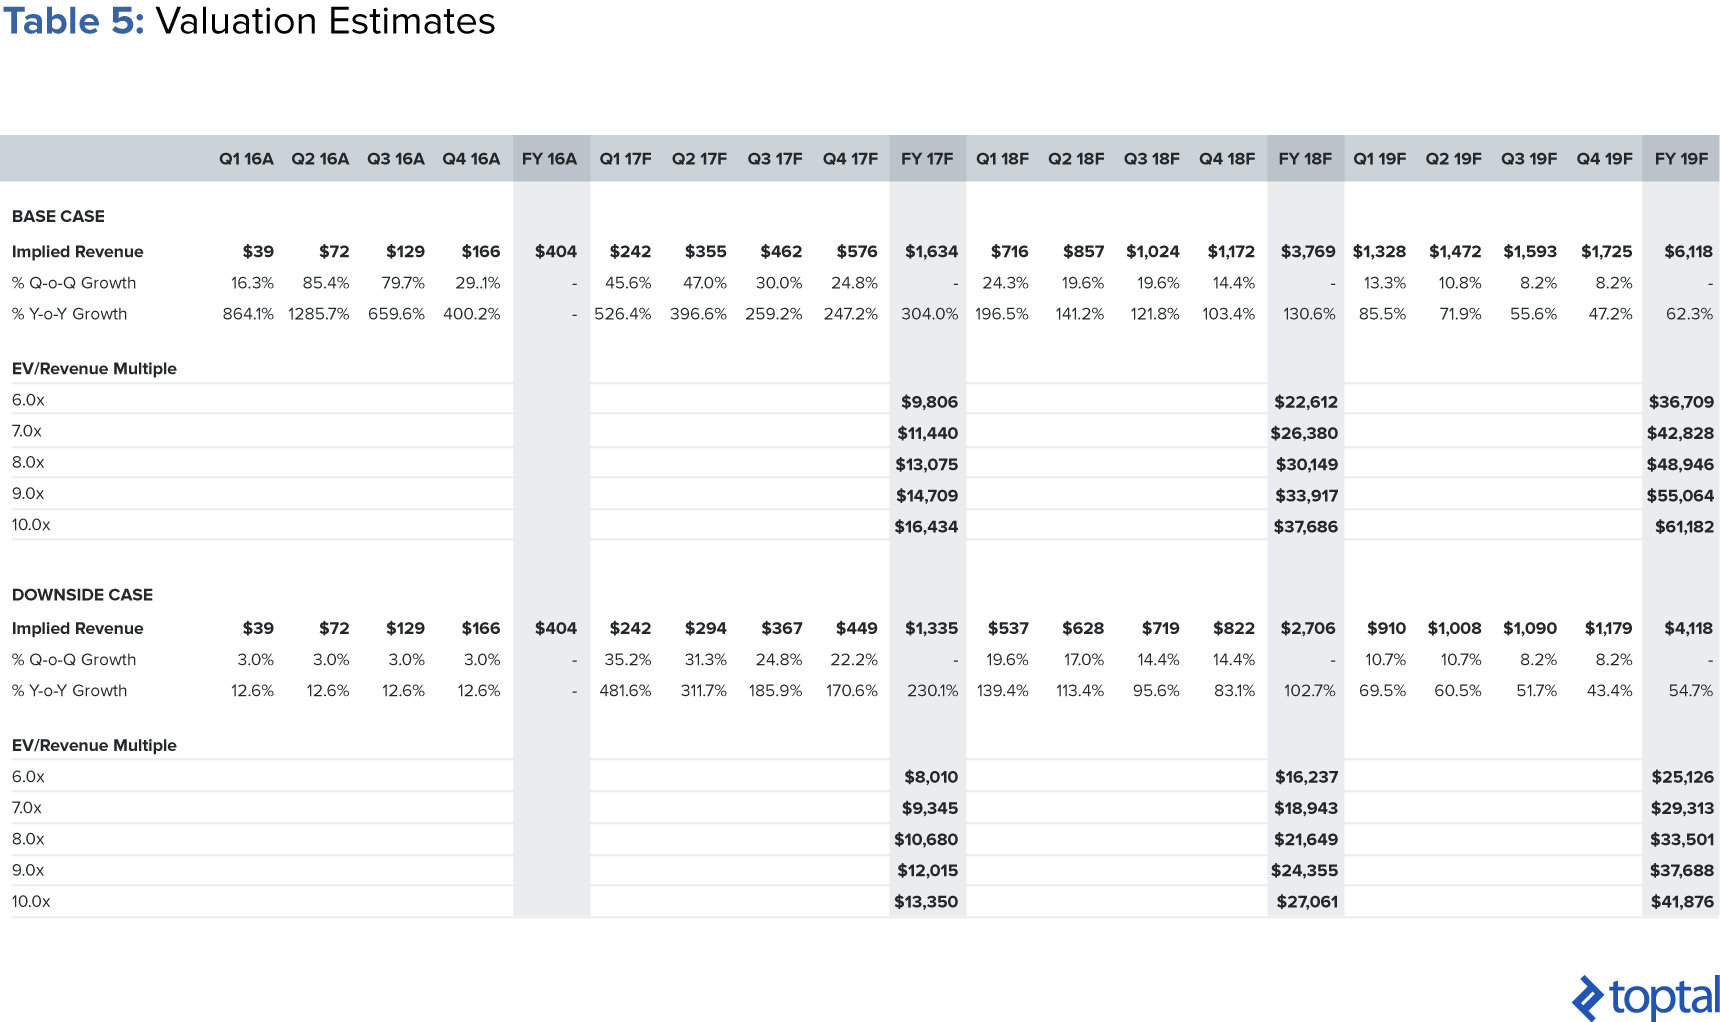
We value Snap on an EV / Revenue basis, using a target multiple range of 6.0x to 10.0x derived from the midpoint of the range between Facebook and Twitter current trading multiples. On the one hand, Snap’s more limited DAU growth warrants a lower multiple than Facebook’s, but on the other hand its more favourable ARPU prospects warrant a premium to Twitter’s multiple. We apply these multiple to forward 2018 revenue estimates to account for Snap being a younger company than both of its comps. Our valuation estimates are summarised in Table 5 below, but the key takeaways are as follows:
- Despite limited DAU growth, our base case ARPU assumptions imply a valuation of c. $30bn based off a 8.0x multiple on 2018 forward revenue estimates
- In our bearish case, we come out at $22bn on 2018 forward revenue estimates, in line but still slightly above more recent price targets.
- Overall, we see strong upside potential for Snap going forward, with the valuation potentially rising to nearly $50bn assuming greater maturity of their comps justifies using Snap’s 2019 forward revenue estimates for the valuation, concluding that this stock is a Buy.
Snap: Twitter growth, but Facebook ARPU
In many respects, one could say that the Snap IPO heralds a more general shift in social media platforms from building for user growth to building for user engagement and monetization. Since inception, Snap has always felt more like a blend between a traditional social media app and a gaming app. The more playful nature of the platform has in turn translated positively into monetization and ARPU growth, far more so than Snap’s peers did at their equivalent stages of their lifecycle. Whether a purposeful management strategy or not, Snap seems better built for monetization.
This of course is occurring concurrently with an increasing shift in advertising spend from traditional media outlets to online/digital and particular mobile channels. In many way, it feels like advertisers are reaching the tipping point of shifting a majority of their dollars to social media and “new media” channels.
As a result, we view Snap’s future financial prospects very favourably, and per our analysis above, conclude that Snap is a Buy. Snap’s value is a function of being the first social media platform that has been built with advertisers in mind from the beginning.
This opinion article is for informational purposes only, and does not constitute investment advice. The information in the document should not be construed as any current or past endorsement, recommendation or sponsorship of any company or security by the author or Toptal LLC.
Understanding the basics
What was the IPO price for Snapchat?
Snap Inc. priced its IPO at $17 per share. On its first day of trading on March 2, 2017, it rose by 44% to close at $24.48 per share.
How much did Snapchat make in IPO?
In its 2017 IPO, Snap Inc. raised $3.4 billion, with net proceeds of about $2.4 billion being retained by the company.
How do you calculate ARPU?
ARPU = Total Revenue / Average Number of Subscribers. Usually, it is calculated for either a monthly or annual time period.
Joe Matta
New York, NY, United States
Member since December 6, 2016
About the author
Joe has raised $1B+ for an energy project, advised on $500M+ in M&A deals, and managed high-growth businesses across different industries.
Expertise
PREVIOUSLY AT

