Tips and Tools for Optimizing Android Apps
The plethora of tutorials on building Android apps may have you thinking that making a mobile app is simple. In reality, however, performance issues can be very complicated, and because performance plays a key role in making sure that your app stays on your users’ list of favorite apps for a long time, every little detail must be given full attention.
In this article, Toptal Freelance Software Engineer Tibor Kaputa shares some tips on how you can optimize some common performance issues and identify some of the bottlenecks in your Android app.
Tibor is a skilled developer with more than eight years of experience in Java, Kotlin, JavaScript, and C++. He’s also a veteran server administrator.
Expertise
PREVIOUSLY AT

Android devices have a lot of cores, so writing smooth apps is a simple task for anyone, right? Wrong. As everything on Android can be done in a lot of different ways, picking the best option can be tough. If you want to choose the most efficient method, you have to know what’s happening under the hood. Luckily, you don’t have to rely on your feelings or sense of smell, since there’s a lot of tools out there that can help you find bottlenecks by measuring and describing what’s going on. Properly optimized and smooth apps greatly improve the user experience, and also drain less battery.
Let’s see some numbers first to consider how important optimization really is. According to a Nimbledroid post, 86% of users (including me) have uninstalled apps after using them only once due to poor performance. If you’re loading some content, you have less than 11 seconds to show it to the user. Only every third user will give you more time. You might also get a lot of bad reviews on Google Play because of it.
The first thing every user notices over and over is the app’s startup time. According to another Nimbledroid post, out of the 100 top apps, 40 start in under 2 seconds, and 70 start in under 3 seconds. So if possible, you should generally display some content as soon as possible and delay the background checks and updates a bit.
Always remember, premature optimization is the root of all evil. You should also not waste too much time with micro optimization. You will see the most benefit of optimizing code that runs often. For example, this includes the onDraw() function, which runs every frame, ideally 60 times per second. Drawing is the slowest operation out there, so try redrawing only what you have to. More about this will come later.
Performance Tips
Enough theory, here is a list of some of the things you should consider if performance matters to you.
1. String vs. StringBuilder
Let’s say that you have a String, and for some reason you want to append more Strings to it 10 thousand times. The code could look something like this.
String string = "hello";
for (int i = 0; i < 10000; i++) {
    string += " world";
}
You can see on the Android Studio Monitors how inefficient some String concatenation can be. There’s tons of Garbage Collections (GC) going on.
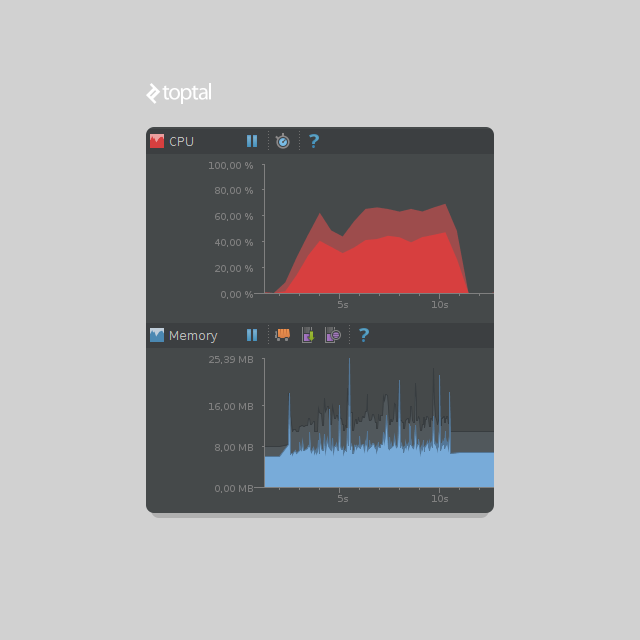
This operation takes around 8 seconds on my fairly good device, which has Android 5.1.1. The more efficient way of achieving the same goal is using a StringBuilder, like this.
StringBuilder sb = new StringBuilder("hello");
for (int i = 0; i < 10000; i++) {
    sb.append(" world");
}
String string = sb.toString();
On the same device this happens almost instantly, in less than 5ms. The CPU and Memory visualizations are almost totally flat, so you can imagine how big this improvement is. Notice though, that for achieving this difference, we had to append 10 thousand Strings, which you probably don’t do often. So in case you are adding just a couple Strings once, you will not see any improvement. By the way, if you do:
String string = "hello" + " world";
It gets internally converted to a StringBuilder, so it will work just fine.
You might be wondering, why is concatenating Strings the first way so slow? It is caused by the fact that Strings are immutable, so once they are created, they cannot be changed. Even if you think you are changing the value of a String, you are actually creating a new String with the new value. In an example like:
String myString = "hello";
myString += " world";
What you will get in memory is not 1 String “hello world”, but actually 2 Strings. The String myString will contain “hello world”, as you would expect. However, the original String with the value “hello” is still alive, without any reference to it, waiting to be garbage collected. This is also the reason why you should store passwords in a char array instead of a String. If you store a password as a String, it will stay in the memory in human-readable format until the next GC for an unpredictable length of time. Back to the immutability described above, the String will stay in the memory even if you assign it another value after using it. If you, however, empty the char array after using the password, it will disappear from everywhere.
2. Picking the Correct Data Type
Before you start writing code, you should decide what data types you will use for your collection. For example, should you use a Vector or an ArrayList? Well, it depends on your usecase. If you need a thread-safe collection, which will allow only one thread at once to work with it, you should pick a Vector, as it is synchronized. In other cases you should probably stick to an ArrayList, unless you really have a specific reason to use vectors.
How about the case when you want a collection with unique objects? Well, you should probably pick a Set. They cannot contain duplicates by design, so you will not have to take care of it yourself. There are multiple types of sets, so pick one that fits your use case. For a simple group of unique items, you can use a HashSet. If you want to preserve the order of items in which they were inserted, pick a LinkedHashSet. A TreeSet sorts items automatically, so you will not have to call any sorting methods on it. It should also sort the items efficiently, without you having to think of sorting algorithms.
— Rob Pike's 5 Rules of Programming
Sorting integers or strings is pretty straightforward. However, what if you want to sort a class by some property? Let’s say you are writing a list of meals you eat, and store their names and timestamps. How would you sort the meals by timestamp from the lowest to highest? Luckily, it’s pretty simple. It’s enough to implement the Comparable interface in the Meal class and override the compareTo() function. To sort the meals by lowest timestamp to highest, we could write something like this.
@Override
public int compareTo(Object object) {
    Meal meal = (Meal) object;
    if (this.timestamp < meal.getTimestamp()) {
        return -1;
    } else if (this.timestamp > meal.getTimestamp()) {
        return 1;
    }
    return 0;
}
3. Location Updates
There are a lot of apps out there which collect the user’s location. You should use the Google Location Services API for that purpose, which contains a lot of useful functions. There is a separate article about using it, so I will not repeat it.
I’d just like to stress some important points from a performance perspective.
First of all, use only the most precise location as you need. For example, if you are doing some weather forecasting, you don’t need the most accurate location. Getting just a very rough area based on the network is faster, and more battery efficient. You can achieve it by setting the priority to LocationRequest.PRIORITY_LOW_POWER.
You can also use a function of LocationRequest called setSmallestDisplacement(). Setting this in meters will cause your app to not be notified about location change if it was smaller than the given value. For example, if you have a map with nearby restaurants around you, and you set the smallest displacement to 20 meters, the app will not be making requests for checking restaurants if the user is just walking around in a room. The requests would be useless, as there wouldn’t be any new nearby restaurant anyway.
The second rule is requesting location updates only as often as you need them. This is quite self explanatory. If you are really building that weather forecast app, you do not need to request the location every few seconds, as you probably don’t have such precise forecasts (contact me if you do). You can use the setInterval() function for setting the required interval in which the device will be updating your app about the location. If multiple apps keep requesting the user’s location, every app will be notified at every new location update, even if you have a higher setInterval() set. To prevent your app from being notified too often, make sure to always set a fastest update interval with setFastestInterval().
And finally, the third rule is requesting location updates only if you need them. If you are displaying some nearby objects on the map every x seconds and the app goes in background, you do not need to know the new location. There is no reason to update the map if the user cannot see it anyway. Make sure to stop listening for location updates when appropriate, preferably in onPause(). You can then resume the updates in onResume().
4. Network Requests
There is a high chance that your app is using the internet for downloading or uploading data. If it is, you have several reasons to pay attention to handling network requests. One of them is mobile data, which is very limited to a lot of people and you shouldn’t waste it.
The second one is battery. Both WiFi and mobile networks can consume quite a lot of it if they are used too much. Let’s say that you want to download 1 kb. To make a network request, you have to wake up the cellular or WiFi radio, then you can download your data. However, the radio will not fall asleep immediately after the operation. It will stay in a fairly active state for about 20-40 more seconds, depending on your device and carrier.
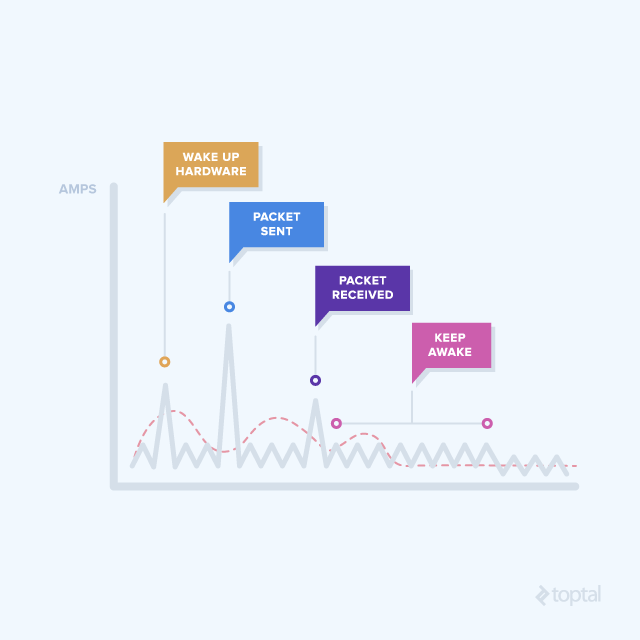
So, what can you do about it? Batch. To avoid waking up the radio every couple seconds, prefetch things that the user might need in the upcoming minutes. The proper way of batching is highly dynamic depending on your app, but if it is possible, you should download the data the user might need in the next 3-4 minutes. One could also edit the batch parameters based on the user’s internet type, or charging state. For example, if the user is on WiFi while charging, you can prefetch a lot more data than if the user is on mobile internet with low battery. Taking all these variables into account can be a tough thing, which only few people would do. Luckily though, there is GCM Network Manager to the rescue!
GCM Network Manager is a really helpful class with a lot of customizable attributes. You can easily schedule both repeating and one-off tasks. At repeating tasks you can set the lowest, as well as the highest repeat interval. This will allow batching not only your requests, but also requests from other apps. The radio has to be woken up only once per some period, and while it’s up, all apps in the queue download and upload what they are supposed to. This Manager is also aware of the device’s network type and charging state, so you can adjust accordingly. You can find more details and samples in this article, I urge you to check it out. An example task looks like this:
Task task = new OneoffTask.Builder()
    .setService(CustomService.class)
    .setExecutionWindow(0, 30)
    .setTag(LogService.TAG_TASK_ONEOFF_LOG)
    .setUpdateCurrent(false)
    .setRequiredNetwork(Task.NETWORK_STATE_CONNECTED)
    .setRequiresCharging(false)
    .build();
By the way, since Android 3.0, if you do a network request on the main thread, you will get a NetworkOnMainThreadException. That will definitely warn you not to do that again.
5. Reflection
Reflection is the ability of classes and objects to examine their own constructors, fields, methods, and so on. It is used usually for backward compatibility, to check if a given method is available for a particular OS version. If you have to use reflection for that purpose, make sure to cache the response, as using reflection is pretty slow. Some widely used libraries use Reflection too, like Roboguice for dependency injection. That’s the reason why you should prefer Dagger 2. For more details about reflection, you can check a separate post.
6. Autoboxing
Autoboxing and unboxing are processes of converting a primitive type to an Object type, or vice versa. In practice it means converting an int to an Integer. For achieving that, the compiler uses the Integer.valueOf() function internally. Converting is not just slow, Objects also take a lot more memory than their primitive equivalents. Let’s look at some code.
Integer total = 0;
for (int i = 0; i < 1000000; i++) {
    total += i;
}
While this takes 500ms on average, rewriting it to avoid autoboxing will speed it up drastically.
int total = 0;
for (int i = 0; i < 1000000; i++) {
    total += i;
}
This solution runs at around 2ms, which is 25 times faster. If you don’t believe me, test it out. The numbers will be obviously different per device, but it should still be a lot faster. And it’s also a really simple step to optimize.
Okay, you probably don’t create a variable of type Integer like this often. But what about the cases when it is more difficult to avoid? Like in a map, where you have to use Objects, like Map<Integer, Integer>? Look at the solution many people use.
Map<Integer, Integer> myMap = new HashMap<>();
for (int i = 0; i < 100000; i++) {
    myMap.put(i, random.nextInt());
}
Inserting 100k random ints in the map takes around 250ms to run. Now look at the solution with SparseIntArray.
SparseIntArray myArray = new SparseIntArray();
for (int i = 0; i < 100000; i++) {
    myArray.put(i, random.nextInt());
}
This takes a lot less, roughly 50ms. It’s also one of the easier methods for improving performance, as nothing complicated has to be done, and the code also stays readable. While running a clear app with the first solution took 13MB of my memory, using primitive ints took something under 7MB, so just the half of it.
SparseIntArray is just one of the cool collections that can help you avoid autoboxing. A map like Map<Integer, Long> could be replaced by SparseLongArray, as the value of the map is of type Long. If you look at the source code of SparseLongArray, you will see something pretty interesting. Under the hood, it is basically just a pair of arrays. You can also use a SparseBooleanArray similarly.
If you read the source code, you might have noticed a note saying that SparseIntArray can be slower than HashMap. I’ve been experimenting a lot, but for me SparseIntArray was always better both memory and performance wise. I guess it’s still up to you which you choose, experiment with your use cases and see which fits you the most. Definitely have the SparseArrays in your head when using maps.
7. OnDraw
As I’ve said above, when you are optimizing performance, you will probably see the most benefit in optimizing code which runs often. One of the functions running a lot is onDraw(). It may not surprise you that it’s responsible for drawing views on the screen. As the devices usually run at 60 fps, the function is run 60 times per second. Every frame has 16 ms to be fully handled, including its preparation and drawing, so you should really avoid slow functions. Only the main thread can draw on the screen, so you should avoid doing expensive operations on it. If you freeze the main thread for several seconds, you might get the infamous Application Not Responding (ANR) dialog. For resizing images, database work, etc., use a background thread.
I’ve seen some people trying to shorten their code, thinking that it will be more efficient that way. That definitely isn’t the way to go, as shorter code totally doesn’t mean faster code. Under no circumstances should you measure the quality of code by the number of lines.
One of the things you should avoid in onDraw() is allocating objects like Paint. Prepare everything in the constructor, so it’s ready when drawing. Even if you have onDraw() optimized, you should call it only as often as you have to. What is better than calling an optimized function? Well, not calling any function at all. In case you want to draw text, there is a pretty neat helper function called drawText(), where you can specify things like the text, coordinates, and the text color.
8. ViewHolders
You probably know this one, but I cannot skip it. The Viewholder design pattern is a way of making scrolling lists smoother. It is a kind of view caching, which can seriously reduce the calls to findViewById() and inflating views by storing them. It can look something like this.
static class ViewHolder {
    TextView title;
    TextView text;

    public ViewHolder(View view) {
        title = (TextView) view.findViewById(R.id.title);
        text = (TextView) view.findViewById(R.id.text);
    }
}
Then, inside the getView() function of your adapter, you can check if you have a useable view. If not, you create one.
ViewHolder viewHolder;
if (convertView == null) {
    convertView = inflater.inflate(R.layout.list_item, viewGroup, false);
    viewHolder = new ViewHolder(convertView);
    convertView.setTag(viewHolder);
} else {
    viewHolder = (ViewHolder) convertView.getTag();
}

viewHolder.title.setText("Hello World");
You can find a lot of useable info about this pattern around the internet. It can also be used in cases when your list view has multiple different types of elements in it, like some section headers.
9. Resizing Images
Chances are, your app will contain some images. In case you are downloading some JPGs from the web, they can have really huge resolutions. However, the devices they will be displayed on will be a lot smaller. Even if you take a photo with the camera of your device, it needs to be downsized before displaying as the photo resolution is a lot bigger than the resolution of the display. Resizing images before displaying them is a crucial thing. If you’d try displaying them in full resolutions, you’d run out of memory pretty quickly. There is a whole lot written about displaying bitmaps efficiently in the Android docs, I will try summing it up.
So you have a bitmap, but you don’t know anything about it. There’s a useful flag of Bitmaps called inJustDecodeBounds at your service, which allows you to find out the bitmap’s resolution. Let’s assume that your bitmap is 1024x768, and the ImageView used for displaying it is just 400x300. You should keep dividing the bitmap’s resolution by 2 until it’s still bigger than the given ImageView. If you do, it will downsample the bitmap by a factor of 2, giving you a bitmap of 512x384. The downsampled bitmap uses 4x less memory, which will help you a lot with avoiding the famous OutOfMemory error.
Now that you know how to do it, you should not do it. … At least, not if your app relies on images heavily, and it’s not just 1-2 images. Definitely avoid stuff like resizing and recycling images manually, use some third party libraries for that. The most popular ones are Picasso by Square, Universal Image Loader, Fresco by Facebook, or my favourite, Glide. There is a huge active community of developers around it, so you can find a lot of helpful people at the issues section on GitHub as well.
10. Strict Mode
Strict Mode is a quite useful developer tool that many people don’t know about. It’s usually used for detecting network requests or disk accesses from the main thread. You can set what issues Strict Mode should look for and what penalty it should trigger. A google sample looks like this:
public void onCreate() {
    if (DEVELOPER_MODE) {
        StrictMode.setThreadPolicy(new StrictMode.ThreadPolicy.Builder()
                .detectDiskReads()
                .detectDiskWrites()
                .detectNetwork()
                .penaltyLog()
                .build());
        StrictMode.setVmPolicy(new StrictMode.VmPolicy.Builder()
                .detectLeakedSqlLiteObjects()
                .detectLeakedClosableObjects()
                .penaltyLog()
                .penaltyDeath()
                .build());
    }
    super.onCreate();
}
If you want to detect every issue Strict Mode can find, you can also use detectAll(). As with many performance tips, you should not blindly try fixing everything Strict Mode reports. Just investigate it, and if you are sure it’s not an issue, leave it alone. Also make sure to use Strict Mode only for debugging, and always have it disabled on production builds.
Debugging Performance: The Pro Way
Let’s now see some tools that can help you find bottlenecks, or at least show that something is wrong.
1. Android Monitor
This is a tool built into Android Studio. By default, you can find the Android Monitor at the bottom left corner, and you can switch between 2 tabs there. Logcat and Monitors. The Monitors section contains 4 different graphs. Network, CPU, GPU, and Memory. They are pretty self explanatory, so I will just quickly go through them. Here is a screenshot of the graphs taken while parsing some JSON as it is downloaded.
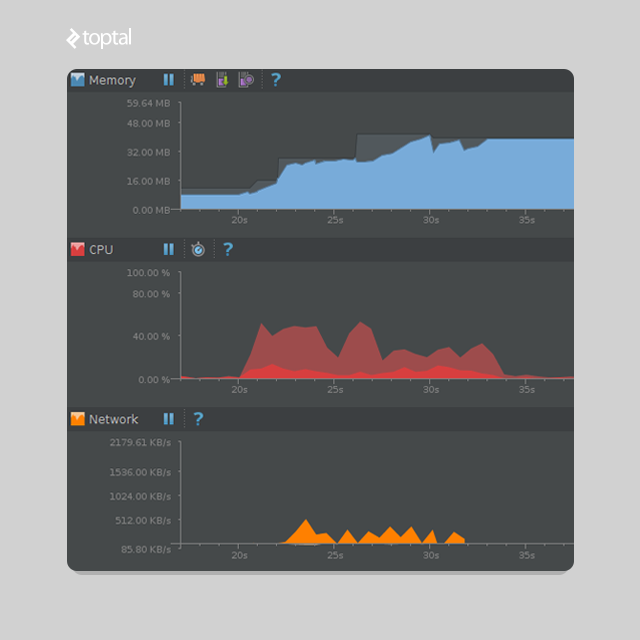
The Network part shows the incoming and outgoing traffic in KB/s. The CPU part displays the CPU usage in percent. The GPU monitor displays how much time it takes to render the frames of a UI window. This is the most detailed monitor out of these 4, so if you want more details about it, read this.
Lastly we have the Memory monitor, which you will probably use the most. By default it shows the current amount of Free and Allocated memory. You can force a Garbage Collection with it too, to test if the amount of used memory drops down. It has a useful feature called Dump Java Heap, which will create a HPROF file which can be opened with the HPROF Viewer and Analyzer. That will enable you to see how many objects you have allocated, how much memory is taken by what, and maybe which objects are causing memory leaks. Learning how to use this analyzer is not the simplest task out there, but it is worth it. The next thing you can do with the Memory Monitor is do some timed Allocation Tracking, which you can start and stop as you wish. It could be useful at many cases, for example when scrolling or rotating the device.
2. GPU Overdraw
This is a simple helper tool, which you can activate in Developer Options once you have enabled developer mode. Select Debug GPU overdraw, “Show overdraw areas”, and your screen will get some weird colors. It’s ok, that’s what is supposed to happen. The colors mean how many times a particular area was overdrawn. True color means that there was no overdraw, this is what you should aim for. Blue means one overdraw, green means two, pink three, red four.
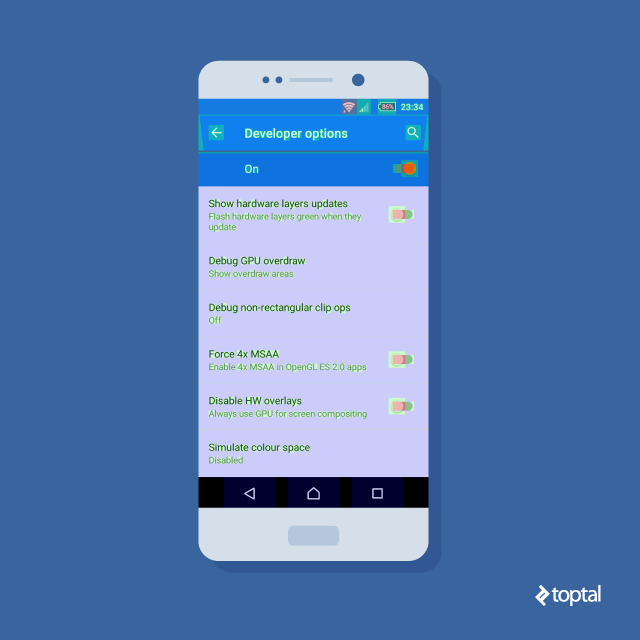
While seeing true color is the best, you will always see some overdraws, especially around texts, navigation drawers, dialogs and more. So don’t try getting rid of it fully. If your app is blueish or greenish, that’s probably fine. However, if you see too much red on some simple screens, you should investigate what’s going on. It might be too many fragments stacked onto each other, if you keep adding them instead of replacing. As I’ve mentioned above, drawing is the slowest part of apps, so there is no sense drawing something if there will be more than 3 layers drawn onto it. Feel free to check out your favourite apps with it. You will see that even apps with over a billion downloads have red areas, so just take it easy when you are trying to optimize.
3. GPU Rendering
This is another tool from the Developer options, called Profile GPU rendering. Upon selecting it, pick “On screen as bars”. You will notice some colored bars appearing on your screen. Since every application has separate bars, weirdly the status bar has its own ones, and in case you have software navigation buttons, they have their own bars too. Anyway, the bars get updated as you interact with the screen.
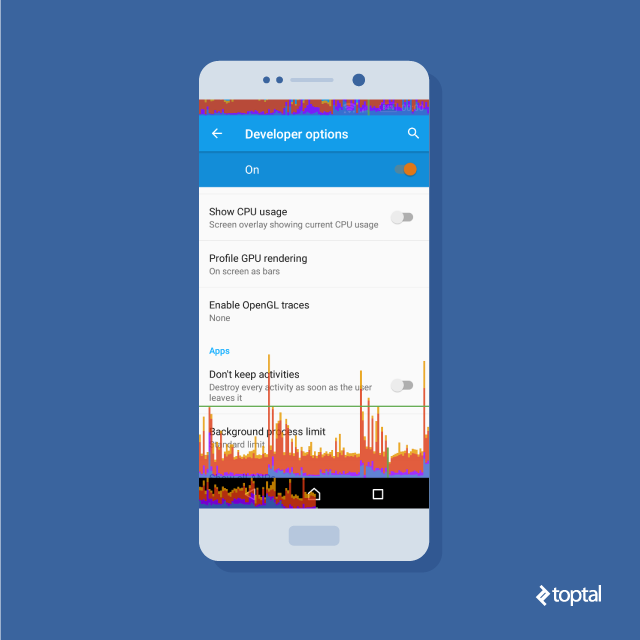
The bars consist of 3-4 colors, and according to the Android docs, their size indeed matters. The smaller, the better. At the bottom you have blue, which represents the time used to create and update the View’s display lists. If this part is too tall, it means that there is a lot of custom view drawing, or a lot of work done in the onDraw() functions. If you have Android 4.0+, you will see a purple bar above the blue one. This represents the time spent transferring resources to the render thread. Then comes the red part, which represents the time spent by Android’s 2D renderer issuing commands to OpenGL to draw and redraw display lists. At the top is the orange bar, which represents the time the CPU is waiting for the GPU to finish its work. If it’s too tall, the app is doing too much work on the GPU.
If you are good enough, there is one more color above the orange. It is a green line representing the 16 ms threshold. As your goal should be running your app at 60 fps, you have 16 ms to draw every frame. If you don’t make it, some frames might be skipped, the app could become jerky, and the user would definitely notice. Pay special attention to animations and scrolling, that’s where the smoothness matters the most. Even though you can detect some skipped frames with this tool, it won’t really help you figuring out where exactly the problem is.
4. Hierarchy Viewer
This is one of my favourite tools out there, as it’s really powerful. You can start it from Android Studio through Tools -> Android -> Android Device Monitor, or it is also in your sdk/tools folder as “monitor”. You can also find a standalone hierarachyviewer executable there, but as it’s deprecated you should open the monitor. However you open the Android Device Monitor, switch to the Hierarchy Viewer perspective. If you don’t see any running apps assigned to your device, there are a couple things you can do to fix it. Also try checking out this issue thread, there are people with all kinds of issues and all kinds of solutions. Something should work for you too.
With Hierarchy Viewer, you can get a really neat overview of your view hierarchies (obviously). If you see every layout in a separate XML, you might easily spot useless views. However, if you keep combining the layouts, it can easily get confusing. A tool like this makes it simple to spot, for example, some RelativeLayout, which has just 1 child, another RelativeLayout. That makes one of them removable.
Avoid calling requestLayout(), as it causes traversing of the entire view hierarchy, to find out how big each view should be. If there is some conflict with the measurements, the hierarchy might be traversed multiple times, which if happens during some animation, it will definitely make some frames be skipped. If you want to find out more about how Android draws its views, you can read this. Let’s look at one view as seen in Hierarchy Viewer.
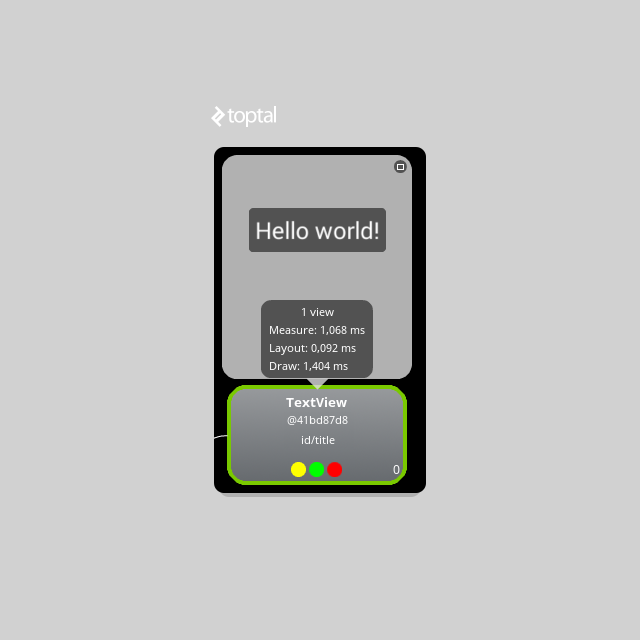
The top right corner contains a button for maximizing the preview of the particular view in a standalone window. Under it you can also see the actual preview of the view in the app. The next item is a number, which represents how many children the given view has, including the view itself. If you select a node (preferably the root one) and press “Obtain layout times” (3 colored circles), you will have 3 more values filled, together with colored circles appearing labelled measure, layout, and draw. It might not be shocking that the measure phase represents the time it took to measure the given view. The layout phase is about the rendering time, while the drawing is the actual drawing operation. These values and colors are relative to each other. Green one means that the view renders in the top 50% of all views in the tree. Yellow means rendering in the slower 50% of all views in the tree, red means that the given view is one of the slowest. As these values are relative, there will always be red ones. You simply cannot avoid them.
Under the values you have the class name, such as “TextView”, an internal view ID of the object, and the android:id of the view, which you set in the XML files. I urge you to build a habit of adding IDs to all views, even if you don’t reference them in the code. It will make identifying the views in Hierarchy Viewer really simple, and in case you have automated tests in your project, it will also make targeting the elements a lot faster. That will save some time for you and your colleagues writing them. Adding IDs to elements added in XML files is pretty straightforward. But what about the dynamically added elements? Well, it turns out to be really simple too. Just create an ids.xml file inside your values folder and type in the required fields. It can look like this:
<resources>
    <item name="item_title" type="id"/>
    <item name="item_body" type="id"/>
</resources>
Then in the code, you can use setId(R.id.item_title). It couldn’t be simpler.
There are a couple more things to pay attention to when optimizing UI. You should generally avoid deep hierarchies while preferring shallow, maybe wide ones. Do not use layouts you don’t need. For example, you can probably replace a group of nested LinearLayouts with either a RelativeLayout, or a TableLayout. Feel free to experiment with different layouts, don’t just always use LinearLayout and RelativeLayout. Also try creating some custom views when needed, it can improve the performance significantly if done well. For instance, did you know that Instagram doesn’t use TextViews for displaying comments?
You can find some more info about Hierarchy Viewer on the Android Developers site with descriptions of different panes, using the Pixel Perfect tool, etc. One more thing I would point out is capturing the views in a .psd file, which can be done by the “Capture the window layers” button. Every view will be in a separate layer, so it’s really simple to hide or change it in Photoshop or GIMP. Oh, that’s another reason to add an ID to every view you can. It will make the layers have names that actually make sense.
You will find a lot more debugging tools in Developer options, so I advise you to activate them and see what are they doing. What could possibly go wrong?
The Android developers site contains a set of best practices for performance. They cover a lot of different areas, including memory management, which I haven’t really talked about. I silently ignored it, because handling memory and tracking memory leaks is a whole separate story. Using a third party library for efficiently displaying images will help a lot, but if you still have memory issues, check out Leak canary made by Square, or read this.
Wrapping Up
So, this was the good news. The bad new is, optimizing Android apps is a lot more complicated. There are a lot of ways of doing everything, so you should be familiar with the pros and cons of them. There usually isn’t any silver bullet solution which has only benefits. Only by understanding what’s happening behind the scenes will you be able to pick the solution which is best for you. Just because your favorite developer says that something is good, it doesn’t necessarily mean that it’s the best solution for you. There are a lot more areas to discuss and more profiling tools which are more advanced, so we might get to them next time.
Make sure you learn from the top developers and top companies. You can find a couple hundred engineering blogs at this link. It’s obviously not just Android related stuff, so if you are interested only in Android, you have to filter the particular blog. I would highly recommend the blogs of Facebook and Instagram. Even though the Instagram UI on Android is questionable, their engineering blog has some really cool articles. For me it’s awesome that it’s so easy to see how things are done in companies which are handling hundreds of millions of users daily, so not reading their blogs seems crazy. The world is changing really fast, so if you aren’t constantly trying to improve, learn from others and use new tools, you will be left behind. As Mark Twain said, a person who doesn’t read has no advantage over one who can’t read.
Further Reading on the Toptal Blog:
- Top 10 Most Common Android Development Mistakes
- Meet RxJava: The Missing Reactive Programming Library for Android
- Future-proof Your Android Code, Part 2: Functional Reactive Programming in Action
- The Foundations of Functional Reactive Programming in Android
- Kotlin vs. Java: All-purpose Uses and Android Apps
Tibor Kaputa
Jasov, Košice Region, Slovakia
Member since January 8, 2016
About the author
Tibor is a skilled developer with more than eight years of experience in Java, Kotlin, JavaScript, and C++. He’s also a veteran server administrator.
Expertise
PREVIOUSLY AT

