
Introduction to Deep Learning Trading in Hedge Funds
In this article, Toptal Freelance Software Engineer Neven Pičuljan introduces you to the intricacies of deep learning in hedge funds and finance in general.

In this article, Toptal Freelance Software Engineer Neven Pičuljan introduces you to the intricacies of deep learning in hedge funds and finance in general.

Co-founder of Poze and CEO of an AI R&D/consulting company, Neven has an MCS degree and has built a face-recognition system in TensorFlow.
Over the past few years, deep neural networks have become extremely popular. This emerging field of computer science was created around the concept of biological neural networks, and deep learning has become something of a buzzword today.
Deep learning scientists and engineers try to mathematically describe various patterns from biological nervous systems. Deep learning systems have been applied to various problems: computer vision, speech recognition, natural language processing, machine translation, and more. It is interesting and exciting that in some tasks, deep learning has outperformed human experts. Today, we will be taking a look at deep learning in the financial sector.
One of the more attractive applications of deep learning is in hedge funds. Hedge funds are investment funds, financial organizations that raise funds from investors and manage them. They usually work with time series data and try to make some predictions. There is a special type of deep learning architecture that is suitable for time series analysis: recurrent neural networks (RNNs), or even more specifically, a special type of recurrent neural network: long short-term memory (LSTM) networks.
LSTMs are capable of capturing the most important features from time series data and modeling its dependencies. A stock price prediction model is presented as an illustrative case study on how hedge funds can use such systems. PyTorch framework, written in Python, is used to train the model, design experiments, and draw the results.
We will start with some deep learning basics before moving on to real-world examples:
- Introduce deep learning as an abstract concept.
- Introduce RNNs—or, more specifically, LSTMs—and how they can be used to model time series data.
- Familiarize readers with finance data suitable for deep learning.
- Illustrate how one actual hedge fund uses deep learning to predict stock prices.
- Finally, provide actionable recommendations for new and existing hedge funds as to how to use/leverage deep learning to augment their performance.
Presenting the Case for Deep Learning Trading
One of the most challenging and exciting tasks in the financial industry is predicting whether stock prices will go up or down in the future. Today, we are aware that deep learning algorithms are very good at solving complex tasks, so it is worth trying to experiment with deep learning systems to see whether they can successfully solve the problem of predicting future prices.
As a concept, the artificial neural network has been around for a long time, but the hardware wasn’t good enough to allow fast experiments in deep learning. Nvidia helped revolutionize deep learning networks a decade ago, as it started offering very fast graphics processing units (GPUs) for general purpose computing in Tesla-series products. Instead of shading polygons in games and professional design applications, highly parallelized GPUs can compute other data as well and, in many cases, they’re vastly superior to CPUs.
There are very few scientific papers about using deep learning in finance, but demand for deep learning experts from fintech companies is strong, as they obviously recognize its potential. This article will help explain why deep learning in finance is becoming increasingly popular by outlining how financial data is used in constructing deep learning systems. A special type of recurrent neural network—the LSTM network—will be presented as well. We will outline how a finance-related task can be solved using recurrent neural networks.
This article also features an illustrative case study on how hedge funds can use such systems, presented through experiments. We will also consider how deep learning systems can be improved and how hedge funds can go about hiring talent to build those systems, i.e., what sort of background does deep learning talent need to have.
What Makes Hedge Funds Different
Before we proceed to the technical aspect of the problem, we need to explain what makes hedge funds unique. So, what is a hedge fund?
A hedge fund is an investment fund—a financial organization which raises funds from investors and places them in short-term and long-term investments, or in different financial products. It is typically formed as a limited partnership or a limited liability company. A hedge fund’s goal is to maximize returns. A return is a gain or loss in the hedge funds’ net worth over a particular time period. It is generally accepted that when more risk is taken, there is greater potential for higher returns and losses.
In order to achieve good returns, hedge funds rely on various types of investment strategies, trying to make money by exploiting market inefficiencies. Due to various kinds of investment strategies that are not allowed in ordinary investment funds, hedge funds are not registered as funds, i.e., they are usually not supervised by the state like other funds. They don’t need to publish their investment strategies and business results, which can make them quite risky. Some hedge funds generate more money than the market average, but some of them lose money. Some of them bring permanent results, while some of the hedge funds’ results are variable.
By investing in hedge funds, investors increase the fund’s net worth. Not just anyone can invest in hedge funds, though. Hedge funds are intended for a small number of wealthy investors. Usually, the ones who want to take part in hedge funds need to be accredited. That means that they must have a special status regarding financial regulation laws. There is a distinction from country to country regarding who can have that special status. Usually, an investor’s net worth needs to be very high—not only individuals, but banks and large corporations can also operate in hedge funds. That accreditation is designed to allow only individuals with significant investment knowledge to take part, thus protecting small and inexperienced investors from risk.
This article considers the US regulatory framework, as the United States has the most developed financial market on the globe. So, in the United States of America, the term “accredited investor” is defined in Rule 501 of Regulation D of the US Securities and Exchange Commission (SEC).
According to this regulation, accredited investors can be:
- Banks
- Private business development companies
- Organizations
- Directors, executive officers, and general partners of the issuers of the securities being offered or sold
- Natural persons whose individual net worth, or joint net worth with that person’s spouse, exceeds $1,000,000
- Natural persons who had an individual income in excess of $200,000 in each of the two most recent years or joint income with that person’s spouse in excess of $300,000 in each of those years and has a reasonable expectation of reaching the same income level in the current year
- Trusts with total assets in excess of $5,000,000
- Entities in which all of the equity owners are accredited investors
Hedge fund managers manage the hedge fund. A hedge fund manager must find a way to create a competitive advantage to be successful, i.e., to create an advantage over rivals and the ability to generate greater value. It can be a very attractive career choice, as it can be very profitable if an individual excels at managing the fund.
On the other side, if a lot of hedge fund managers’ decisions turn out to be bad, they will not be paid and will gain a negative reputation. The best hedge fund managers make up one of the best paid professions across all industries. Hedge fund managers get a percentage of the returns they earn for investors, besides the management fee. This way of compensation makes hedge fund managers invest more aggressively in order to obtain greater returns, but on the other hand, that also leads to an increase in investor risk.
A Brief History of Hedge Funds
The first hedge fund appeared in 1949, established by former writer and sociologist Alfred Winslow Jones. It was while he was writing an article about current investment trends for Fortune, back in 1948.
He tried to manage the money and was very successful. He raised money using his investing innovation, which is now widely known as long/short equity. The strategy is still very popular among hedge funds. Shares can be bought (buy: long) or sold (sell: short).
When the price of a share is low and it is expected that the price of a share will go high, it is logical to buy a share (long) and sell it (short) as soon as it reaches its high price peak, and that is exactly the point of the innovation that Alfred Winslow Jones made—taking long positions in stocks that are expected to appreciate and short positions in stocks that are expected to decline.
Financial Data and Datasets
Finance data belongs to time series data. A time series is a series of data points indexed in time. Usually, a time series is a sequence taken at successive, equally spaced points in time: a sequence of discrete-time data. Examples of time series are heights of ocean tides, counts of sunspots, and the daily closing value of the Dow Jones Industrial Average.
Historical data in this context is time series data from the past. It is one of the most important and the most valuable parts for speculating about future prices. There are some publicly available datasets online, but usually, that data doesn’t contain a lot of features—it’s usually 1-day interval data, 1-hour interval data, or 1-minute interval data.
Datasets with richer features and on smaller time intervals are usually not publicly available and can be very expensive to obtain. Smaller intervals mean more time series data in a fixed period—in one year there are 365 (or 366) days, so there are a maximum of 365 (or 366) data points available. Each day has 24 hours, so in one year there are 8,760 (or 8,784) hourly data points available, and each day has 86,400 minutes, so in one year there are 525,600 (or 527,040) minute data points available.
With more data, more information is available, and with more information, it is possible to make better conclusions about what will happen in the next time period—assuming, of course, that the data consists of a good enough feature to generalize well. The stock price data from 2007-2008, at the height of the global financial crisis, is biased and probably not relevant for making price predictions these days. With a smaller time interval, it is easier to predict what will happen next because of a lot of data points in a fixed interval. It is easier to predict what will happen in the next nanosecond if we have all the data points for every nanosecond in a fixed n-year interval than what will happen on the stock market next year if we have all n data points for every year in a fixed n-year interval.
However, that doesn’t mean that, assuming a rapid series of short-term predictions is right, the long-term prediction should also be right. Each prediction introduces error and, by chaining multiple predictions, the long-term prediction will contain a significant amount of error in the end and will be useless. Below is an example of 1-day interval data for Google shares scraped online from Yahoo Finance.

There are just a few columns in the dataset: Date, Open, High, Low, and Close—respectively, the price at which a security first trades on the opening of an exchange, the highest price that the security achieved on a given trading day, the lowest price achieved on a given trading day, and the final price at which a security is traded that day.
Usually, there are two more columns in such datasets—Adjusted Close and Volume, but they are not relevant here. Adjusted Close is the closing price after adjustments for applicable splits and dividend distributions, while Volume is the number of shares traded in the market during a given period of time.
You can see that some of the dates are missing. These are the days when the stock exchange is not working, usually during the weekends and holidays. For the purpose of our deep learning algorithm demonstration, the missing days are supplemented with the previously available price. For example, close prices for 2010-01-16, 2010-01-17, 2010-01-18 will all be 288.126007 because that’s what it was on 2010-01-15. It is important for our algorithm that the data be without gaps so we don’t confuse it. The deep learning algorithm could learn from here when the weekends and holidays are—e.g., it will learn that after five working days, there must be two days with flat prices from the last working day.

This is a chart of Google share price movements since 2010-01-04. Note that only trading days are used to plot the graph.
What Is Deep Learning?
Deep learning is a part of machine learning, and it’s based on learning data representations. Machine learning examines algorithms whose functionality is not programmed but learned from the data. It is essentially an approach to artificial intelligence.
Deep learning has been applied to various fields: computer vision, speech recognition, natural language processing, machine translation—and in some of these tasks, it has achieved performance superior to humans.
A deep neural network is at the center of deep learning. The most simple and basic example of a deep neural network is a feedforward neural network. Below is an image of a simple feedforward neural network. It consists of the input and the output layers and hidden layers.

Hidden layers are all layers between input and output layers. We say that a neural network is deep if it has more than one hidden layer. Each layer is made up of various numbers of neurons. Layers in this basic feedforward neural network are called linear layers—neurons in the linear layer only multiply values of 1-D (or 2-D if the data is sent through the network in batches) inputs with appropriate weight, sum products together, and give the final result as the 1-D or 2-D output.
The activation function is usually applied in feedforward networks to introduce nonlinearities so the network can model more complex, nonlinear problems. In feedforward networks, data flows from the input layer to the output layer without looping back. Connections between the neurons are weighted. Weights need to be adjusted so that the neural network returns correct outputs for the given inputs. The feedforward network maps data from the input space to the output space. Hidden layers extract important and more abstract features from the features of the previous layer.
The general deep learning pipeline is the same as the machine learning pipeline and consists of the following steps:
- Data collection. Data is separated into three parts—training data, validation data, and test data.
- Training the DNN using the training data over a number of “epochs” (each consisting of a number of iterations) and validation after each epoch using the validation data.
- Testing the model (one instance of a neural network with fixed parameters) after the sequence of training sessions and validations.
Training the neural network actually means adjusting the weights between the pairs of neurons by minimizing the loss function using a backpropagation algorithm in a combination with the stochastic gradient descent. Except for weights which are determined through the learning process, deep learning algorithms usually require setting the hyperparameters—parameters that are not learned but fixed prior to learning. Hyperparameters are number of layers, number of neurons in layers, types of layers, types of neurons, and weight initialization.
There are hardware restrictions in the setting of hyperparameters; currently it is not physically possible to set a trillion of neurons on a single GPU. The second problem for exhaustive hyperparameter search is combinatorial explosion; it is not possible to search through all possible combinations of hyperparameters because it would take infinite time. Because of that, hyperparameters are set randomly or using some heuristics and well-known examples that are described in scientific papers—one of the hyperparameters used for financial data analysis shown later in this blog post is the usage of recurrent neurons, as scientists and engineers have proved that they work well with time series data. Usually, the best way to see if the hyperparameters for a given problem are good or not is through experiments.
The point of training is to make neural networks fit the training data. Both model validation, which is done after each training step, and model testing, which is done after whole training procedure, is done to see if the model can generalize well. Generalization means that the neural network can make good predictions on new, unseen data.
There are two important terms related to model selection: overfitting and underfitting. If a neural network is too complex regarding the data it is trained on—if it has too many parameters (too many layers, and/or too many neurons in layers)—the neural network can overfit the data. It can adjust to the training data well because it has more than enough capacity to fit all the data, but then the performance on validation and test sets is poor.
If the neural network is too simple regarding the data it is trained on, the neural network can underfit the data. In that case, the neural network has poor performance on training, validation, and test sets because its capacity is not good enough to fit the training data and to generalize. On the image below, those terms are explained graphically. The blue line represents what is modeled by the neural network. The first image shows the situation when there are few neural network parameters, not enough to fit the training data and to generalize. The second image shows the situation when there is the optimal number of parameters and the neural network can generalize well on unseen data, and the third image shows the situation when the number of parameters of a neural network is too large and the neural network can perfectly fit all the data from the training set, but it has poor performance on the validation and test sets.

Recurrent Neural Networks
A more complicated version of a neural network is a recurrent neural network. In recurrent neural networks, data can flow in any direction, as opposed to feedforward neural networks. They can learn time series dependencies well. The architecture of a general recurrent neural network is shown in the image below.

On the image below is shown one recurrent neuron. It takes X_{t}, point in time t, as an input and returns h_{t}, hidden state in time t, as an output. The hidden output is propagated back to the neuron. The recurrent neuron can be unrolled as it is shown on the same image from the right side. X_{t_0} is point in time period t_{0}, X_{t_1} in time period t_{1}, and X_{t} in time period t. Outputs obtained using inputs X_{t_0}, X_{t_1}, …, X_{t_n} in time periods t_{0}, t_{1}, …, t_{n} are so-called hidden outputs: h_{t_0}, h_{t_1}, …, h_{t_n}, respectively.

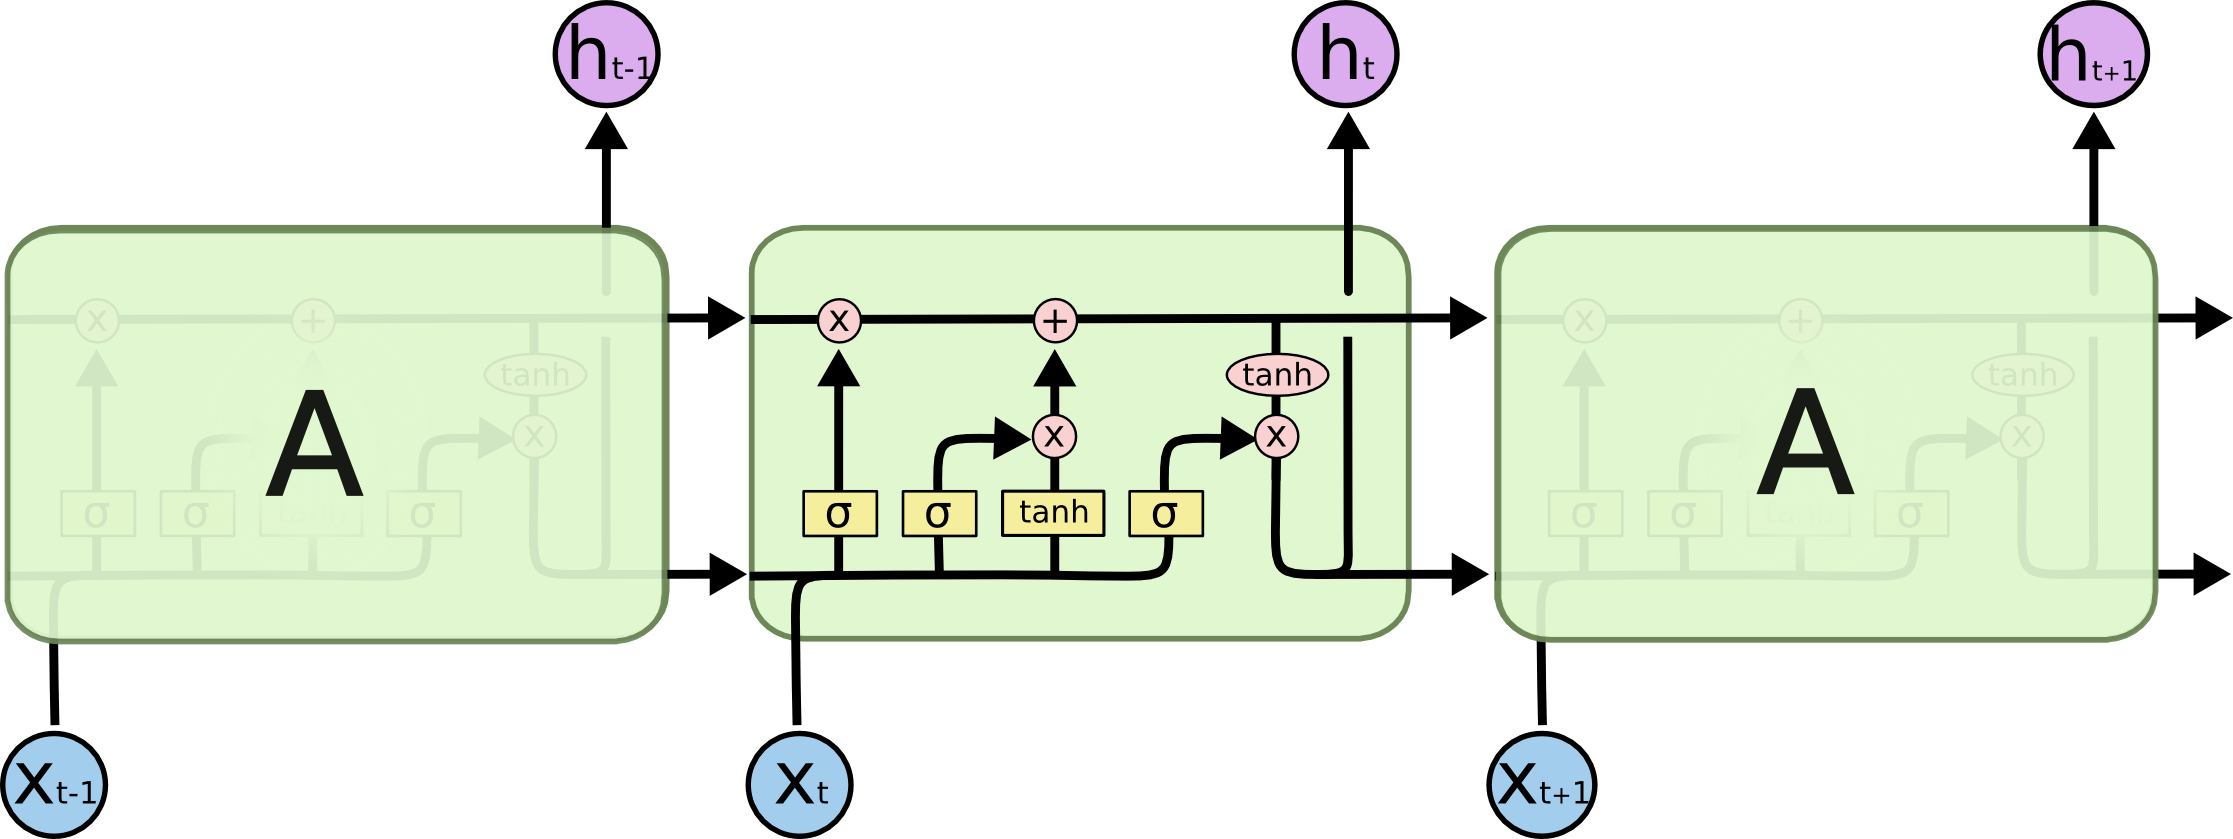
One of the best recurrent neural network architectures is LSTM architecture. LSTM is shown below:

LSTMs have the same general structure as general recurrent neural networks, but the recurrent neuron is a little bit different with a more complex structure. It can be seen from the image above that a lot of computation is done inside one LSTM cell. LSTM cells can be observed as a black box in the context of this post, but for more curious readers, this great blog post explains computations inside LSTMs and a lot more.
Let us call the input for the neural network a “feature vector.” It is an n-dimensional vector whose elements are features: f_{0}, f_{1}, f_{2} …, f_{n}.
\vv{X} = [f_{0}, f_{1}, f_{2}, …, f_{n}]
Now, let’s explain how recurrent neural networks can be applied to a finance-related task. Input for the recurrent neural network is [X_{t_0}, X_{t_1}, X_{t_2}, …, X_{t_n}]. Let’s say that n = 5. We take five Google Close share prices from five consecutive days (see the table with Open/High/Low/Close data above) between, let’s say, 2010-01-04 and 2010-01-08, i.e., [[311.35], [309.98], [302.16], [295.13], [299.06]]. The feature vector in this example is one-dimensional. The time sequence consists of five such feature vectors. Outputs of the recurrent neural network are hidden features [h_{t_0}, h_{t_1}, h_{t_2}, …, h_{t_n}]. Those features are on a more abstract level than the input features [X_{t_0}, X_{t_1}, X_{t_2}, …, X_{t_n}]—LSTM should learn the important parts of the input features and project them to the hidden features space. Those hidden, abstract features can be propagated in the next LSTM cell, which will give the next set of hidden, more abstract features which can then again be propagated to the next LSTM, and so on. After the sequence of chained LSTMs, the final component of the neural network is the linear layer (the building part of the simple feedforward network explained in the previous section) which maps hidden features from the last LSTM to the point in one dimensional space, and that point is the final output of the network—the predicted Close price in the time period X_{t+1}. The ground truth in this example for X_{t+1} is 298.61.
Note: There can also be as few as one LSTM—setting the number of LSTMs is a hyperparameter, which is generally found empirically, although we can use some heuristics. If the data is not so complex, we use less complex architecture so the model does not overfit the data. If the data is complex, we use a complex model so the model does not underfit the data.
In the training phase, predicted Close prices are being compared with the ground truth prices, and the difference between predicted Close prices and ground truth prices is minimized using a backpropagation algorithm and gradient descent optimization algorithm (or one of its forms—concretely, in this blog, the so-called “Adam” version of a gradient descent optimization algorithm is used) by changing the neural network’s weights.
After the training and testing, in the future, the user just needs to give input data to the neural network and it will return the predicted price (and hopefully, a price very close to the ground truth price from the future).
One more thing to mention here is that, usually, batches of data are sent through the network, both in training in testing phases, for the network to compute multiple outputs in only one pass.
Below is an image of an architecture used in this blog for experiments. It consists of two stacked LSTMs and one linear layer.

Experiments With Hedge Fund Algorithms
Try using algorithmic trading strategies that simple, as follows: If the algorithm predicts that the price will go up the next day, then buy n (n = 1 in this example) shares of a company (long), otherwise sell all shares of a company (short). The initial value of the portfolio (the value of cash and shares combined) is set to be $100,000. Each long or short action will buy n shares of a company (Google, in this example) or sell all shares of a company, respectively. In the beginning, the system possesses 0 shares of a given company.
Always remember that this is a very basic and simple example, not meant for use in the real world, as a lot more R&D work would be needed to tweak the model to work well in practice. Some things are neglected here that should be considered in a real-world scenario; for example, transaction fees are not incorporated in the model. It is assumed that the system can trade exactly at the same time every day, and it is assumed that every day, even on a weekend or holiday, is a trading day.
For testing, a backtesting method is used. The backtesting method uses historical data to reconstruct trades that would have occurred in the past using the rules defined with the strategy that is developed. The dataset is split into two parts—the first part is the training set (past) and the second part is the testing set (future). The model is trained on a training set and, after training, we simulate the future on the second part of the dataset to see how the trained model would have behaved in the future without being trained on it.
The metric to evaluate the trading strategy is the Sharpe ratio (its annualized version, assuming all days in a year are trading days, and the year has 365 days: sqrt(365)*mean(returns)/std(returns)), where the return is defined as p_{t}/p_{t-1} - 1, and p_{t} is the price in time period t. The Sharpe ratio shows the ratio between the returns and the additional risk that is incurred, so it is good to have a larger Sharpe ratio. Ordinarily, a ratio greater than 1 is acceptable by investors, 2 is very good, and 3 is excellent.
Only the Close price each day, of Google historical prices from the Yahoo Finance dataset, is used as a feature. More features will help, but it is out of the scope of this blog to test which other features from the dataset (Open, High, Low) are important. Some other features not included in the table could also be helpful—for example, the sentiment of the news in a particular minute or important happenings on a particular day. However, it is sometimes very hard to make data representations that are useful for neural network input and combine them with existing features. For example, it is easy to extend the feature vector and put a number that represents news sentiment or Trump’s tweet sentiment (-1 very negative, 0 neutral, +1 very positive, etc.) for each given time period, but it is not so easy to put particular event-driven moments (pirates in the Suez canal, bomb in a refinery in Texas) in the feature vector because, for each specific moment, we will need to have an additional element in the feature vector to put 1 if the event happened or 0 otherwise, which will lead to infinite numbers of elements for all possible moments.
For that more difficult data, we could define some categories and, for each moment, determine to which category it belongs. We could also add features from other companies’ shares for a system to learn the correlation between different companies’ share prices. Also, there is a type of neural network specialized for computer vision—convolutional neural networks—which would be interesting to combine with recurrent layers and see how visual features correlate with the prices of some companies. Maybe we could use the camera’s feed from a crowded train station as a feature and attach that feed to a neural network and see whether what the neural network sees is correlated with the stock prices of some companies—there could be some hidden knowledge even in that banal and absurd example.
Below is a graph which shows how the average training loss is decreasing over time, which means that the neural network has enough capacity to fit the training data. It is important to say that the data needs to be normalized so the deep learning algorithm can converge.

Below is a graph which shows how average test loss is decreasing over time, which means that the neural network has the ability to generalize on unseen data.

The algorithm is greedy; if it predicted that the price will go up the next day, then the algorithm immediately buys n=1 share of a company (if enough cash is in the portfolio), and otherwise, it sells all shares of the company (if it has any). The investing period is fixed and takes 300 days. After 300 days, all shares are sold. The simulation on unseen data, after some training, can be seen below. It is shown how the portfolio value is increasing over time by long/short (or do nothing) actions each day.

The Sharpe ratio for the simulation above is 1.48. The final portfolio value after 300 days is $100,263.79. If we just bought shares on the first day and sold them after 300 days, the portfolio would be worth $99,988.41.
Shown below is a situation where the neural network is not trained well and loses money after a fixed period of 300 days.

The Sharpe ratio is -0.94. The final portfolio value after 300 days is $99,868.36.
Here is one interesting example—the above algorithm is greedy and just predicts the price for the next day, taking action based on that prediction alone. It is possible to chain multiple predictions and predict the price in the next few steps in the future. For example, with a first input of [X_ground_truth_{t0}, X_ground_truth_{t1}, X_ground_truth_{t2}, X_ground_truth_{t3}, X_ground_truth_{t4}] and the first output being [X_predicted_{t5}], we can feed the neural network with that prediction so that the next input is [X_ground_truth_{t1}, X_ground_truth_{t2}, X_ground_truth_{t3}, X_ground_truth_{t4}, X_predicted_{t5}] and the output is [X_predicted_{t6}]. The next input from there is [X_ground_truth_{t2}, X_ground_truth_{t3}, X_ground_truth_{t4}, X_predicted_{t5}, X_predicted_{t6}] which results in [X_predicted_{t7}], and so on. The problem here is that we are introducing a prediction error that increases with each new step and finally ending up with very bad long-term result, as shown on the image below. The prediction in the beginning follows the ground truth decreasing trend and then stagnates and becomes worse and worse over time.

A very simple deep learning analysis was done on Google share prices, but it can incorporate almost any set of financial data, provided the amount of data is large enough and is of a good quality. The data must be discriminative and must describe and represent the problem well.
Wrapping Up
If it worked and generalized well on extensive tests, this system could allow hedge fund managers to speculate about the future prices of shares of a company using deep learning and relying on algorithmic trading strategies.
Hedge fund managers could give the system an amount of money to automatically trade every day. However, it would be very bad to let automated trading algorithms trade without any supervision. The hedge fund manager should have some deep learning skills or employ someone with the necessary skills to supervise the system and determine when the system has lost the ability to generalize and trade well.
If the system lost the ability to generalize, then it would be necessary to retrain it from the beginning and test it again (maybe by introducing more discriminative features or new knowledge—using new data from the past that didn’t exist when the model was first trained).
Sometimes, the data is simply not good enough for the deep learning system to be trained and generalize well and, in that case, an experienced deep learning engineer should be able to detect and rectify such a situation. To build a deep learning trading system, you need hedge funds data scientists, machine learning/deep learning experts (both scientists and engineers), R&D engineers familiar with machine learning/deep learning, etc. No matter which part of an application of machine learning they are familiar with, whether it’s computer vision or speech recognition, seasoned professionals will be able to put their experience to good use in the financial sector. At its root, deep learning has the same basics regardless of application or industry, and it should be easy for someone experienced to switch from theme to theme.
The system we presented is very basic and, to be applied in the real world, more R&D should be done in order to increase the returns. Possible improvements of the system could be in developing better trading strategies. Collecting more data for training, which is usually very expensive, will help. A smaller time interval between the points is better. Improvements can also surface in using more features (e.g., news sentiments or important happenings corresponding to each point in the dataset, despite being hard to code for a neural network) and extensive grid search for hyperparameters and RNN architecture discovery.
Also, more computing power (powerful GPUs are a must) is needed to make a lot of extensive experiments in parallel and to process a large amount of data, provided that a large amount of data is collected.
References:
- https://www.datacamp.com/community/tutorials/finance-python-trading
- http://colah.github.io/posts/2015-08-Understanding-LSTMs/
- https://en.wikipedia.org
- https://www.investopedia.com/
- https://finance.yahoo.com/
- http://pytorch.org/
Author’s Note: I would like to thank Ivan Čapalija and Matej Paradžik for the constructive conversations and advice about deep learning in finance, which helped me in writing this blog.
Further Reading on the Toptal Blog:
- Forex Algorithmic Trading: A Practical Tale for Engineers
- The Rise Of Automated Trading: Machines Trading the S&P 500
- A Deep Learning Tutorial: From Perceptrons to Deep Networks
- Embeddings in Machine Learning: Making Complex Data Simple
- Bridgewater’s Ray Dalio: Quiet Pioneer of Big Data, Machine Learning, and Fintech
Understanding the basics
Hedge funds raise funds from their investors and place them in short-term and long-term investments, or in different financial products to maximize profit. Hedge funds rely on various types of investment strategies, trying to make money by exploiting market inefficiencies.
Algorithmic trading is a method of using computers in order to make profits automatically using the rules that are inferred from machine learning models or handwritten rules.
Deep learning is a part of machine learning that learns data representations. Finance is money management. Deep learning in finance is the application of deep learning technologies in the finance field.

Zagreb, Croatia
Member since September 27, 2017
About the author
Co-founder of Poze and CEO of an AI R&D/consulting company, Neven has an MCS degree and has built a face-recognition system in TensorFlow.