
Hunting and Analyzing High CPU Usage in .NET Applications
Software performance in production is hard to analyze. Things can go wrong at any time, and code can start executing in ways that weren’t planned for. In these cases, what do we do? In this article, Toptal engineer Juan Pablo Scida analyzes a real scenario of high CPU usage of a web application. He covers all the processes and .NET code analysis involved to identify the problem, explains how the problem was solved, and most importantly, explores why this problem happened in the first place.

Software performance in production is hard to analyze. Things can go wrong at any time, and code can start executing in ways that weren’t planned for. In these cases, what do we do? In this article, Toptal engineer Juan Pablo Scida analyzes a real scenario of high CPU usage of a web application. He covers all the processes and .NET code analysis involved to identify the problem, explains how the problem was solved, and most importantly, explores why this problem happened in the first place.

Juan is a software architect with more than 10 years of experience. He is a certified .NET and Java developer, and loves Node.js and Erlang.
Expertise
Previously At

Software development can be a very complicated process. We as developers need to take a lot of different variables into account. Some are not under our control, some are unknown to us in the moment of the actual code execution, and some are directly controlled by us. And .NET developers are no exception to this.
Given this reality, things usually go as planned when we work in controlled environments. An example is our development machine, or an integration environment, which we have full access to. In these situations, we have at our disposal tools for analyzing different variables that are affecting our code and software. In these cases, we also don’t have to deal with heavy loads of the server or concurrent users trying to do the same thing at the same time.
In described and safe situations, our code will work fine, but in production under heavy load or some other external factors, unexpected problems could occur. Software performance in production is hard to analyze. Most of the time, we have to deal with potential problems in a theoretical scenario: we know that a problem can happen, but we can not test it. That’s why we need to base our development on the best practices and documentation for the language that we are using, and avoid common mistakes.
As mentioned, when software goes live, things could go wrong, and code could start executing in a way we didn’t plan. We could end up in a situation where we have to deal with problems without the ability to debug or know for sure what is going on. What can we do in this case?

In this article, we are going to analyze a real case scenario of high CPU usage of a .NET web application on a Windows-based server, processes involved to identify the problem, and more importantly, why this problem happened in the first place and how we solved it.
CPU usage and memory consumption are widely discussed topics. Usually, it is very difficult to know for certain what the right amount of resources (CPU, RAM, I/O) a specific process should use, and for how long. Although one thing is sure—if a process is using more than 90% of the CPU for an extended period of time, we are in trouble just because of the fact that the server will not be able to process any other request under these circumstances.
Does this mean that there is a problem with the process itself? Not necessarily. It could be that the process needs more processing power, or it is handling a lot of data. For a start, the only thing we can do is try to identify why this is happening.
All the operating systems have several different tools for monitoring what is going on in a server. Windows servers specifically have the task manager, Performance Monitor, or, in our case, we used New Relic, which is a great tool for monitoring servers.
First Symptoms and Problem Analysis
After we deployed our application, during a time lapse of the first two weeks, we started seeing that the server had CPU usage peaks, which made the server unresponsive. We had to restart it in order to make it available again, and this event happened three times during that time frame. As I mentioned before, we used New Relic as a server monitoring platform, and it showed that the w3wp.exe process was using 94% of the CPU at the time the server crashed.
An Internet Information Services (IIS) worker process is a Windows process (w3wp.exe) that runs Web applications and is responsible for handling requests sent to a Web Server for a specific application pool. An IIS server can have several application pools (and several different w3wp.exe processes), which could be generating the issue. Based on the user that the process had (this was shown in New Relic reports), we identified that the problem was our .NET C# Web Forms application.
The .NET Framework is tightly integrated with Windows debugging tools, so the first thing we tried to do was look at the event viewer and application log files to find some useful information about what was going on. Whether we had some exceptions logged in the event viewer, they did not provide enough data to analyze. That’s why we decided to take a step further and to collect more data, so when the event arose again, we would be prepared.
Data Collection
Since our application was hosted on IIS as a .NET Framework application, we used Debug Diagnostic Tools (DebugDiag) to collect and analyze memory dumps from the IIS worker process. DebugDiag provides tools for both data collection and analysis, making it well-suited to this type of investigation. Developers working with modern .NET applications often use tools such as dotnet-counters and dotnet-dump for similar troubleshooting scenarios, but the investigative approach is largely the same.
So, let’s begin to define rules for collecting data with Debug Diagnostic Tools:
-
Open DebugDiag Collection and select
Performance.

- Select
Performance Countersand clickNext. - Click
Add Perf Triggers. - Expand the
Processor(not theProcess) object and select% Processor Time. Note that if you are on Windows Server 2008 R2 and you have more than 64 processors, please choose theProcessor Informationobject instead of theProcessorobject. - In the list of instances, select
_Total. - Click
Addand then clickOK. -
Select the newly added trigger and click
Edit Thresholds.
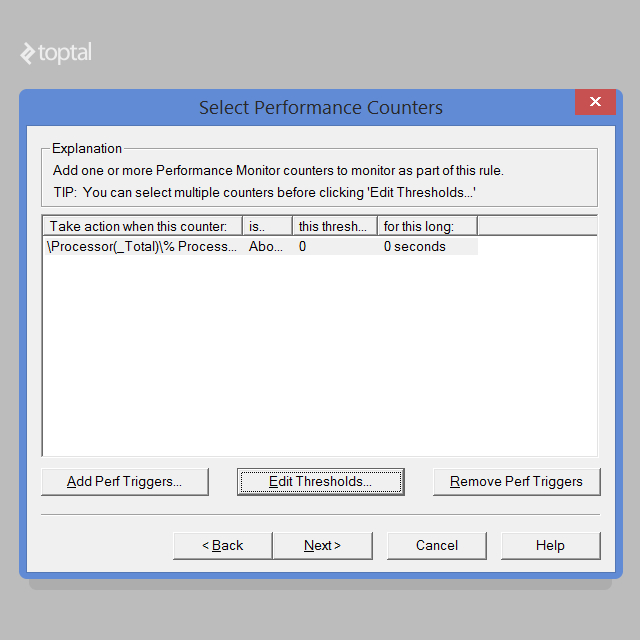
- Select
Abovein the dropdown. - Change the threshold to
80. -
Enter
20for the number of seconds. You can adjust this value if needed, but be careful not to specify a small number of seconds in order to prevent false triggers.
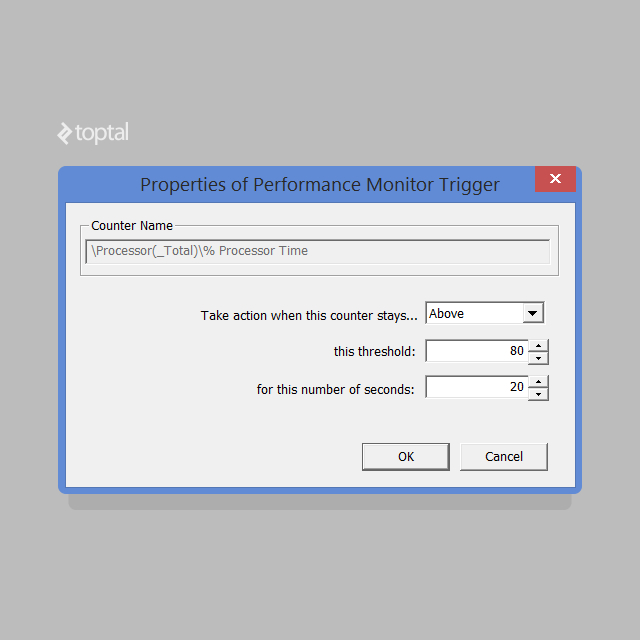
- Click
OK. - Click
Next. - Click
Add Dump Target. - Select
Web Application Poolfrom the dropdown. - Select your application pool from the list of app pools.
- Click
OK. - Click
Next. - Click
Nextagain. - Enter a name for your rule if you wish and make note of the location where the dumps will be saved. You can change this location if desired.
- Click
Next. - Select
Activate the Rule Nowand clickFinish.


The described rule will create a set of minidump files that will be fairly small in size. The final dump will be a dump with full memory, and that dump will be much larger. Now, we only need to wait for the high CPU event to happen again.
Once we have the dump files in the selected folder, we will use DebugDiag Analysis tool in order to analyze the collected data:
-
Select Performance Analyzers.

-
Add the dump files.
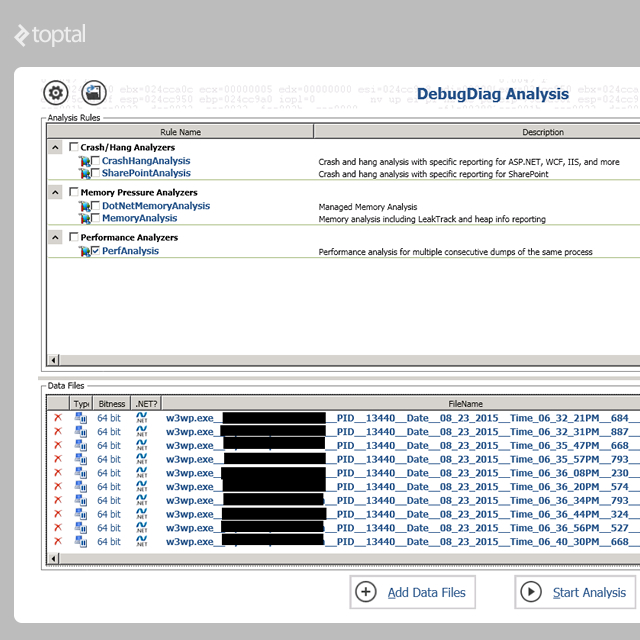
-
Start Analysis.
DebugDiag will take a few (or several) minutes to parse through the dumps and provide an analysis. When it has completed the analysis, you will see a web page with a summary and a lot of information regarding threads, similar to the following one:
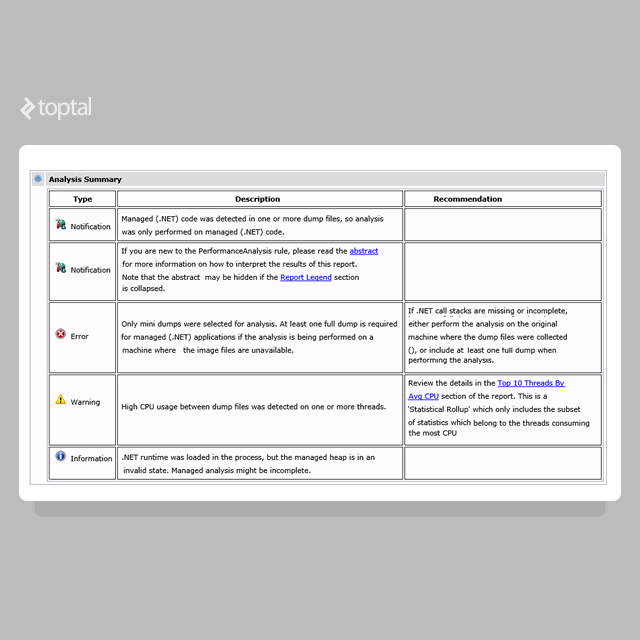


As you can see in the summary, there is a warning that says “High CPU usage between dump files was detected on one or more threads.” If we click on the recommendation, we will start understanding where the problem is with our application. Our example report looks like this:

As we can see in the report, there is a pattern regarding CPU usage. All threads that have high CPU usage are related to the same class. Before jumping to the code, let’s take a look at the first one.

This is the detail for the first thread with our problem. The part that’s interesting to us is the following:

Here we have a call to our code GameHub.OnDisconnected() which triggered the problematic operation, but before that call, we have two Dictionary calls, which may give an idea of what is going on. Let’s take a look at the .NET code to see what that method is doing:
public override Task OnDisconnected() {
    	try
    	{
        	var userId = GetUserId();
        	string connId;
        	if (onlineSessions.TryGetValue(userId, out connId))
            	onlineSessions.Remove(userId);
    	}
    	catch (Exception)
    	{
        	// ignored
    	}

    	return base.OnDisconnected();
    	}
We obviously have a problem here. The call stack of the reports said that the problem was with a Dictionary, and in this code, we are accessing a dictionary, and specifically, the line that is causing the issue is this one:
if (onlineSessions.TryGetValue(userId, out connId))
This is the dictionary declaration:
static Dictionary<int, string> onlineSessions = new Dictionary<int, string>();
What is the problem with this .NET code?
Everyone who has object-oriented programming experience knows that static variables will be shared by all the instances of this class. Let’s take a deeper look at what static means in the .NET world.
According to the .NET C# specification: “Use the static modifier to declare a static member, which belongs to the type itself rather than to a specific object.”
In practical terms, static members belong to the type rather than any individual object, and only one copy exists regardless of how many instances of the class are created. Because that single copy is shared across the application, multiple threads may attempt to access it concurrently.
Given the fact that a web environment is a multithreaded environment, because every request is a new thread that is spawned by the w3wp.exe process, and given that the static members are part of the process, we may have a scenario in which several different threads try to access the data of static (shared by several threads) variables, which may eventually lead to multithreading problems.
The Dictionary documentation notes that the collection can support multiple concurrent readers as long as it is not being modified. When multiple threads need to read from and write to the same dictionary, developers must provide their own synchronization.
This helps explain why we may have encountered this problem. Based on the dump information, the issue was occurring within the dictionary FindEntry method:
If we look at the dictionary FindEntry implementation, we can see that the method iterates through the internal structure (buckets) in order to find the value.
So the following .NET code is accessing a shared dictionary without synchronization, which is not a thread-safe operation.
public override Task OnDisconnected() {
    	try
    	{
        	var userId = GetUserId();
        	string connId;
        	if (onlineSessions.TryGetValue(userId, out connId))
            	onlineSessions.Remove(userId);
    	}
    	catch (Exception)
    	{
        	// ignored
    	}

    	return base.OnDisconnected();
	}
Conclusion
As we saw in the dumps, there are several threads trying to iterate and modify a shared resource (static dictionary) at the same time, which eventually caused the iteration to enter an infinite loop, causing the thread to consume more than 90% of the CPU.
This kind of issue isn’t unique to Web Forms or even to .NET Framework. Any multithreaded .NET application, including ASP.NET Core, can run into the same problem if a shared static collection isn’t properly synchronized.
There are several possible solutions for this problem. The one we implemented first was to lock and synchronize access to the dictionary at the cost of losing performance. The server was crashing every day at that time, so we needed to fix this as soon as possible. Even if this was not the optimal solution, it solved the issue.
The next step in solving this problem would be to analyze the code and to find the optimal solution for this. Refactoring the code is one option. Replacing the shared Dictionary<TKey,TValue> with a ConcurrentDictionary<TKey,TValue> could help address the thread-safety issues while maintaining better performance under concurrent access. Although this is a significant change, further analysis would still be required to determine the best long-term solution.
Further Reading on the Toptal Blog:
- How to Boot-strap and Create .NET Projects
- How to Improve ASP.NET App Performance in Web Farm With Caching
- A .NET Programmer’s Guide to CancellationToken
- .NET Unit Testing: Spend Upfront to Save Later On
- An Elasticsearch Tutorial for .NET Developers
- An Expert Workaround for Executing Complex Entity Framework Core Stored Procedures

Juan Pablo Scida
Córdoba, Argentina
Member since August 7, 2014
About the author
Juan is a software architect with more than 10 years of experience. He is a certified .NET and Java developer, and loves Node.js and Erlang.
Expertise
PREVIOUSLY AT