
SQL Server Performance Tuning: A Practical Guide for Developers
Database tuning can be an incredibly difficult task, particularly when working with large-scale data where even the most minor change can have a dramatic (positive or negative) impact on performance.
In mid-sized and large companies, most database tuning will be handled by a Database Administrator (DBA). But there are plenty of developers who have to perform DBA-like tasks; meanwhile, DBAs often struggle to work well with developers.
In this article, learn database tuning tips and how developers and DBAs can work together effectively.

Kevin has 20+ years among full-stack, desktop, and indie game development. He lately specializes in PostgreSQL, JavaScript, Perl, and Haxe.
Expertise
SQL performance tuning can be an incredibly difficult task, particularly when working with large-scale data where even the most minor change can have a dramatic (positive or negative) impact on performance. In SQL Server environments, those challenges become even more visible as workloads grow, more users interact with the database simultaneously, and teams need clearer ways to measure and diagnose performance problems.
In mid-sized and large companies, most SQL performance tuning will be handled by a Database Administrator (DBA). But believe me, there are plenty of developers out there who have to perform DBA-like tasks. Further, in many of the companies I’ve seen that do have DBAs, they often struggle to work well with developers—the positions simply require different modes of problem solving, which can lead to disagreement among coworkers.
On top of that, corporate structure can also play a role. Say the DBA team is placed on the 10th floor with all of their databases, while the devs are on the 15th floor, or even in a different building under a completely separate reporting structure. It’s certainly hard to work together smoothly under these conditions.
In this article, I’d like to accomplish three things:
- Provide developers with some developer-side SQL performance tuning techniques.
- Show how tools like execution plans, DMVs, and Query Store can help measure performance and identify bottlenecks before deeper infrastructure tuning is needed.
- Explain how developers and DBAs can work together effectively.
Measuring SQL Server Performance
Before changing queries, adding indexes, or rewriting parts of an application, it’s important to understand where the time and resources are actually being spent. Performance tuning without measurement often leads to unnecessary changes or improvements in the wrong part of the system.
In SQL Server, performance is typically measured by CPU usage, memory usage, disk I/O, and wait time. Wait time is particularly important because it shows where SQL Server is being forced to pause, whether due to locking, disk access, memory pressure, or other resource constraints. Even well-written queries can perform poorly if the server is under heavy load or waiting on limited resources.
For developers, the key idea is to establish a baseline and identify the slowest or most expensive queries before making changes. This is usually done using execution plans, Dynamic Management Views (DMVs), and monitoring tools, which help identify long-running queries, high I/O operations, and blocking or concurrency issues. Once the main bottlenecks are identified, tuning efforts can focus on the queries, indexes, or schema design that will have the greatest impact. The sections that follow cover the key tools and techniques for doing exactly that.
Using SQL Server Tools to Diagnose Performance Problems
SQL Server provides several built-in tools that developers can use to identify performance problems without needing deep infrastructure access.
Dynamic Management Views (DMVs)
Dynamic Management Views are system views built into SQL Server that expose real-time data about query execution, resource consumption, and wait statistics. For developers, the most useful DMVs are those that help identify which queries are consuming the most resources.
The following query uses sys.dm_exec_query_stats and sys.dm_exec_sql_text to find the most expensive queries by average CPU time:
SELECT TOP 20
    total_worker_time / execution_count AS avg_cpu_time,
    execution_count,
    total_elapsed_time / execution_count AS avg_run_time,
    SUBSTRING(text,
              statement_start_offset / 2 + 1,
              (CASE WHEN statement_end_offset = -1
                    THEN LEN(CONVERT(nvarchar(max), text)) * 2
                    ELSE statement_end_offset
               END - statement_start_offset) / 2) AS query_text
FROM sys.dm_exec_query_stats qs
CROSS APPLY sys.dm_exec_sql_text(qs.sql_handle) st
ORDER BY avg_cpu_time DESC;
When reviewing results, pay attention to queries with high execution counts and moderate average run times – these often have a larger cumulative impact on performance than queries that run rarely but take longer.
sys.dm_exec_requests shows currently running queries and their wait types, which is useful for diagnosing active blocking or long-running operations in real time.
Activity Monitor and Third-Party Tools
Activity Monitor, built into SQL Server Management Studio, provides a live view of processor time, waiting tasks, database I/O, and recent expensive queries. It is a practical starting point for identifying bottlenecks without writing any queries.
For teams that need more persistent monitoring, tools such as SQL Sentry and SQL Diagnostic Manager offer historical data, alerting, and deeper visibility into query plan changes over time. These are typically managed at the DBA level, but developers benefit from understanding what they surface and how to interpret their output.
Query Design and Concurrency
SQL Server is rarely used by a single user at a time. In most production environments, many queries run simultaneously, and the way those queries are written directly affects how well the database handles that load.
When multiple queries access the same data simultaneously, SQL Server uses locking to maintain consistency. Poorly written queries that hold locks longer than necessary, perform unnecessary table scans, or return more data than needed can cause blocking, where one query is forced to wait for another to finish. Under high concurrency, this can compound quickly and degrade performance across the entire application.
Developers can reduce concurrency-related problems at the query level by keeping transactions short and explicit, avoiding SELECT * in favor of retrieving only the columns needed, and ensuring that queries use indexes effectively to minimize scan operations. A query that performs a full table scan in isolation may seem acceptable, but under load it will hold locks longer and block other operations more frequently.
A Practical SQL Server Performance Tuning Workflow
Performance tuning is most effective when approached systematically. Rather than making changes based on intuition, developers can follow a repeatable process that moves from measurement to diagnosis to targeted improvement.
- Establish a baseline: before making any changes, capture current performance metrics using DMVs or Activity Monitor. Identify the queries with the highest CPU usage, longest average run time, or highest execution count. This baseline makes it possible to verify whether changes actually improve performance.
- Identify waits and blocking: use
sys.dm_exec_requeststo check for active blocking and long-running queries. Understanding what SQL Server is waiting on. - Review execution plans: for the queries identified in the previous steps, examine the actual execution plan in SSMS. Look for table scans, key lookups, and large discrepancies between estimated and actual row counts. These are the most common indicators of missing indexes or outdated statistics.
- Tune indexes and queries: apply targeted changes based on what the execution plan reveals. Add or adjust indexes, rewrite inefficient queries, and update statistics where needed. Make one change at a time so the impact of each change can be measured independently.
- Monitor for plan stability: after making changes, verify that SQL Server is using the expected execution plans. Query Store is useful here, as it tracks plan changes over time and can identify regressions. Developers should also be aware of the Query Tuning Assistant, a SQL Server feature that helps maintain plan stability when upgrading database compatibility levels, preventing performance regressions that can occur when the query optimizer behaves differently after an upgrade.
- Validate and repeat: compare results against the baseline established in step one. If performance has improved, document the change. If not, return to the execution plan and look deeper.
This workflow provides a framework for identifying where performance problems originate. In most cases, the diagnosis will point to one of two places: how queries are written, or how indexes are structured.
SQL Performance Tuning (in the Codebase): Indexes
If you’re a complete newcomer to databases and even asking yourself “What is SQL performance tuning?”, you should know that indexing is an effective way to tune your SQL database that is often neglected during development. In basic terms, an index is a data structure that improves the speed of data retrieval operations on a database table by providing rapid random lookups and efficient access of ordered records. This means that once you’ve created an index, you can select or sort your rows faster than before.
Indexes are also used to define a primary-key or unique index which will guarantee that no other columns have the same values. Of course, database indexing is a vast an interesting topic to which I can’t do justice with this brief description (but here’s a more detailed write-up).
If you’re new to indexes, I recommend using this diagram when structuring your queries:

Basically, the goal is to index the major searching and ordering columns.
Note that if your tables are constantly hammered by INSERT, UPDATE, and DELETE, you should be careful when indexing—you could end up decreasing performance as all indexes need to be modified after these operations.
Further, DBAs often drop their SQL indexes before performing batch inserts of million-plus rows to speed up the insertion process. After the batch is inserted, they then recreate the indexes. Remember, however, that dropping indexes will affect every query running in that table; so this approach is only recommended when working with a single, large insertion.
SQL Tuning: Execution Plans in SQL Server
The Execution Plan tool in SQL Server can be useful for creating indexes. Its main function is to graphically display the data retrieval methods chosen by the SQL Server query optimizer. If you’ve never seen them before, there’s a detailed walkthrough.
To retrieve the execution plan (in SQL Server Management Studio), just click “Include Actual Execution Plan” (CTRL + M) before running your query.
Afterwards, a third tab named “Execution Plan” will appear. You might see a detected missing index. To create it, just right click in the execution plan and choose the “Missing Index Details…”. It’s as simple as that!
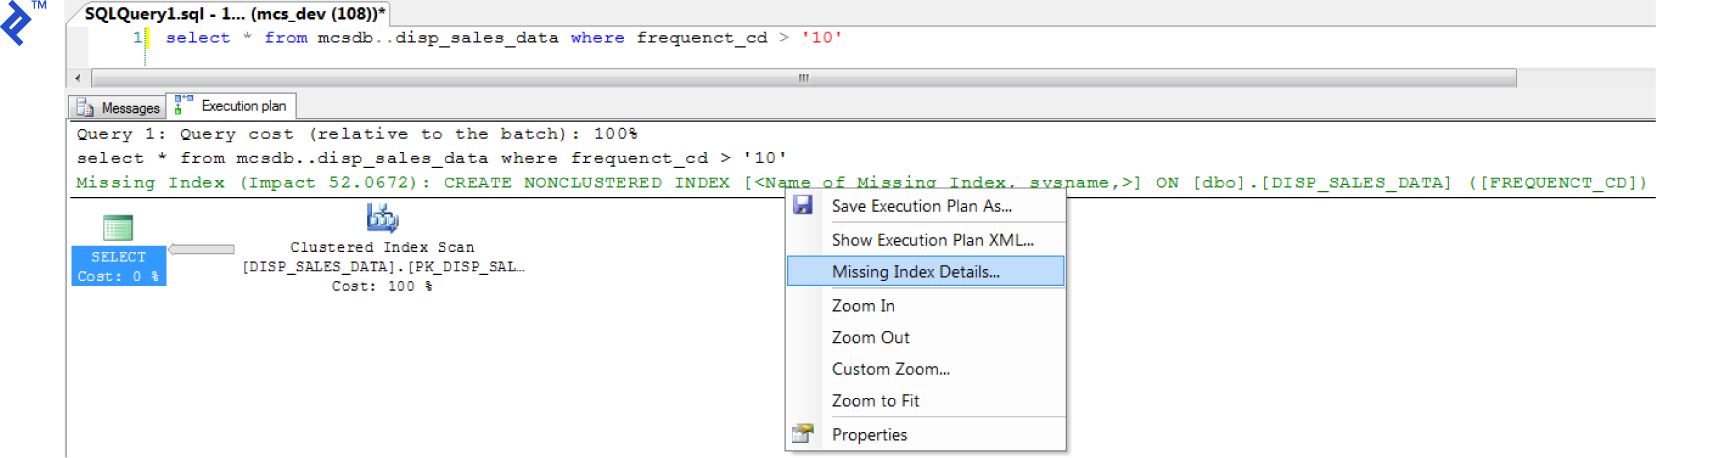
(Click to zoom)
It’s important to understand that execution plans are also measurement tools. They show where SQL Server is spending time and resources inside a query, including scans, lookups, joins, and sorts. When a query performs poorly, the execution plan usually shows which operation is responsible for the majority of the cost.
Developers should also be aware of the difference between estimated execution plans and actual execution plans. The estimated plan shows how SQL Server expects the query to run, while the actual plan shows what really happened when the query executed, including the real number of rows processed and the actual cost of each operation. Large differences between estimated and actual rows are often a sign of outdated statistics or poor indexing.
In SQL Server, Query Store can also be used to track execution plans over time and detect performance regressions when a plan changes. This is particularly useful in production environments where performance problems sometimes appear after deployments or data growth changes the optimizer’s decisions. While DBAs often manage Query Store, developers should understand how plan changes affect application performance and how to identify when a query has started using a worse execution plan than before.
SQL Server: Choosing the Right Index Type
Once it’s clear that a query can benefit from indexing, the next step is understanding what type of index to use and what trade-offs it introduces. In SQL Server, it’s important to understand the difference between clustered and nonclustered indexes. A clustered index defines the physical order of the data in a table, while nonclustered indexes provide alternative access paths to that data. Choosing the right type of index depends on how the data is queried and how frequently it is updated.
In many cases, performance can be improved by using covering indexes, which include all the columns needed to satisfy a query without requiring additional lookups. This reduces the number of reads and can significantly improve performance for frequently executed queries.
However, indexes come with trade-offs. While they can greatly improve read performance, they add overhead to write operations such as INSERT, UPDATE, and DELETE. In high-load environments, excessive or poorly chosen indexes can slow down write-heavy workloads and increase contention. For this reason, indexing strategies should balance read efficiency with the cost of maintaining those indexes under load.
SQL Tuning: Avoid Coding Loops
Imagine a scenario in which 1000 queries hammer your database in sequence. Something like:
for (int i = 0; i < 1000; i++)
{
    SqlCommand cmd = new SqlCommand("INSERT INTO TBL (A,B,C) VALUES...");
    cmd.ExecuteNonQuery();
}
You should avoid such loops in your code. For example, we could transform the above snippet by using a unique INSERT or UPDATE statement with multiple rows and values:
INSERT INTO TableName (A,B,C) VALUES (1,2,3),(4,5,6),(7,8,9) -- SQL SERVER 2008

INSERT INTO TableName (A,B,C) SELECT 1,2,3 UNION ALL SELECT 4,5,6 -- SQL SERVER 2005

UPDATE TableName SET A = CASE B
        WHEN 1 THEN 'NEW VALUE'
        WHEN 2 THEN 'NEW VALUE 2'
        WHEN 3 THEN 'NEW VALUE 3'
    END
WHERE B in (1,2,3)
Make sure that your WHERE clause avoids updating the stored value if it matches the existing value. Such a trivial optimization can dramatically increase SQL query performance by updating only hundreds of rows instead of thousands. For example:
UPDATE TableName
SET A = @VALUE
WHERE
      B = 'YOUR CONDITION'
            AND A <> @VALUE -- VALIDATION
SQL Tuning: Avoid Correlated SQL Subqueries
A correlated subquery is one which uses values from the parent query. This kind of SQL query tends to run row-by-row, once for each row returned by the outer query, and thus decreases SQL query performance. New SQL developers are often caught structuring their queries in this way—because it’s usually the easy route.
Here’s an example of a correlated subquery:
SELECT c.Name,
       c.City,
       (SELECT CompanyName FROM Company WHERE ID = c.CompanyID) AS CompanyName
FROM Customer c
In particular, the problem is that the inner query (SELECT CompanyName…) is run for each row returned by the outer query (SELECT c.Name…). But why go over the Company again and again for every row processed by the outer query?
A more efficient SQL performance tuning technique would be to refactor the correlated subquery as a join:
SELECT c.Name,
       c.City,
       co.CompanyName
FROM Customer c
	LEFT JOIN Company co
		ON c.CompanyID = co.CompanyID
In this case, we go over the Company table just once, at the start, and JOIN it with the Customer table. From then on, we can select the values we need (co.CompanyName) more efficiently.
SQL Tuning: Select Sparingly
One of my favorite SQL optimization tips is to avoid SELECT *! Instead, you should individually include the specific columns that you need. Again, this sounds simple, but I see this error all over the place. Consider a table with hundreds of columns and millions of rows—if your application only really needs a few columns, there’s no sense in querying for all the data. It’s a massive waste of resources. (For more issues, see here.)
For example:
SELECT * FROM Employees
vs.
SELECT FirstName, City, Country FROM Employees
If you really need every column, explicitly list every column. This isn’t so much a rule, but rather, a means of preventing future system errors and additional SQL performance tuning. For example, if you’re using an INSERT... SELECT... and the source table has changed via the addition of a new column, you might run into issues, even if that column isn’t needed by the destination table, e.g.:
INSERT INTO Employees SELECT * FROM OldEmployees

Msg 213, Level 16, State 1, Line 1
Insert Error: Column name or number of supplied values does not match table definition.
To avoid this kind of error from SQL Server, you should declare each column individually:
INSERT INTO Employees (FirstName, City, Country)
SELECT Name, CityName, CountryName
FROM OldEmployees
Note, however, that there are some situations where the use of SELECT * could be appropriate. For example, with temp tables—which leads us to our next topic.
SQL Tuning: The Wise Use of Temporary Tables (#Temp)
Temporary tables usually increase a query’s complexity. If your code can be written in a simple, straightforward manner, I’d suggest avoiding temp tables.
But if you have a stored procedure with some data manipulation that cannot be handled with a single query, you can use temp tables as intermediaries to help you to generate a final result.
When you have to join a large table and there are conditions on said table, you can increase database performance by transferring your data in a temp table, and then making a join on that. Your temp table will have fewer rows than the original (large) table, so the join will finish faster!
The decision isn’t always straightforward, but this example will give you a sense for situations in which you might want to use temp tables:
Imagine a customer table with millions of records. You have to make a join on a specific region. You can achieve this by using a SELECT INTO statement and then joining with the temp table:
SELECT * INTO #Temp FROM Customer WHERE RegionID = 5
SELECT r.RegionName, t.Name FROM Region r JOIN #Temp t ON t.RegionID = r.RegionID
(Note: some SQL developers also avoid using SELECT INTO to create temp tables, saying that this command locks the tempdb database, disallowing other users from creating temp tables. Fortunately, this is fixed in 7.0 and later.)
As an alternative to temp tables, you might consider using a subquery as a table:
SELECT r.RegionName, t.Name FROM Region r
JOIN (SELECT * FROM Customer WHERE RegionID = 5) AS t
ON t.RegionID = r.RegionID
But wait! There’s a problem with this second query. As described above, we should only be including the columns we need in our subquery (i.e., not using SELECT *). Taking that into account:
SELECT r.RegionName, t.Name FROM Region r
JOIN (SELECT Name, RegionID FROM Customer WHERE RegionID = 5) AS t
ON t.RegionID = r.RegionID
All of these SQL snippets will return the same data. But with temp tables, we could, for example, create an index in the temp table to improve performance. There’s some good discussion here on the differences between temporary tables and subqueries.
Finally, when you’re done with your temp table, delete it to clear tempdb resources, rather than just wait for it to be automatically deleted (as it will be when your connection to the database is terminated):
DROP TABLE #temp
SQL Tuning: “Does My Record Exist?”
This SQL optimization technique concerns the use of EXISTS(). If you want to check if a record exists, use EXISTS() instead of COUNT(). While COUNT() scans the entire table, counting up all entries matching your condition, EXISTS() will exit as soon as it sees the result it needs. This will give you better performance and clearer code.
IF (SELECT COUNT(1) FROM EMPLOYEES WHERE FIRSTNAME LIKE '%JOHN%') > 0
    PRINT 'YES'
vs.
IF EXISTS(SELECT FIRSTNAME FROM EMPLOYEES WHERE FIRSTNAME LIKE '%JOHN%')
    PRINT 'YES'
SQL Server Performance Tuning (in Managed Cloud Environments)
Increasingly, development teams work with SQL Server in managed cloud environments such as Azure SQL Database or Azure SQL Managed Instance. These platforms automate several tasks that would otherwise require manual DBA intervention, and developers should understand how that changes their responsibilities.
In managed environments, routine maintenance tasks such as index rebuilding, statistics updates, and even some aspects of query plan optimization are handled automatically. Azure SQL Database, for example, includes automatic tuning features that can detect and apply index recommendations, and revert changes if they don’t improve performance. This reduces the operational burden on development teams but does not eliminate the need for good query design and indexing decisions at the code level.
Developers working in these environments should be aware that the performance levers available to them are different from those in on-premises SQL Server. Some server-level configuration options are unavailable or abstracted away, which means query design, indexing strategy, and schema decisions carry even more weight. Understanding what the platform manages automatically and what still requires developer attention is the key to tuning effectively in a PaaS environment.
SQL Performance Tuning (in the Office)
SQL database administrators (DBAs) and developers often clash over data- and non-data-related issues. Drawn from my experience, here are some tips (for both parties) on how to get along and work together effectively.

Database Optimization for Developers:
-
If your application stops working suddenly, it may not be a database issue. For example, maybe you have a network problem. Investigate a bit before you accuse a DBA!
-
Even if you’re a ninja SQL data modeler, ask a DBA to help you with your relational diagram. They have a lot to share and offer.
-
DBAs don’t like rapid changes. This is natural: they need to analyze the database as a whole and examine the impact of any changes from all angles. A simple change in a column can take a week to be implemented—but that’s because an error could materialize as huge losses for the company. Be patient!
-
Do not ask SQL DBAs to make data changes in a production environment. If you want access to the production database, you have to be responsible for all your own changes.
Database Optimization for SQL Server DBAs:
-
If you don’t like people asking you about the database, give them a real-time status panel. Developers are always suspicious of a database’s status, and such a panel could save everyone time and energy.
-
Help developers in a test/quality assurance environment. Make it easy to simulate a production server with simple tests on real-world data. This will be a significant time-saver for others as well as yourself.
-
Developers spend all day on systems with frequently-changed business logic. Try to understand this world being more flexible, and be able to break some rules in a critical moment.
-
SQL databases evolve. The day will come when you have to migrate your data to a new version. Developers count on significant new functionality with each new version. Instead of refusing to accept their changes, plan ahead and be ready for the migration.
Further Reading on the Toptal Blog:
Understanding the basics
Database management systems like SQL Server have to translate the SQL queries you give them into the actual instructions they have to perform to read or change the data in the database. After processing, the database engine then also attempts to automatically optimize the query where possible.
Query optimization is when a developer, or the database engine, changes a query in such a way that SQL Server is able to return the same results more efficiently. Sometimes it’s a simple as using EXISTS() instead of COUNT(), but other times the query needs to be rewritten with a different approach.
Performance tuning includes query optimization, SQL client code optimization, database index management, and in another sense, better coordination between developers and DBAs.
An index tracks a targeted subset of a table’s data so that selecting and ordering can be done much faster, without the server having to look through every last bit of data for that table.
EXISTS() stops processing as soon as it finds a matching row, whereas COUNT() has to count every row, regardless of whether you actually need that detail in the end.
Bergerac, France
Member since January 31, 2017
About the author
Kevin has 20+ years among full-stack, desktop, and indie game development. He lately specializes in PostgreSQL, JavaScript, Perl, and Haxe.