Efficiency at Scale: A Tale of AWS Cost Optimization
Understanding total spend is a common challenge for cloud users, especially on projects with complex pricing models. This article explores the top AWS cost optimizations that will help you scale your platform effectively.
Understanding total spend is a common challenge for cloud users, especially on projects with complex pricing models. This article explores the top AWS cost optimizations that will help you scale your platform effectively.
Rudolf is a data scientist who has architected big data processing infrastructures on AWS and implemented data engineering solutions for Fortune 500 companies, including Disneyland Hong Kong and Philip Morris. He was invited to participate in NASA’s 2021 International Space Apps Challenge as a speaker and judge.
Expertise
PREVIOUSLY AT

I recently launched a cryptocurrency analysis platform, expecting a small number of daily users. However, when some popular YouTubers found the site helpful and published a review, traffic grew so quickly that it overloaded the server, and the platform (Scalper.AI) became inaccessible. My original AWS EC2 environment needed extra support. After considering multiple solutions, I decided to use AWS Elastic Beanstalk to scale my application. Things were looking good and running smoothly, but I was taken aback by the costs in the billing dashboard.
This is not an uncommon issue. A survey from 2021 found that 82% of IT and cloud decision-makers have encountered unnecessary cloud costs, and 86% don’t feel they can get a comprehensive view of all their cloud spending. Though Amazon offers a detailed overview of additional expenses in its documentation, the pricing model is complex for a growing project. To make things easier to understand, I’ll break down a few relevant optimizations to reduce your cloud costs.
Why I Chose AWS
The goal of Scalper.AI is to collect information about cryptocurrency pairs (the assets swapped when trading on an exchange), run statistical analyses, and provide crypto traders with insights about the state of the market. The technical structure of the platform consists of three parts:
- Data ingestion scripts
- A web server
- A database
The ingestion scripts gather data from different sources and load it to the database. I had experience working with AWS services, so I decided to deploy these scripts by setting up EC2 instances. EC2 offers many instance types and lets you choose an instance’s processor, storage, network, and operating system.
I chose Elastic Beanstalk for the remaining functionality because it promised smooth application management. The load balancer properly distributed the burden among my server’s instances, while the autoscaling feature handled adding new instances for an increased load. Deploying updates became very easy, taking just a few minutes.
Scalper.AI worked stably, and my users no longer faced downtime. Of course, I expected an increase in spending since I added extra services, but the numbers were much larger than I had predicted.
How I Could Have Reduced Cloud Costs
Looking back, there were many areas of complexity in my project’s use of AWS services. We’ll examine the budget optimizations I discovered while working with common AWS EC2 features: burstable performance instances, outbound data transfers, elastic IP addresses, and terminate and stop states.
Burstable Performance Instances
My first challenge was supporting CPU power consumption for my growing project. Scalper.AI’s data ingestion scripts provide users with real-time information analysis; the scripts run every few seconds and feed the platform with the most recent updates from crypto exchanges. Each iteration of this process generates hundreds of asynchronous jobs, so the site’s increased traffic necessitated more CPU power to decrease processing time.
The cheapest instance offered by AWS with four vCPUs, a1.xlarge, would have cost me ~$75 per month at the time. Instead, I decided to spread the load between two t3.micro instances with two vCPUs and 1GB of RAM each. The t3.micro instances offered enough speed and memory for the job I needed at one-fifth of the a1.xlarge’s cost. Nevertheless, my bill was still larger than I expected at the end of the month.
In an effort to understand why, I searched Amazon’s documentation and found the answer: When an instance’s CPU usage falls below a defined baseline, it collects credits, but when the instance bursts above baseline usage, it consumes the previously earned credits. If there are no credits available, the instance spends Amazon-provided “surplus credits.” This ability to earn and spend credits causes Amazon EC2 to average an instance’s CPU usage over 24 hours. If the average usage goes above the baseline, the instance is billed extra at a flat rate per vCPU-hour.
I monitored the data ingestion instances for multiple days and found that my CPU setup, which was intended to cut costs, did the opposite. Most of the time, my average CPU usage was higher than the baseline.
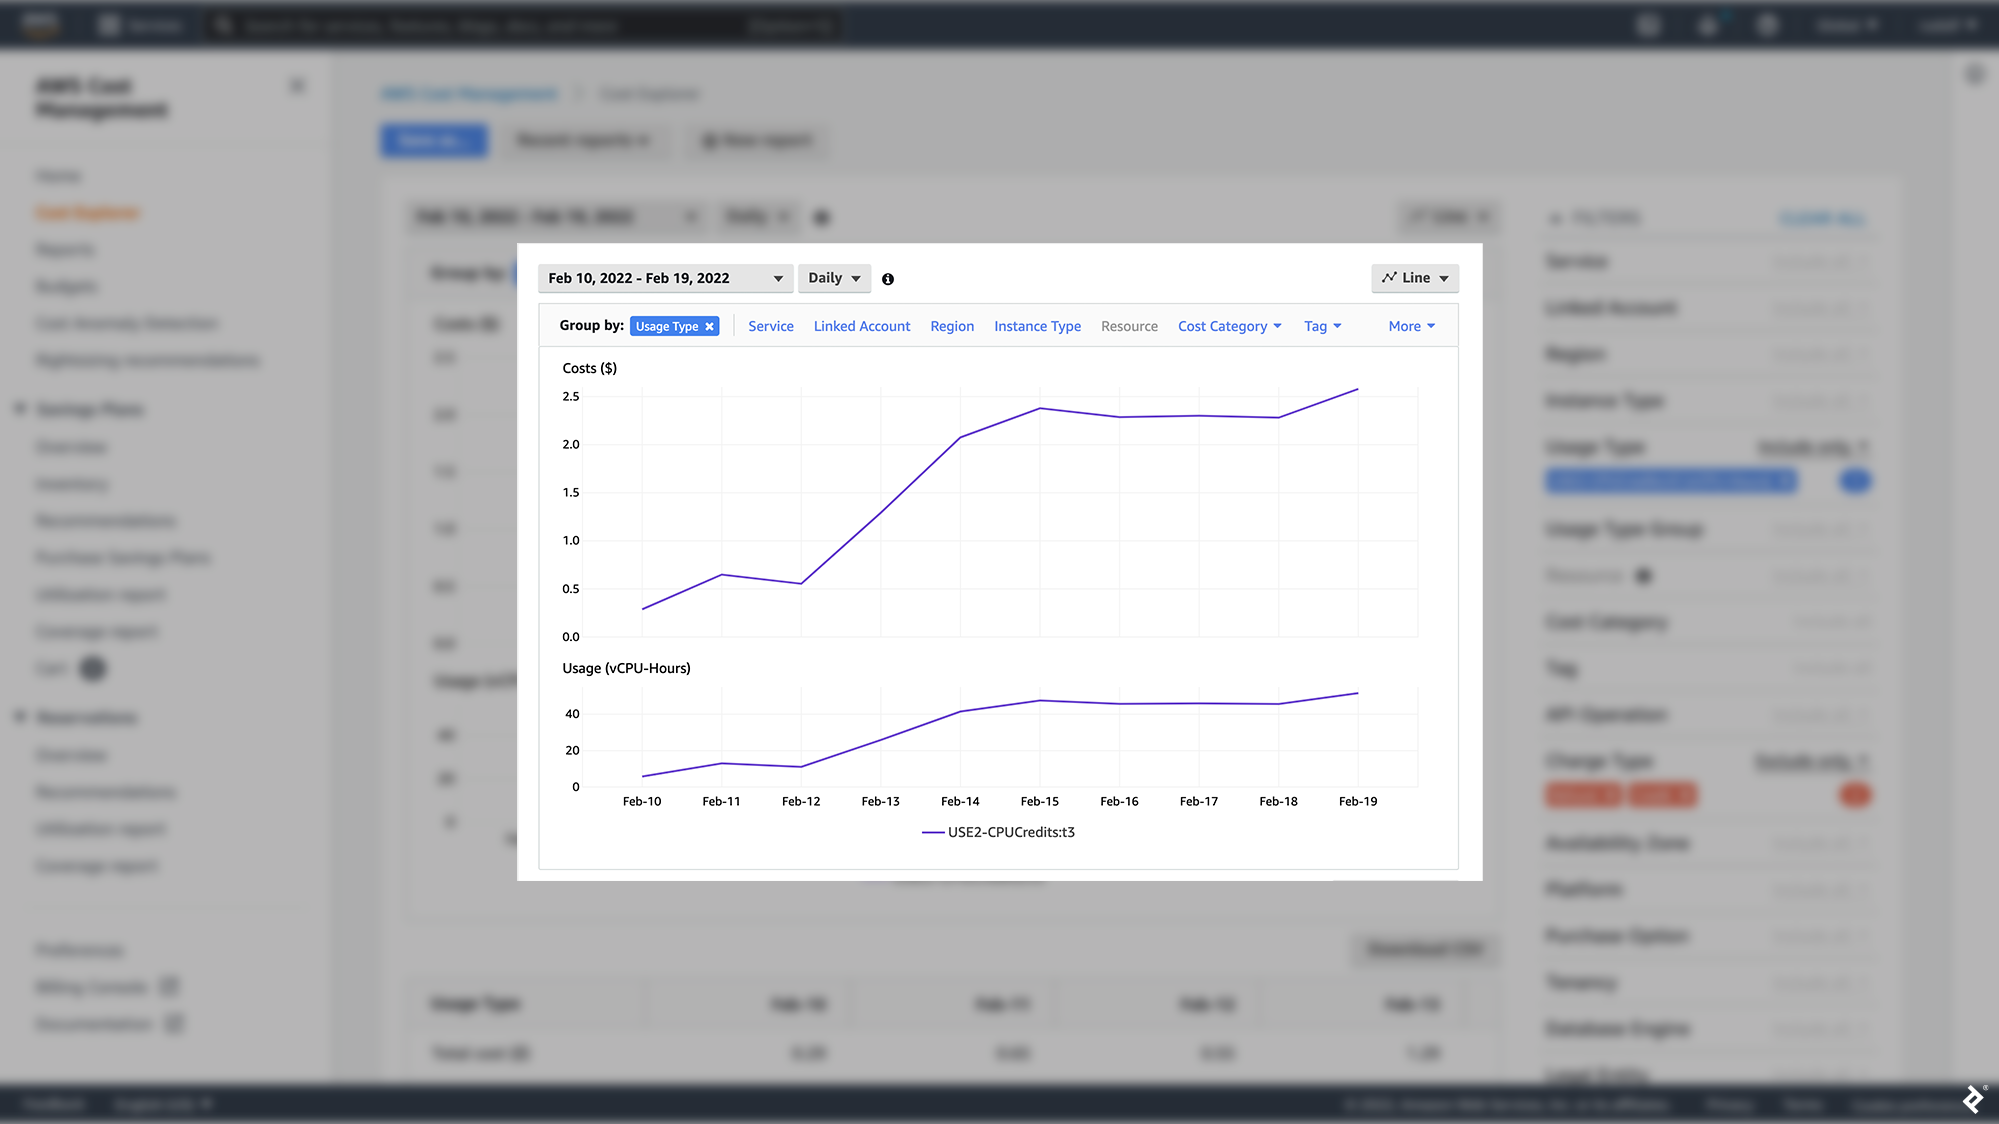
I had initially analyzed CPU usage for a few crypto pairs; the load was small, so I thought I had plenty of space for growth. (I used just one micro-instance for data ingestion since fewer crypto pairs did not require as much CPU power.) However, I realized the limitations of my original analysis once I decided to make my insights more comprehensive and support the ingestion of data for hundreds of crypto pairs—cloud service analysis means nothing unless performed at the correct scale.
Outbound Data Transfers
Another result of my site’s expansion was increased data transfers from my app due to a small bug. With traffic growing steadily and no more downtime, I needed to add features to capture and hold users’ attention as soon as possible. My newest update was an audio alert triggered when a crypto pair’s market conditions matched the user’s predefined parameters. Unfortunately, I made a mistake in the code, and audio files loaded into the user’s browser hundreds of times every few seconds.
The impact was huge. My bug generated audio downloads from my web servers, causing additional outbound data transfers. A tiny error in my code resulted in a bill almost five times larger than the previous ones. (This wasn’t the only consequence: The bug could cause a memory leak in the user’s computer, so many users stopped coming back.)
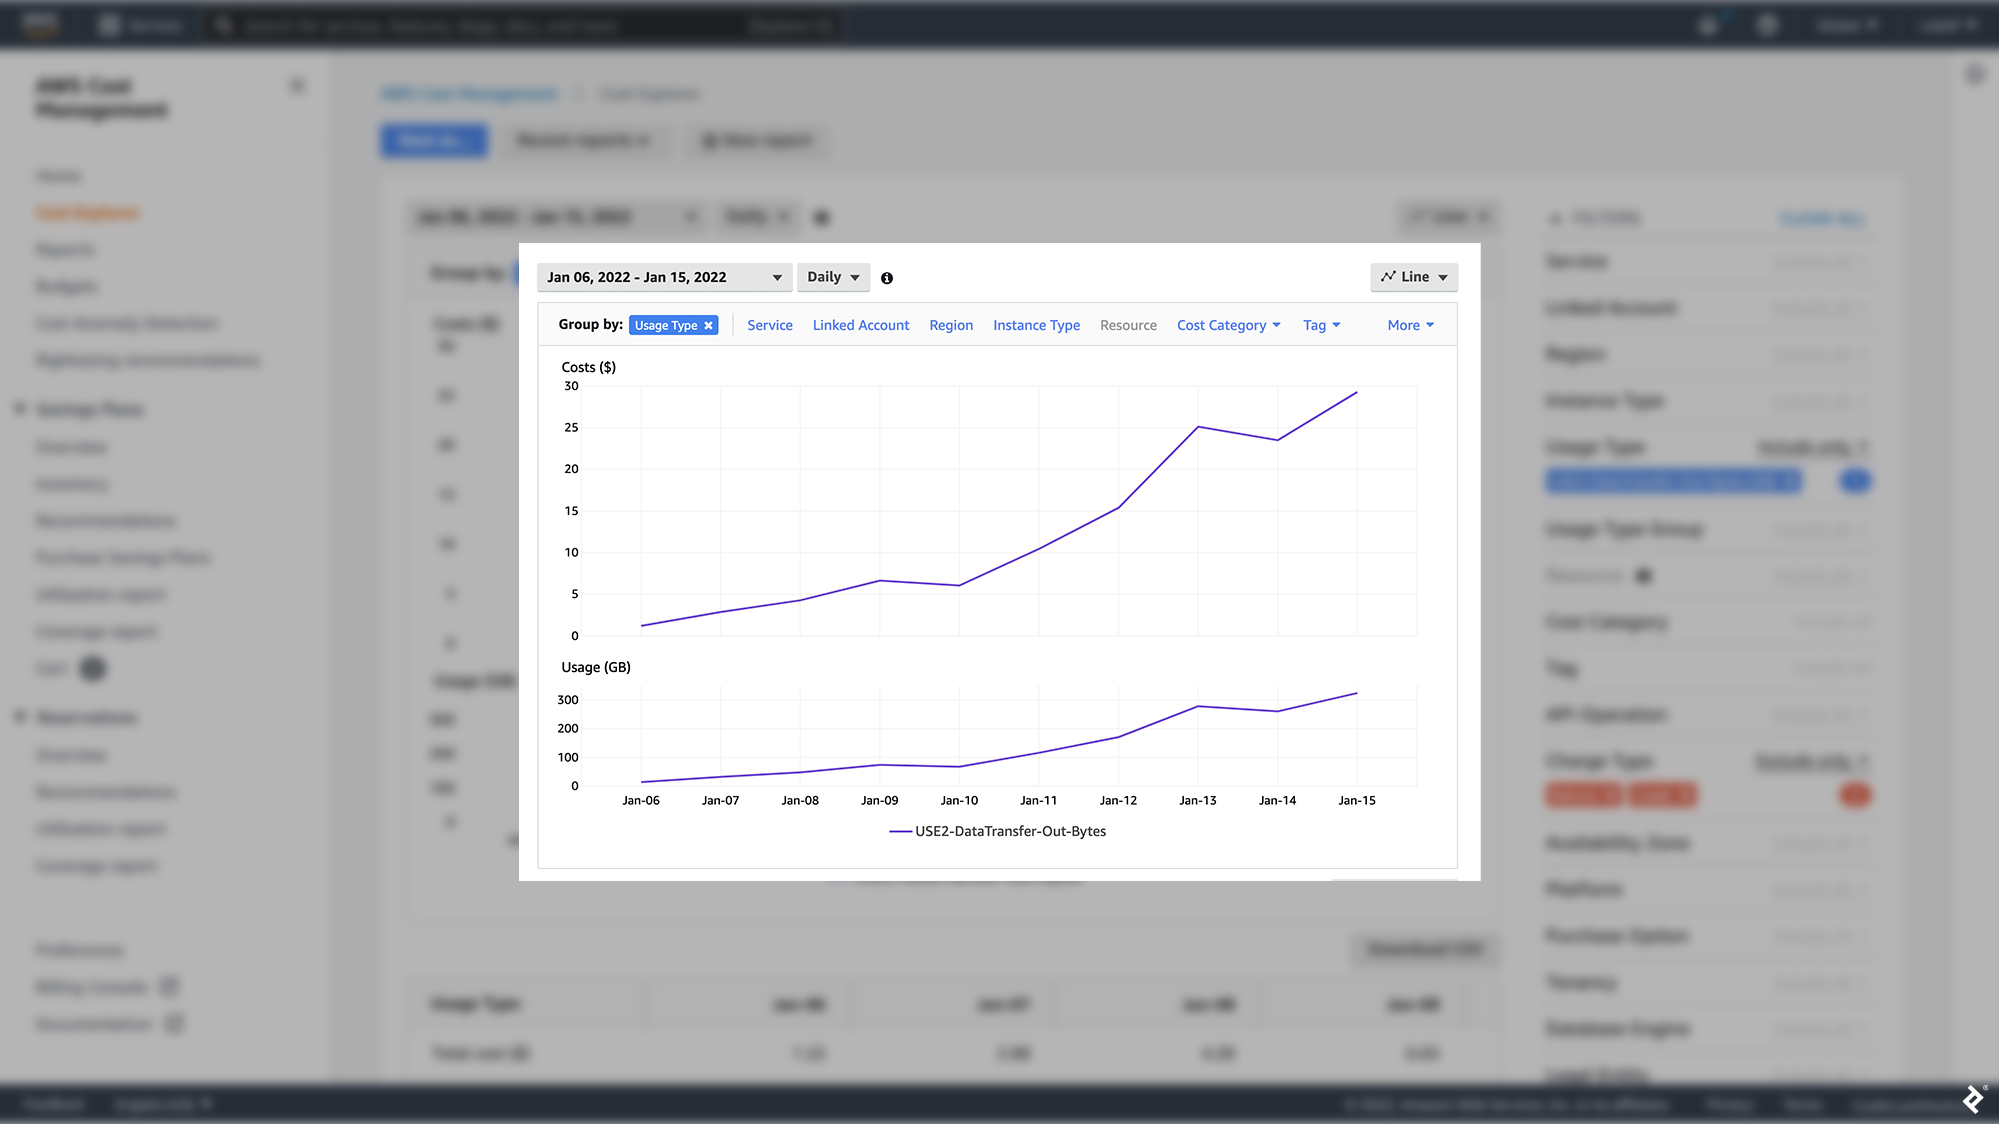
Data transfer costs can account for upward of 30% of AWS price surges. EC2 inbound transfer is free, but outbound transfer charges are billed per GB ($0.09 per GB when I built Scalper.AI). As I learned the hard way, it is important to be cautious with code affecting outbound data; reducing downloads or file loading where possible (or carefully monitoring these areas) will protect you from higher fees. These pennies add up quickly since charges for transferring data from EC2 to the internet depend on the workload and AWS Region-specific rates. A final caveat unknown to many new AWS customers: Data transfer becomes more expensive between different locations. However, using private IP addresses can prevent extra data transfer costs between different availability zones of the same region.
Elastic IP Addresses
Even when using public addresses such as Elastic IP addresses (EIPs), it is possible to lower your EC2 costs. EIPs are static IPv4 addresses used for dynamic cloud computing. The “elastic” part means that you can assign an EIP to any EC2 instance and use it until you choose to stop. These addresses let you seamlessly swap unhealthy instances with healthy ones by remapping the address to a different instance in your account. You can also use EIPs to specify a DNS record for a domain so that it points to an EC2 instance.
AWS provides only five EIPs per account per region, making them a limited resource and costly with inefficient use. AWS charges a low hourly rate for each additional EIP and bills extra if you remap an EIP more than 100 times in a month; staying under these limits will lower costs.
Terminate and Stop States
AWS provides two options for managing the state of running EC2 instances: terminate or stop. Terminating will shut down the instance, and the virtual machine provisioned for it will no longer be available. Any attached Elastic Block Store (EBS) volumes will be detached and deleted, and all data stored locally in the instance will be lost. You will no longer be charged for the instance.
Stopping an instance is similar, with one small difference. The attached EBS volumes are not deleted, so their data is preserved, and you can restart the instance at any time. In both cases, Amazon no longer charges for using the instance, but if you opt for stopping instead of terminating, the EBS volumes will generate a cost as long as they exist. AWS recommends stopping an instance only if you expect to reactivate it soon.
But there’s a feature that can enlarge your AWS bill at the end of the month even if you terminated an instance instead of stopping it: EBS snapshots. These are incremental backups of your EBS volumes stored in Amazon’s Simple Storage Service (S3). Each snapshot holds the information you need to create a new EBS volume with your previous data. If you terminate an instance, its associated EBS volumes will be deleted automatically, but its snapshots will remain. As S3 charges by the volume of data stored, I recommend that you delete these snapshots if you won’t use them shortly. AWS features the ability to monitor per-volume storage activity using the CloudWatch service:
- While logged into the AWS Console, from the top-left Services menu, find and open the CloudWatch service.
- On the left side of the page, under the Metrics collapsible menu, click on All Metrics.
- The page shows a list of services with metrics available, including EBS, EC2, S3, and more. Click on EBS and then on Per-volume Metrics. (Note: The EBS option will be visible only if you have EBS volumes configured on your account.)
- Click on the Query tab. In the Editor view, copy and paste the command
SELECT AVG(VolumeReadBytes) FROM "AWS/EBS" GROUP BY VolumeIdand then click Run. (Note: CloudWatch uses a dialect of SQL with a unique syntax.)
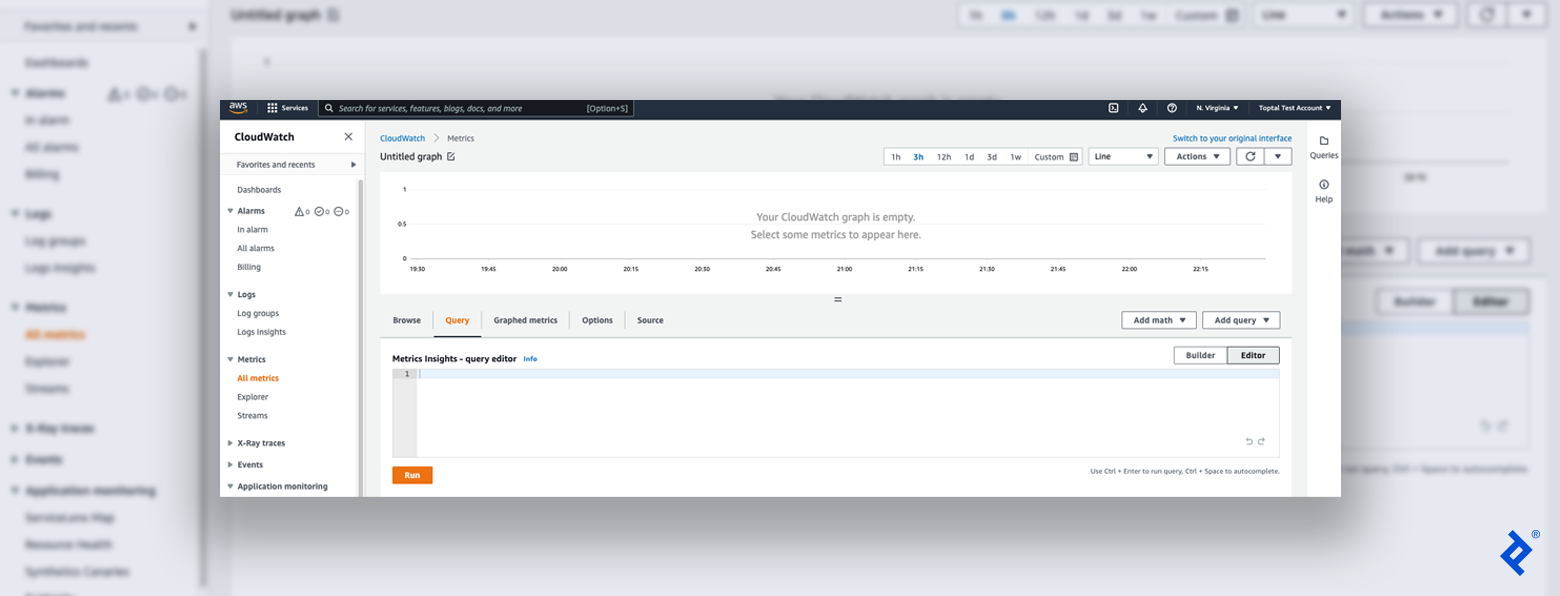
CloudWatch offers a variety of visualization formats for analyzing storage activity, such as pie charts, lines, bars, stacked area charts, and numbers. Using CloudWatch to identify inactive EBS volumes and snapshots is an easy step toward optimizing cloud costs.
Extra Money in Your Pocket
Though AWS tools such as CloudWatch offer decent solutions for cloud cost monitoring, various external platforms integrate with AWS for more comprehensive analysis. For example, cloud management platforms like VMWare’s CloudHealth show a detailed breakdown of top spending areas that can be used for trend analysis, anomaly detection, and cost and performance monitoring. I also recommend that you set up a CloudWatch billing alarm to detect any surges in charges before they become excessive.
Amazon provides many great cloud services that can help you delegate the maintenance work of servers, databases, and hardware to the AWS team. Though cloud platform costs can easily grow due to bugs or user errors, AWS monitoring tools equip developers with the knowledge to defend themselves from additional expenses.
With these cost optimizations in mind, you’re ready to get your project off the ground—and save hundreds of dollars in the process.
Further Reading on the Toptal Blog:
- Case Study: Why I Use AWS Cloud Infrastructure for My Products
- Principles of Organizational Design and Optimization: Lessons From The Great Recession
- Service-oriented Architecture With AWS Lambda: A Step-by-Step Tutorial
- Boost Your Productivity With Amazon Web Services
- Name Your Price: 4 Counterintuitive Pricing Strategy Tips
Understanding the basics
What are AWS burstable instances?
AWS burstable instances (also called burstable performance instances) allow short-term CPU use above a baseline level. In contrast, traditional instances offer fixed CPU resources.
Which EC2 instance type offers burstable performance?
The latest generation of burstable instances includes types T4g, T3a, and T3. The previous generation T2 type also offers burstable performance.
What is a terminated state in AWS?
The terminated state occurs once an AWS EC2 instance is shut down and no longer has a virtual machine. In this case, its EBS volumes are deleted, and all of the instance’s local data is permanently lost.
What happens when an EC2 instance is stopped and started again?
When an instance is stopped, the attached EBS volumes’ data persists, and the instance can be restarted at any time. Though Amazon doesn’t charge for stopped instances, the EBS volumes can generate charges as long as they exist.
What is the EC2 transfer cost?
For inbound EC2 data transfers, there is no cost. However, outbound data transfers are charged based on the AWS Regions involved.
What are the four best practices of cost optimization in AWS?
Best practices for AWS cost optimization include: purchasing reserved EC2 instances and savings plans, deleting unattached EBS volumes, deleting obsolete EBS snapshots, and releasing unattached Elastic IP addresses.
Which AWS services can assist you with cost optimization?
Amazon CloudWatch and AWS Cost Explorer can help optimize AWS costs. CloudHealth by VMWare is an external option that offers AWS support.
Rudolf Eremyan
Tbilisi, Georgia
Member since August 2, 2018
About the author
Rudolf is a data scientist who has architected big data processing infrastructures on AWS and implemented data engineering solutions for Fortune 500 companies, including Disneyland Hong Kong and Philip Morris. He was invited to participate in NASA’s 2021 International Space Apps Challenge as a speaker and judge.
Expertise
PREVIOUSLY AT

