
PageSpeed Insights Best Practices: Acing Google’s Assessment
Page speed is an important ranking attribute for search engines, making performance optimization a prerequisite for successful sites. Here’s how Google PageSpeed Insights can help identify and rectify performance issues.
Page speed is an important ranking attribute for search engines, making performance optimization a prerequisite for successful sites. Here’s how Google PageSpeed Insights can help identify and rectify performance issues.

Timofey is a CTO and veteran full-stack engineer with over 18 years of experience developing new products and sustaining existing ones. He holds an Engineer’s Degree in Robotics and an MBA.
Expertise
If you’re a business owner, you’re interested in getting better search rankings for your website. If you’re a developer, you’ll need to cater to the client’s needs and create a site capable of ranking well. Google considers hundreds of characteristics when it determines the order of websites in its Search Engine Ranking Page (SERP).
Page speed was officially cited as an important ranking attribute in mid-2018. In this article, we will explain performance scores that business owners should pay attention to: PageSpeed Insights. We will be going deeper into some technical details that will help software developers make page speed optimizations, especially in complicated cases, like those related to single-page applications, relevant to React websites and more.
Why Acing Google’s PageSpeed Insights Test Matters
When Google introduced PageSpeed Tools in 2010, most website owners became acquainted with it. Those who don’t know how to use PageSpeed Insights need only open the tool to check their sites.
The service yields a page speed report that provides details on how a website performs both on desktop and mobile browsers. It’s easy to miss the fact that you can switch between them using the Mobile and Desktop tabs at the top of the PageSpeed Insights analysis:

Because mobile devices are compact and aim to preserve battery life, their web browsers tend to exhibit lower performance than devices running desktop operating systems, so expect the desktop score to be higher.
Big tech companies won’t score in the red in any area, but smaller sites running on tighter budgets may. Business owners can also run PageSpeed Insights on their competitors’ sites and compare the results with their own to see if they need to invest in improving performance. In this way, a page speed test can be a valuable component of a competitive analysis.
What Score Is Sufficient to Pass the PageSpeed Assessment?
PageSpeed uses metrics from Core Web Vitals to provide a pass/fail assessment.
This tool has three scores:
-
PageSpeed prominently displays the Performance score in a colored circle in the Diagnose Performance Issues section. It’s calculated using PageSpeed’s built-in virtual machines with characteristics matching the average mobile or desktop device. Please bear in mind that this value is for page loading and for PageSpeed’s virtual machine, and is not considered by the Google Search engine.
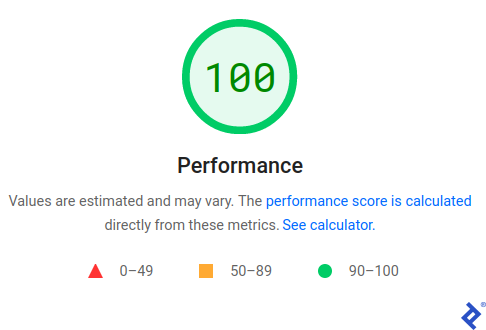
This figure is useful when developers implement changes to a website, as it allows them to check the effect of the changes on performance. However, Google’s search engine considers only the detailed scores.
-
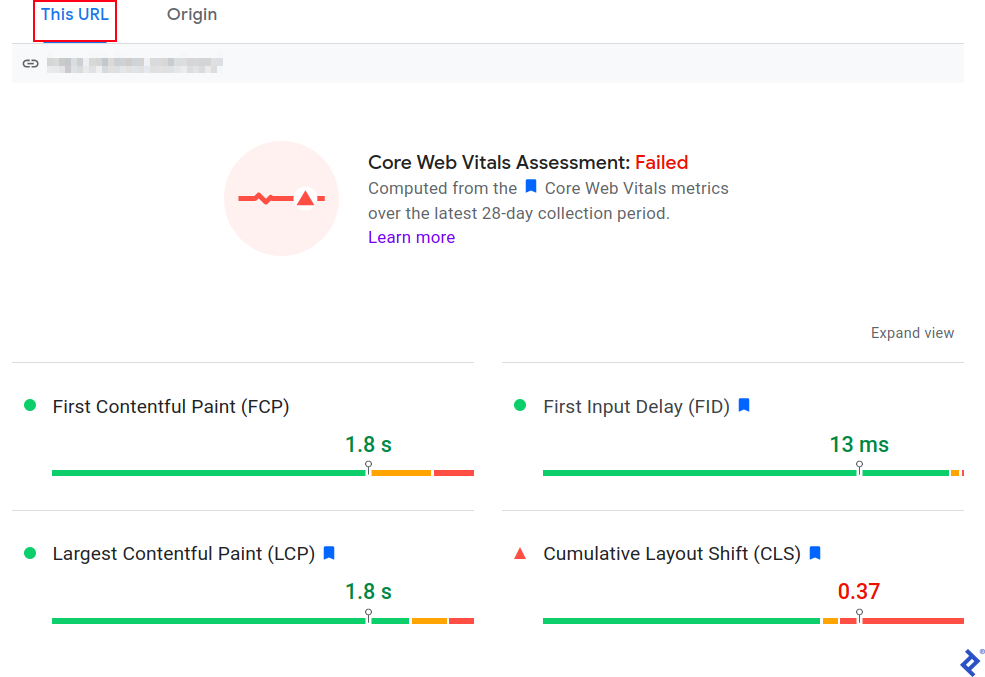
Detailed scores for a specific page—and for those that PageSpeed considers similar to the page analyzed—are calculated from statistics that Chrome browsers collect on real computers and send to Google. This means performance on Firefox, Safari, and other non-Chromium browsers is not taken into account.
-
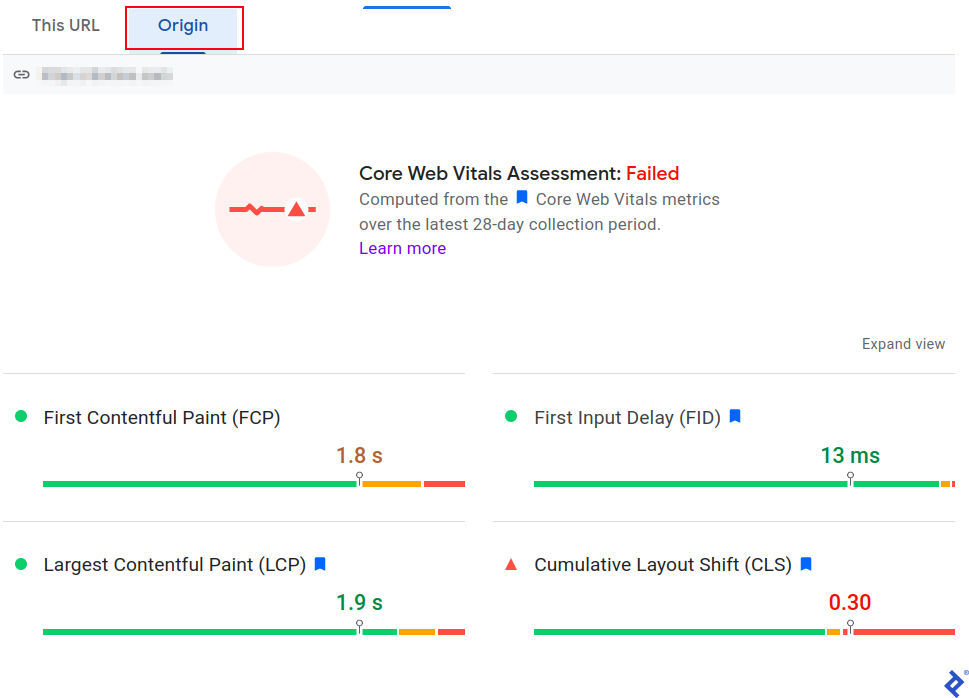
The summary for all pages of the website is obtained the same way as the single-page score. To access it, select the Origin tab instead of the This URL tab. The URL listed under the tabs bar will be different, as Origin will display the main page of the site (domain only).


Google constantly updates the list of metrics considered by PageSpeed, so the best source of what is important is the Experience / Core Web Vitals section in Google Search Console, assuming you already added your website there.
To pass the Core Web Vitals Assessment, all the scores must be green:

For the values to be green, the page needs to score at least 75% in the test, and many users need to experience equal or better values. The threshold differs for each score and it’s significantly higher for FID.
To better understand the values, click the score title:

This links to a blog post explaining the thresholds for the given category in more detail.
The data is accumulated for 28 days, and there are two other major differences from what real users might be experiencing:
- The performance of real devices and internet speeds vary, so this test produces different results from PageSpeed’s virtual machine results.
- Detailed ratings are calculated during the entire page life, taking the worst values from each five-second interval the page is open.
If many of a site’s users live in regions with slow internet access and use outdated or underperforming devices, the difference can be surprising. This isn’t one of PageSpeed Insights’ improvement recommendations. At first glance, it’s not obvious how to deal with this issue, but we will try to explain later.
Improving Scores Using PageSpeed Insights Recommendations
The main part of the rating comes from how most users open the page. Despite the fact that not all users visit a website for a long period of time, and most visit a website occasionally, all users are considered in the ratings, so improving page load speeds, which impact everyone, is a good place to start.
We can find recommendations in the Opportunities section below the assessment results.

We can expand each item and get detailed recommendations for improvements. There is a lot of information, but here are the most basic and important tips:
- Improve server response speed. For example, if you are using shared hosting, upgrade your plan or migrate to a virtual private server (VPS) or even a dedicated server. Also, not all hosts are equal. Try choosing reliable hosting with good hardware and uptime guarantees.
- Lower the volume of traffic required to open your site. To achieve this, you can replace images with optimized ones: change their format, adjust resolution and compression, replace animated images with static ones if needed, etc. Popular content management systems have plug-ins that make this process straightforward.
- Cache more data. The simplest way to do this is to use a content delivery network (CDN) like Cloudflare for static content (images, styles, scripts, pages that do not change). You can configure caching rules to optimize performance.
Now let’s have a look at more complicated factors, where an experienced programmer can help.
How to Debug Scores During Page Lifetime
As mentioned, Google Search Console considers average scores obtained from Chromium-based browsers for the last 28 days and also includes values for the entire lifetime of the page.
The inability to see what happens during the page’s lifetime is a problem. PageSpeed’s virtual machine can’t account for how the page performs once it’s loaded and users are interacting with it, which means site developers won’t have access to recommendations for improvements.
The solution is to include the Google Chrome Web Vitals library in the developer version of a site project to see what’s happening while a user interacts with the page.
Various options on how to include this library are in its README.md file on GitHub. The simplest way is to add the following script. It is tweaked to display values over the page lifetime in the main template’s <head>:
<script>
    (function() {
        var script = document.createElement('script');
        script.src = 'https://unpkg.com/web-vitals/dist/web-vitals.iife.js';
        script.onload = function() {
            // When loading `web-vitals` using a classic script, all the public
            // methods can be found on the `webVitals` global namespace.
            webVitals.getCLS(console.log, true); // CLS supported only in Chromium.
            webVitals.getLCP(console.log, true); // LCP supported only in Chromium.
            webVitals.getFID(console.log, true);
            webVitals.getFCP(console.log, true);
            webVitals.getTTFB(console.log, true);
        }
        document.head.appendChild(script);
    }())
</script>
Note that Cumulative Layout Shift (CLS) and Largest Contentful Paint (LCP) calculation is available only for Chromium-based browsers, including Chrome, Opera, Brave (disable Brave Shields to make the library work), and most other modern browsers, except Firefox, which is based on a Mozilla engine, and Apple’s Safari browser.
After adding the script and reloading the page, open the browser’s developer tools and switch to the Console tab.
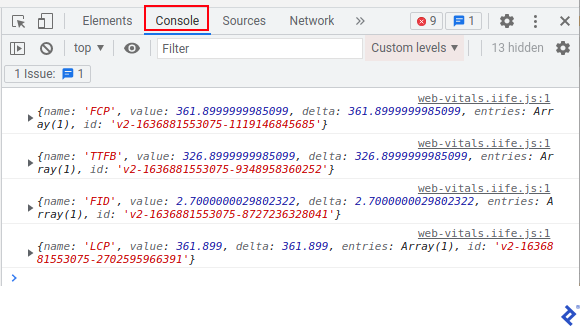
To see how those values are calculated for the mobile version, switch to the mobile device using the Device toolbar. To access it, click the Toggle Device Toolbar button in your browser’s Developer tools.

This will help pinpoint problems. Expanding the row in the console will show details on what triggered the score change.
Most of the time, the automatic advice for other scores is sufficient to get an idea on how to improve them. However, CLS changes after the page is loaded with user interactions, and there simply may not be any recommendations, especially for single-page applications. You may see a perfect 100 score in the Diagnose Performance Issues section, even as your page fails to pass the assessment for factors considered by the search engine.
For those of us struggling with CLS, this will be helpful. Expand the log record, then entries, specific entry, sources, specific source, and compare currentRect with previousRect:

Now that we can see what changed, we can identify some ways to fix it.
Reducing Cumulative Layout Shift
Of all the scores, CLS is the hardest to grasp, but it’s crucial for user experience. Layout shift occurs when an element is added to the document object model (DOM) or the size or position of an existing element is changed. It causes elements below that element to shift, and the user feels like they can’t control what’s going on, causing them to leave the website.
It’s relatively easy to handle this on a simple HTML page. Set width and height attributes for images so the text below them is not shifted while they load. This will likely solve the problem.
If your page is dynamic and users work with it like with an application, consider the following steps to address CLS issues:
- Set the page to show content 500 milliseconds after the user clicks a button or link without causing CLS to trigger.
- Change parameters that do not cause other DOM elements to shift: background, color, etc.
- Make sure other elements will not shift when changing an element’s size or position.
More detailed recommendations are available at the Google Developers Optimize CLS page.
How 500 Milliseconds Can Reduce CLS
To illustrate how to use the 500-millisecond threshold, we will use an example involving an image upload.
Normally when a user uploads a file, the script adds an <img> element to DOM, and then the client browser downloads the image from the server. Fetching an image from a server can take more than 500 milliseconds and may cause a layout shift.
But there is a way to get the image faster as it’s already on the client computer, and thus create the <img> element before the 500-millisecond deadline is up.
Here is a universal example on pure ECMAScript without libraries that will work on most modern browsers:
<!DOCTYPE html>
<html>
<head></head>
<body>
    <input type="file" id="input">
    <img id="image">
<script>
document.getElementById('input').addEventListener('change', function() {
    var imageInput = document.getElementById('input');
    if (imageInput.files && imageInput.files[0]) {
        var fileReader = new FileReader();
        fileReader.onload = function (event) {
            var imageElement = document.getElementById('image');
            imageElement.setAttribute('src', event.target.result);
        }
        fileReader.readAsDataURL(imageInput.files[0]);
    }
});
</script>
</body>
</html>
As we saw earlier, fixing these kinds of issues might require mental agility. With mobile devices, especially cheap ones, and with slow mobile internet, the ’90s art of performance optimization becomes useful and old-school web programming approaches can inspire our technique. Modern browser debug tools will help with that.
Update the Google Search Console
After finding and eliminating issues, Google’s search engine may take some time to register the changes. To update the results a bit faster, let Google Search Console know that you’ve fixed the problems.
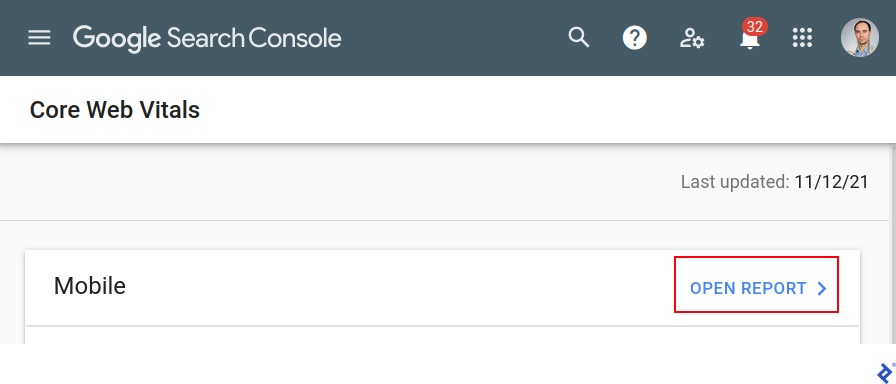
Select the page you’re working on using the Search property box in the top left corner. Then navigate to Core Web Vitals in the left hamburger menu:
Click the Open Report button on the top right of the mobile or desktop report. (If you experienced problems with both, remember to repeat the same actions for the second report later.)
Next, go to the Details section under the chart and click on the row with the failed validation warning.

Then click the See Details button for this issue.

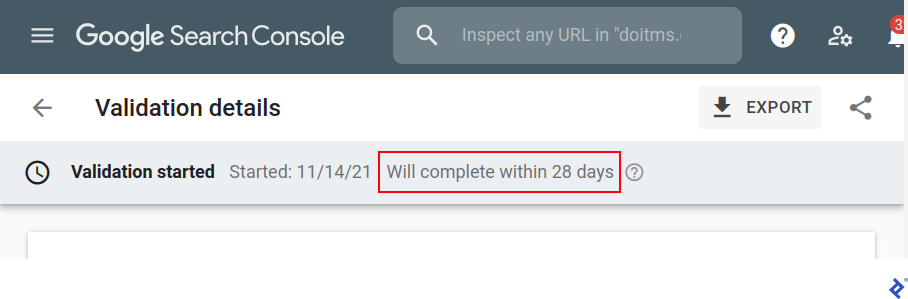
And finally click Start New Validation.

Do not expect immediate results. Validation may take up to 28 days.
Optimization Is a Continuous Struggle
SEO optimization is a continuous process, and the same is true of performance optimization. As your audience grows, servers receive more requests and responses get slower. Increasing demand usually means new features are added to your site, and they may affect performance.
When it comes to the cost/benefit aspect of performance optimization, it is necessary to strike the right balance. Developers don’t need to achieve the best values on all sites, all the time. Concentrate on what causes the most significant performance problems; you’ll get results faster and with less effort. Major corporations can afford to invest a lot of resources and ace all the scores, but this is not the case for small and midsize businesses. In reality, a small business most likely only needs to match or surpass the performance of their competitors, not industry heavyweights like Amazon.
Business owners should understand why site optimization is critical, what aspects of the work are most important, and which skills to seek out in the people they hire to do it. Developers, for their part, should keep performance in mind at all times, helping their clients create sites that not only feel fast for end users, but also score well in PageSpeed Insights.
Further Reading on the Toptal Blog:
Understanding the basics
Page speed is the speed at which the page loads for the end user in their web browser.
Page speed is important because nobody likes to wait. If your website is slow, your potential clients could go to your competitor’s faster website.
If your page is fully loaded and responsive to user actions within one second, your site is fast. But Google’s search engine uses four core page speed scores, all of which affect rankings. Google PageSpeed optimization can help improve website performance.
PageSpeed Insights measures First Contentful Paint (FCP), First Input Delay (FID), Largest Contentful Paint (LCP), and Cumulative Layout Shift (CLS).
Google PageSpeed tools is a collection of resources for optimizing website performance. One of these tools, PageSpeed Insights, helps webmasters validate and improve page loading speed on their websites, thus improving the user experience and the chances of their page ranking on search engines.
Lisbon, Portugal
Member since March 23, 2021
About the author
Timofey is a CTO and veteran full-stack engineer with over 18 years of experience developing new products and sustaining existing ones. He holds an Engineer’s Degree in Robotics and an MBA.