
Using Agile Spreadsheets for Discovery Estimation
Estimation tools abound but none is as flexible and accessible as the humble Agile spreadsheet. Here’s why you should consider customizing your own to calculate discovery estimates.

Estimation tools abound but none is as flexible and accessible as the humble Agile spreadsheet. Here’s why you should consider customizing your own to calculate discovery estimates.

Mauricio is a seasoned project manager who specializes in software and infrastructure projects. During his 30-year career, he has led complex IT projects at multinational companies including IBM and Kyndryl.
Expertise
Previously At

This article includes a preformatted spreadsheet to help you develop Agile discovery estimations. It also includes information to help you follow along with the featured example.You can make an editable copy (File>Make a copy or File>Download) from the template here.
Clients often ask me to provide Agile estimates before I have a team in place or know the MVP requirements. At this early stage, I don’t have access to traditional metrics like velocity, number of sprints, or team cost to calculate those estimates. But clients want answers. Can they launch a hypothetical product in two months or six? Will it be feasible for their (usually low) budget?
Enter the Agile spreadsheet.
Spreadsheets are a fitting—but often overlooked—choice for an Agile mindset. They’re low-tech, high-touch tools that encourage collaboration. That said, your customer probably doesn’t care whether your tools are “Agile approved” as long as the product’s cost and quality meet their requirements. The true value of spreadsheets lies in their accessibility to project managers and stakeholders of all experience levels.
Many specialized project management tools have learning curves that are too steep for inexperienced users on quick-moving projects. So the easier it is for clients, product owners, and developers to update requirements and labor costs, the sooner you’ll arrive at a realistic estimate. With a preformatted spreadsheet, project managers can adjust values and parameters to demonstrate the effects of each fluctuating resource or shifting timeline.
Spreadsheets are also a great way to share knowledge with your colleagues. The spreadsheet I use originated with a Toptal colleague, and I’ve since made a copy and modified it to suit my needs. I encourage you to do so as well. In this article, I demonstrate how to deliver successful discovery estimates that empower clients and stakeholders to align on project goals and proceed with development. Here’s how to fill in the blanks and deliver an early-stage estimate you can stand behind.
Tackle the Product Vision and Roadmap First
Say your client wants to develop a dating website on a fixed budget, but the details of the product are fuzzy. Without knowing team cost and velocity, product vision is the best place to start because it requires stakeholders to agree on a design target and promotes transparency across the team.
I like the Scrum.org product vision format for its intuitive narrative style. Here’s what it looks like:

Once the product vision is set, you can add the Product Roadmap in a new spreadsheet tab to give the client a sense of the long-term project schedule. The roadmap should list goals, key features, and deadlines for each product roadmap version.

Roadmap versions are planned, consumer- or client-facing editions of a product that guide its market trajectory. The first roadmap version is the product that you can debut on the market. Subsequent roadmap versions represent market releases with compelling new features that align with the product vision.
To use Microsoft as an example: Windows 8 was likely a roadmap version. Windows 10 was another roadmap version that featured many new and desirable features.
Once the product vision and roadmap are complete, it’s time to ask the client to commit to an MVP.
Negotiate MVP Features With the Triple Constraint Chart
This is the moment to shape your client’s expectations around time and expense using the Triple Constraint chart:

In a Waterfall approach, fixed features dictate time and cost, and development proceeds according to a detailed project plan. Conversely, Agile’s fixed costs and schedule determine the product’s features, and these features are constantly reprioritized based on the more flexible project vision.
Many Agile teams also consider value when making tradeoffs between features, schedule, and budget. Rather than measuring progress solely by the amount of functionality delivered, they prioritize the work most likely to support business objectives or solve meaningful user problems. This perspective helps stakeholders focus MVP discussions on outcomes and impact, not just feature counts.
The Triple Constraint chart shows the client that including all the desired features in the first release will increase development time and balloon costs. Instead, work with the client to select only “must-have” features for an MVP and table any remaining features for future releases.
Spreadsheets make it easy to group and reassign features to different versions, releases, and priorities based on the client’s shifting needs, and they instantly display the costs of these changes.
While you’re identifying MVP features, ask your subject matter experts (SMEs) for help listing the project’s steps based on similar projects they’ve worked on. You’ll use these steps to create epics later. Once you have those inputs ready, you can start building an estimate.
Start With T-shirt Sizing
To begin the first backlog, ask the product owner for a detailed description of the product’s features, then assign a T-shirt size to each feature based on its level of difficulty.
T-shirt sizing will show the relative complexity and duration of each development task before you have any absolute values. As we get further into project planning, we’ll convert these relative sizes into story points and work hours.
For example, if your client wants you to develop a series of pop-ups on the dating site, that would be time-consuming but straightforward. You might characterize that task complexity as a “Small” but the effort would be a “Medium.” You could abbreviate this as “SM.” On the other hand, developing a back-end connection for a new API would be a more complex task due to all of the required documentation and tests. The skill and attention needed for this might make it a “Large” in both effort and skill level: “LL.”
Once you finish T-shirt sizing, you’ll have a sense of the relative workload and skill requirements for each future team member. A technical expert from the development team can then help you correlate your T-shirt sizing to ranges of hours and story point estimations.
Using AI to Support T-shirt Sizing
Many teams now supplement discovery estimation with AI tools trained on historical project data. Once an initial backlog has been sized, AI can help identify similar epics from previous projects, suggest reasonable ranges for development effort, and flag estimates that appear inconsistent with past work.
These capabilities are particularly useful during early discovery, when uncertainty is highest and historical benchmarks may be difficult to recall. While AI-generated estimates should never replace input from developers and other stakeholders, they can provide an additional validation layer before budgets, timelines, and contingencies are finalized.
Set Your Parameters
Now you’re ready to put your spreadsheet to work and calculate your estimate. Begin by creating a Parameters tab. This will serve as the key for your calculations, and the values you enter here will feed into the formulas used in your Backlog/User Stories and Estimate Summary by Release tabs.

Here’s everything you’ll need in your Parameters tab:
Currency. This is where you enter currency conversions. For instance, if the client’s budget is in Brazilian reals, you can enter the current conversion rate for dollars or euros.
Start Date. The expected development start date will be used to create a project timeline. In each example, our start date is October 25.
Initial Budget. The budget provides constraints that show whether or not all of the MVP features will fit within it.
T-shirt Sizing. Enter your T-shirt sizes as a table, and assign story points and a range of hours to each sizing combination. In this example, we use one to two hours for an SS and 33 to 48 hours for an LL.
Keep in mind that your sprint duration will limit your maximum T-shirt size’s hours. If the sprint is only one week, the biggest size can’t exceed 40 hours. This is why consulting a SME is so important when assigning T-shirt sizes to tasks.
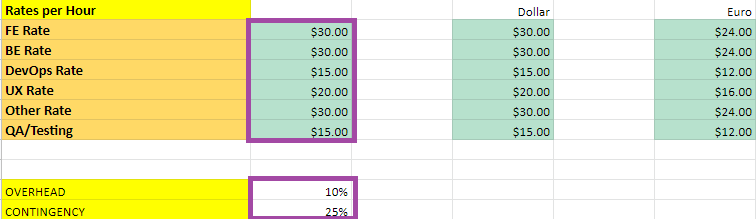
Rates per Hour. Use this table to document pay rates for each role. If your back-end developers have different rates, use the average of the two.
Overhead. Allot a percentage of the total project effort to administrative tasks such as status meetings, feedback sessions, and project revisions. Ten percent (or four hours of each participant’s workweek) is a good place to start, but overhead may be higher for more complex projects.
Contingency. This indicates the potential variance in your estimate. Starting with a contingency of 0% will show you the best-case (i.e., unlikely) budget and timeline given the values that you’ve entered into the spreadsheet. Later in our example, we’ll increase the contingency to a rough order of magnitude (ROM) variance of 50% to show the potential high end of costs and project duration. The contingency will shrink as you obtain more precise numbers.
Size Each Release With Epics
We start with a rough sizing of the full product to ensure we don’t waste the client’s time or money. Depending on how close the sizing comes to their proposed budget and deadline, the client may decide to abandon the project or invest in more detailed estimates. Because we don’t have much detail at this point, we enter the main features as epics in the Backlog/User Stories tab. Then, for each epic, we enter the number of hours that the SMEs and development leaders suggested for each development stack based on the T-shirt sizing table in the Parameters tab.
First, select the column “EPIC?” and make sure only “Epic” is selected.

Next, write out the epic description and enter the number of hours for each column of the development stack. For example, the epic “Secure Connection and Login” will take about eight hours of UI development, 40 for the back end, and so on.
Notice that in most cases, the cells in the “Point” column display “34*.” If you return to the Parameters tab, you’ll see that 34 points correspond to an hourly range between 33 and 48 hours. That number of hours is too great if our sprint duration is only one week.
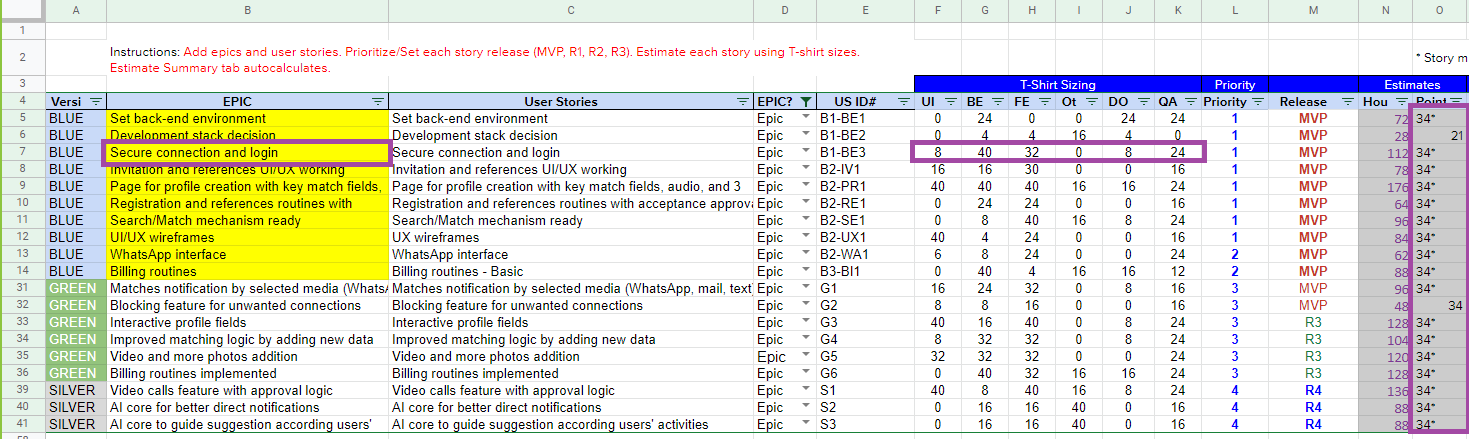
Once we have more details, these hours will need to be whittled down, or the epics must be split into more manageable stories. For the sake of time, however, we’ll ignore the Points column and continue with the rough estimate.
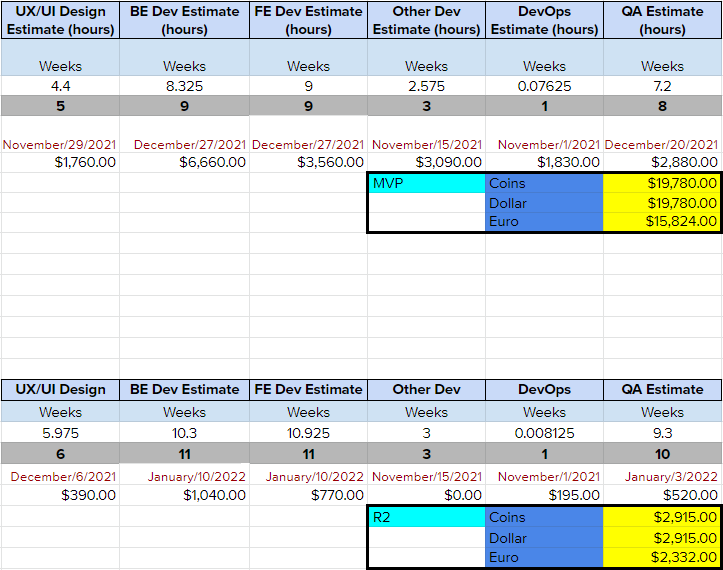
Now go to the Estimate Summary by Release tab. At the top of the spreadsheet, you’ll see the “Overhead” and “Contingency” values as defined in the Parameters tab. There is also a button you can select to show estimates by epics or user stories.
Because we have no user stories to display yet, check the button for “Epic Mode.”

You can now see the rough cost and timelines for the MVP and the less-urgent features and updates in future releases (R3 and R4). In this example, the second release (R2) is empty because the customer has requested that all MVP epics be launched in the first version.
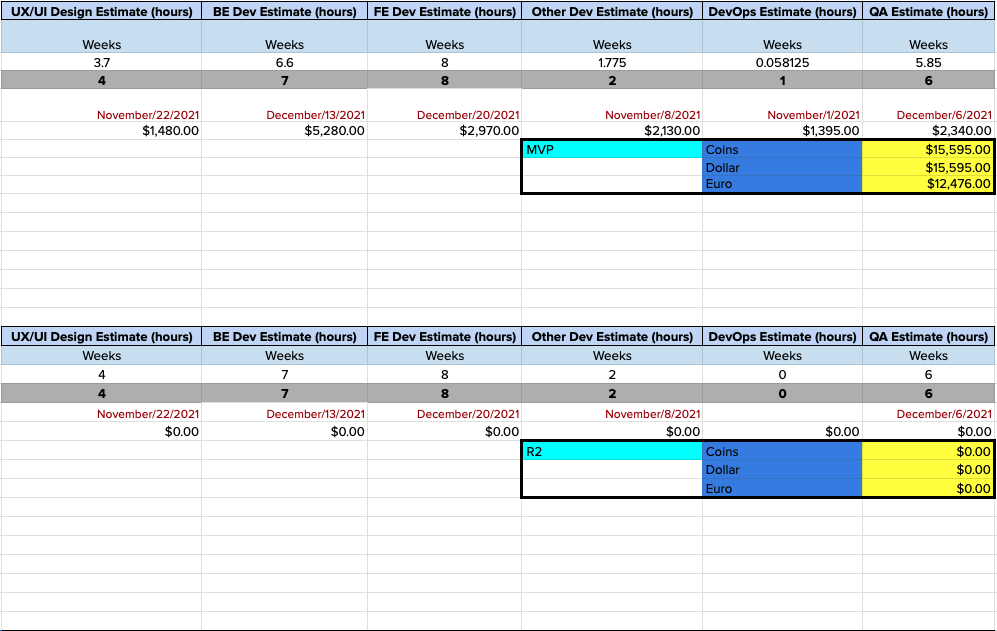
You can now see the most optimistic aggregate cost: $28,810. This figure is the sum of the cost of each release from the MVP through R4.

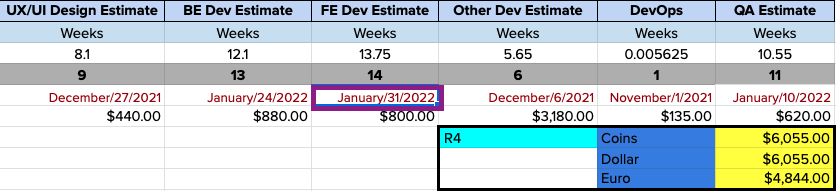
We also have an estimate of the shortest timeline for product delivery, which corresponds to the latest completion date in the R4 development stack. Project managers call these slower development stacks “critical paths” because they dictate the speed of the entire release.
In this case, the critical path is the front-end development, with a completion date of January 31.
Now it’s time to adjust the parameters to simulate the worst-case budget and longest timeline.
Adjust the Contingency to 50%
We still know relatively little about the effort and expertise requirements for the product, so we’ll add a ROM contingency of 50% in the Parameters tab. The contingency will decrease as we learn more details about the project.


Again, here’s the total project estimate at 0% contingency.

And here it is at 50% contingency.
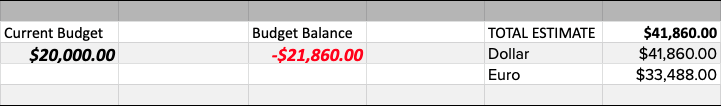
That means that the ROM estimate for the entire project is between $28,810 and $41,860. In the best and worst cases, the client’s $20,000 budget won't be enough to include all of the features on their wish list.
The full project completion date at 50% contingency now falls on March 14, six weeks later than the 0% contingency completion date.

Meanwhile, the MVP will be ready on January 10.

Instead of abandoning the project, the client requests a more detailed estimate to see if it might land closer to their target budget on a shorter timeline.
Reprioritize to Meet Deadlines
Suppose the client sets a target date of December 25 for the MVP, two months from the October 25 kickoff.
To move up the current January 10 MVP completion date, the client agreed to delay two MVP epics until the next release (R2).
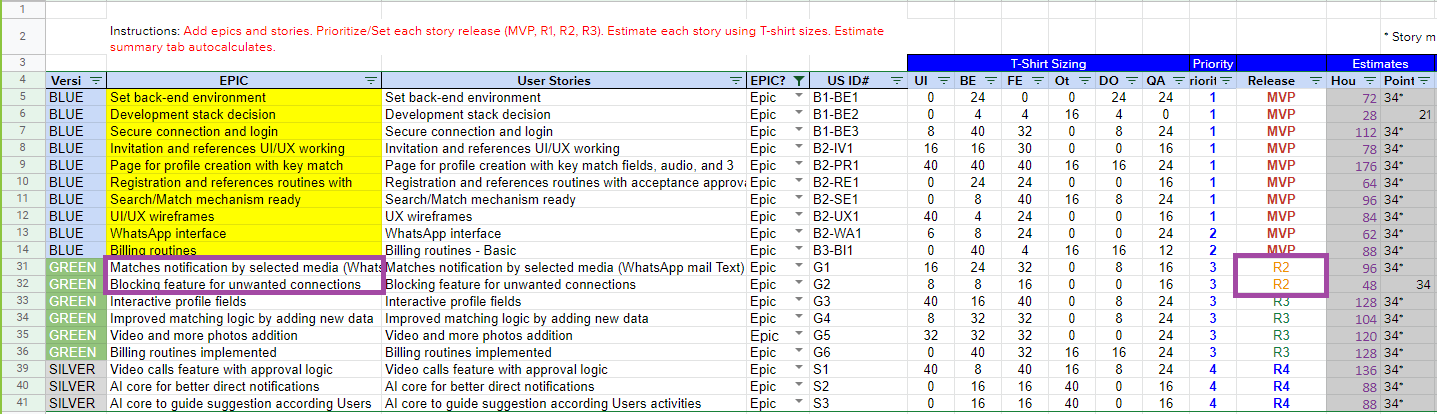
The spreadsheet calculates the cascade effect of this adjustment. In this case, the MVP timeline shortens to December 27. The front- and back-end development are the critical paths in this simulation because they will take the longest to complete.
Based on this information, you might decide to add another two developers to align the front- and back-end completion dates with the other development stacks. To do this, increase the hours from 40 to 80 in the MVP “Hours per week” row.

Both front- and back-end development stacks now finish in November, and QA becomes the new critical path (with a completion date of December 20). Note that the cost doesn’t change. That’s because the total hours of work in each stack remain the same. Instead of one developer working for two weeks (80 hours), two developers are working for one week (80 hours).
The spreadsheet also accounts for differences between full- and part-time work. Let’s suppose the UI developer will be working part time. We can change the UI “Design Hours per week” to 20 to simulate the delay in delivery.
On a full-time schedule, UX/UI will be complete on November 29.

On a part-time schedule, UX/UI will be complete on December 27.

Once again, the cost doesn’t change, but UX/UI becomes the new critical path, extending the timeline for the MVP to December 27.

You can continue this trial-and-error approach until you arrive at an acceptable critical path given your resources and the client’s deadline. Once an appropriate deadline is in place, it’s time to start fine-tuning your estimate.
Refine Your Estimate With User Stories
Because the 50% contingency estimate fell outside the client’s budget, it’s worth refining your variables so you can lower the contingency and obtain a more realistic estimate.
To do this, work with your developers and SMEs to break your epics into detailed user stories. Stories are better defined than epics, so we can size them more accurately.
Next, adjust the values in your Parameters tab based on any new information. For example, your SMEs and development team may have a more accurate set of rates for each role and may also want to adjust T-shirt sizes and points assignments. With those new parameters in place, you can have greater confidence in your calculations and lower the contingency to 25%.
Let’s look at how we broke the epics into smaller and more detailed user stories:

Unlike the epic estimation that required manually entering the estimated hours for each stack, the story estimation uses T-shirt sizing as a shortcut. This is where the T-shirt sizes you entered in the Parameters tab come in handy as a story point calculator.
Under “T-shirt Sizing” in the Backlog/User Stories tab, enter the size combination your developers and SMEs assigned to their stacks for each story. Then the spreadsheet formula, working from the agile story point estimations, will auto-populate the corresponding hours from the Parameters tab. Remember that the largest size, LL, must remain below 34 points to ensure it can be completed within your agreed-upon sprint duration. Any stories that still rate 34 points or higher will need to be subdivided.
Once you’ve made sure that fewer than 34 points are assigned to all stories, uncheck the “Epic Mode” button on the Estimate Summary by Release tab in order to view only “Story.”

Now you’ll see a new set of numbers:

After detailing all the tasks and sticking to the MVP features only, the timeline and cost now match the client’s requirements. Since the balance is well within their budget, the client decides to proceed with the MVP and test it before committing to additional releases.

Using Agile Spreadsheets in Remote-first Environments
Cloud-based spreadsheet platforms make it easy for distributed teams to collaborate on discovery estimates. Product owners, developers, SMEs, and stakeholders can review assumptions and provide input from different locations and time zones while working from the same source of truth. Also, built-in version history creates a record of how estimates change throughout discovery, so when priorities shift or new requirements emerge, earlier decisions are easy to reference.
Make It Yours
Spreadsheets are simple to use, and with some basic knowledge of formulas (no macros necessary), you can adapt them to almost any agile project estimation need. If your Excel knowledge is rusty, online courses on Udemy and edX will help you brush up on these skills.
This article covered discovery estimation, but you can use the same spreadsheet to produce burnup/burndown charts, adjust timelines, and calculate estimates based on velocity and sprints for later stages. I use my customized spreadsheets as an agile estimation template to complement applications, such as Jira, Asana, and Trello, and maintain that they’re a powerful tool in my project management kit. I hope they prove just as useful and versatile to you.
Do you prefer custom spreadsheets to off-the-shelf project management tools? Tell us why or why not in the comments.
Further Reading on the Toptal Blog:
- Software Costs Estimation in Agile Project Management
- Advanced Financial Modeling Best Practices: Hacks for Intelligent, Error-free Modeling
- How to Prepare a Cash Flow Statement: Building a Model That Actually Balances
- Creating a Narrative from Numbers
- Financial Clarity at Last: How to Reboot Your Chart of Accounts Structure in 7 Steps
Understanding the basics
Agile estimation techniques determine the cost and schedule of a project based on its features.
Project discovery is the planning phase in Agile estimation. In discovery, project managers work with stakeholders to define the product vision, requirements, budget, and timeline.
The purpose of discovery in Agile is to set goals, align stakeholders, and gather the Agile epics and stories that will inform each sprint.
Agile estimation is useful for projects that don’t have fixed outcomes and for products that require iterative development. In Agile estimation, project managers can use relative sizing of development tasks to provide a rough picture of the total project size.

Mauricio Silva
Campinas - State of São Paulo, Brazil
Member since October 29, 2020
About the author
Mauricio is a seasoned project manager who specializes in software and infrastructure projects. During his 30-year career, he has led complex IT projects at multinational companies including IBM and Kyndryl.
Expertise
PREVIOUSLY AT