
Using Microsoft Clarity to Better Understand Users
Microsoft Clarity enables you to analyze how users interact with your website. What are Clarity’s unique features, and how can they improve your website’s user experience?

Microsoft Clarity enables you to analyze how users interact with your website. What are Clarity’s unique features, and how can they improve your website’s user experience?

Ahmed is a software engineer who specializes in .NET and Azure, and builds innovative solutions for companies such as Amazon and Microsoft.
Expertise
Previously At

Microsoft Clarity enables you to analyze how users interact with your website. It complements Google Analytics and provides user insights through tools such as heatmaps and session replays. What are Clarity’s unique features, and how can they improve your website’s user experience?
These days, analytics abound. If you need a program to gather detailed data about your website, you’ll find no shortage of options. However, many analytics programs have steep learning curves and yield metrics that are difficult to translate into design decisions.
Microsoft Clarity is a behavioral analytics tool that turns user interactions into visual insights. Clarity offers a variety of dashboards, heatmaps, and session replays that reveal which parts of your site get the most—and least—engagement. It also has features such as rage clicks and dead clicks that make it easy to analyze issues that cause confusion and poor performance.
What Are Clarity’s Most Powerful Features?
As a software developer on the team that built Clarity, I’ve seen firsthand how it can help designers better understand their users. Not only are Clarity’s features robust, they’re uncomplicated and uncluttered. It all starts with the Clarity dashboard.
Clarity Dashboard: High-level Insights and Nuanced Filters
Clarity’s main dashboard displays session metrics, traffic sources, and charts that indicate user frustration. It also provides advanced filters that allow you to search according to more nuanced criteria such as cursor movements, operating systems, and resized pages.
Furthermore, Clarity gives you the option to create unlimited custom tags—tailor-made filters that accelerate your ability to find specific sessions for review. Custom tags are especially useful when you need to:
- Identify conversions such as form submissions and purchases
- Find heatmaps and session recordings for specific users
- Track when particular users are logged in and what type of pages they’re viewing
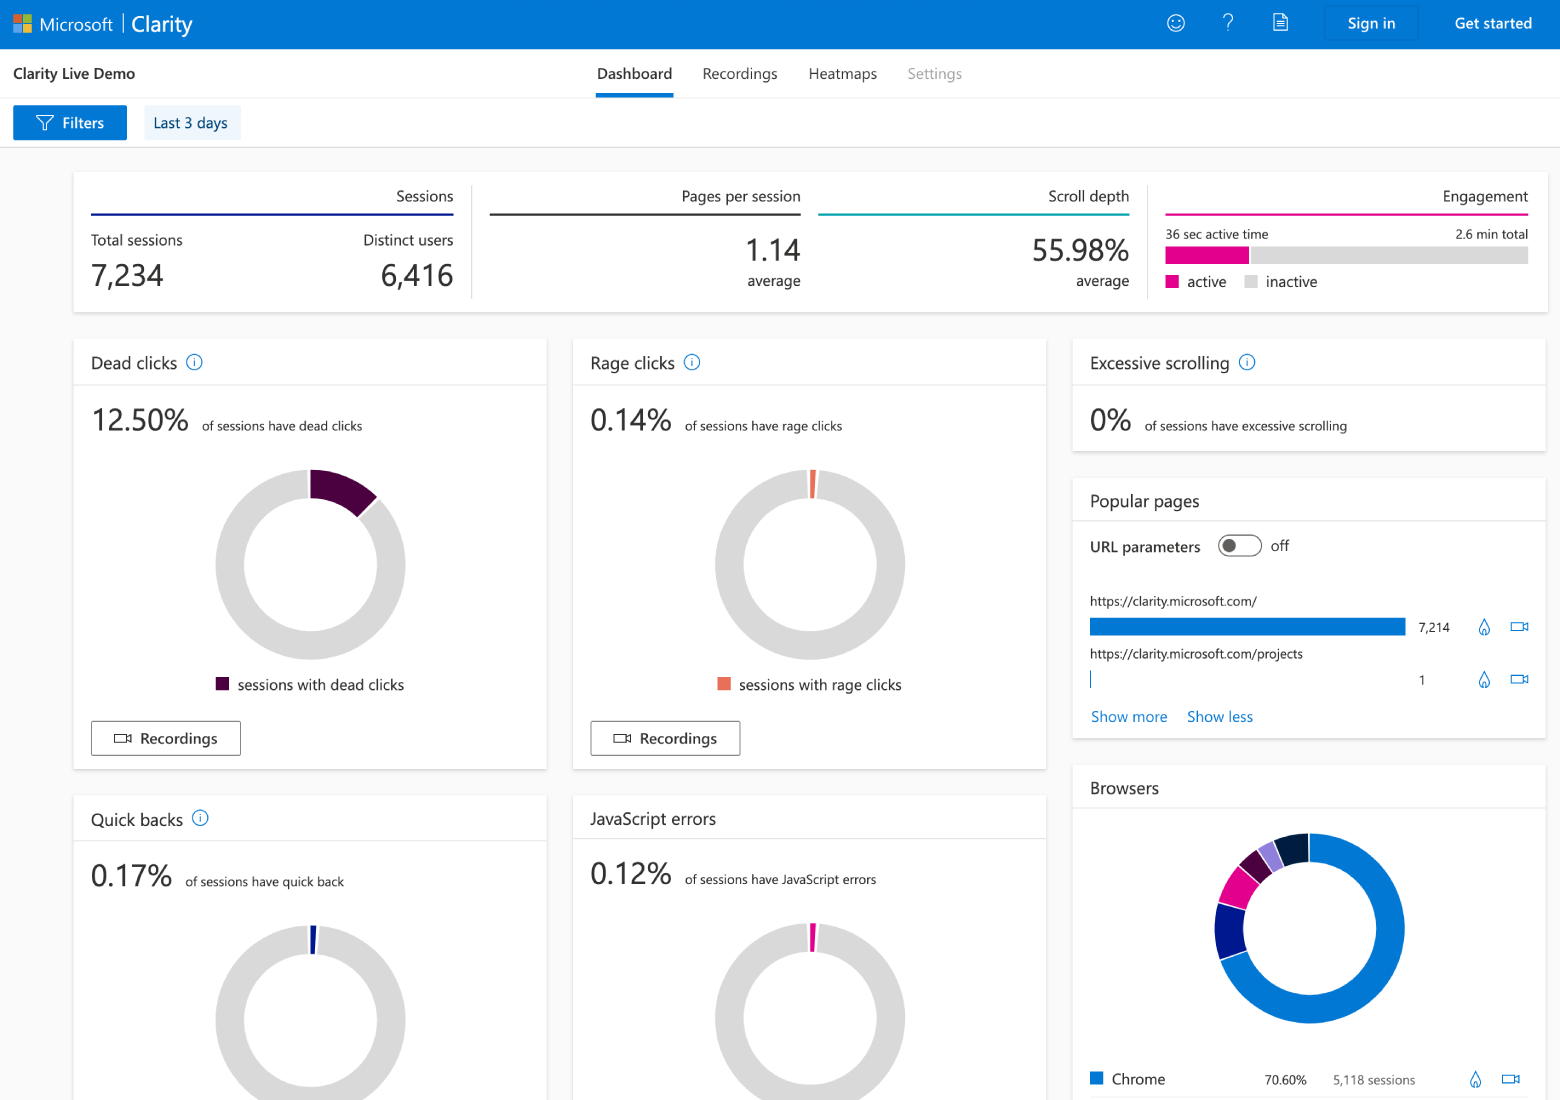
Frustration Metrics: Identify and Eliminate Usability Issues
Left unchecked, usability issues lead to website abandonment. Fortunately, Clarity’s frustration metrics isolate interactions that suggest UX design flaws:
- Rage clicks: A user rapidly clicks in the same area several times. Rage clicks may signal insufficient target sizes or misleading visual design.
- Dead clicks: A user clicks on an element but nothing happens. Dead clicks may be the result of broken links.
- Excessive scrolling: A user hastily scrolls up and down on a page more frequently than the average user. Excessive scrolling may indicate poor discoverability or irrelevant content.
- Quick backs: A user visits a page and quickly goes back to the previous one. Quick backs may be caused by misleading icons or content descriptions.
Session Replays: See How Users Really Experience Your Site
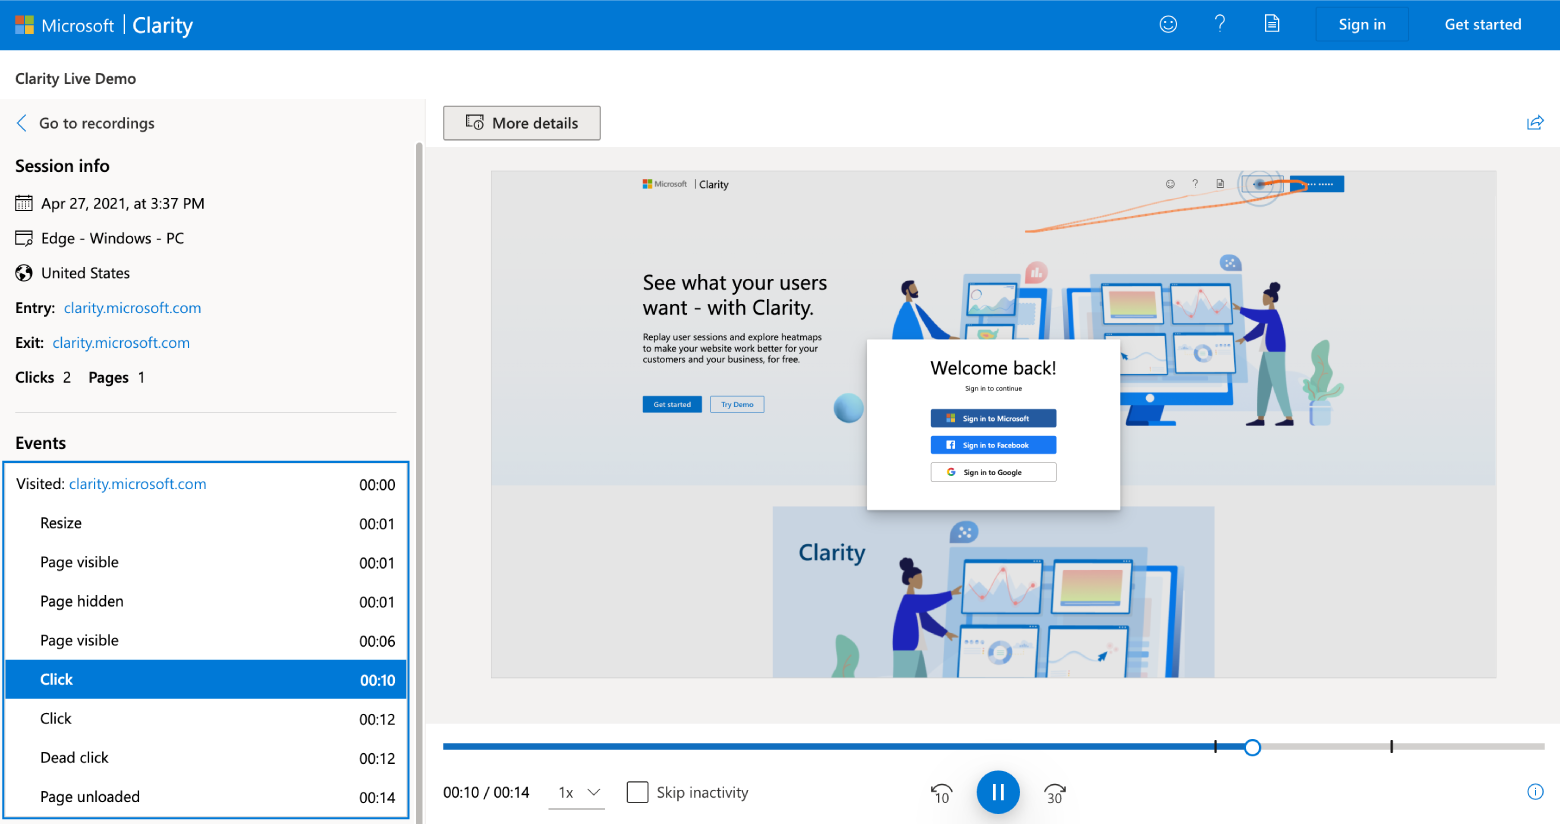
Clarity’s session recordings allow you to watch replays of user visits. In addition to tracking cursor movements and clicks, replays include information such as entry and exit URLs, session duration, date, and device.
Clarity also provides a “Skip inactivity” checkbox that enables you to skip over extended stretches when users aren’t doing anything — a huge time-saver when viewing multiple sessions.
Above each video, the “More details” option reveals a timeline of users’ actions. Each action is clickable and linked to its place in the recording.
Heatmaps: Visualize Your Most Appealing Content
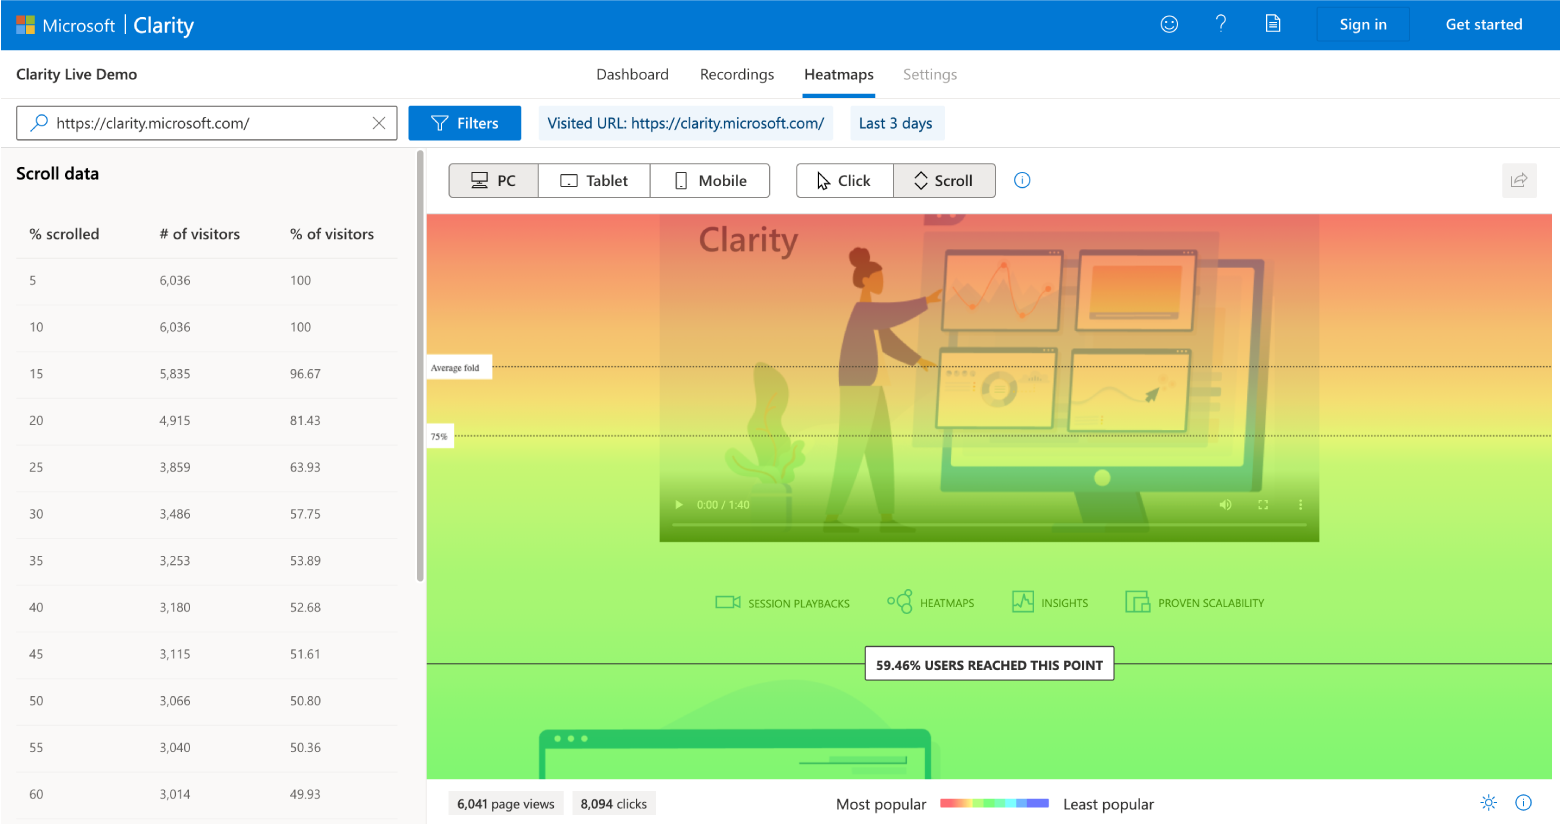
Heatmaps are an easy way to visualize aggregated sessions and understand how users interact with a page. Warmer colors indicate more popular areas, and cooler colors signal less popular areas. There are three types of heatmaps available in Clarity:
- Click heatmaps show where users clicked on a desktop page.
- Tap heatmaps show where users tapped on mobile and tablet pages.
- Scroll heatmaps show how far users scrolled down a page.
Click and tap heatmaps can help identify appealing content and act as baselines for comparing design iterations. They can also uncover elements that users mistakenly think are interactive—such as an illustration that includes a “Play” button.
Using the scroll heatmap, you can hover over a section of a page to view the percentage of users who reached that point. Scroll heatmaps also identify an average fold—the area at the top of a page that users see before scrolling.
Note: Dashboard filters can also be applied to recordings and heatmaps.
How to Fine-tune Clarity’s Settings
Microsoft Clarity makes it simple to start new projects, mask data, and block specific IP addresses. It also integrates with Google Analytics to provide a more detailed picture of your website’s strengths and weaknesses.
Clarity Setup: Compatible With Popular Third-party Platforms
After signing into Clarity, create a new project by providing basic information about your website, such as its name and URL. It’s worth noting that Clarity’s functionality is available for all websites, regardless of traffic volume.
After you create a project, Clarity will provide a tracking code and setup instructions for your site. Copy and paste the code into the <head> HTML section of your page, or install it via Clarity’s WordPress plugin or Google Tag Manager template. Clarity also provides setup instructions for multiple third-party platforms.
Masking: Protect Your Website’s Data
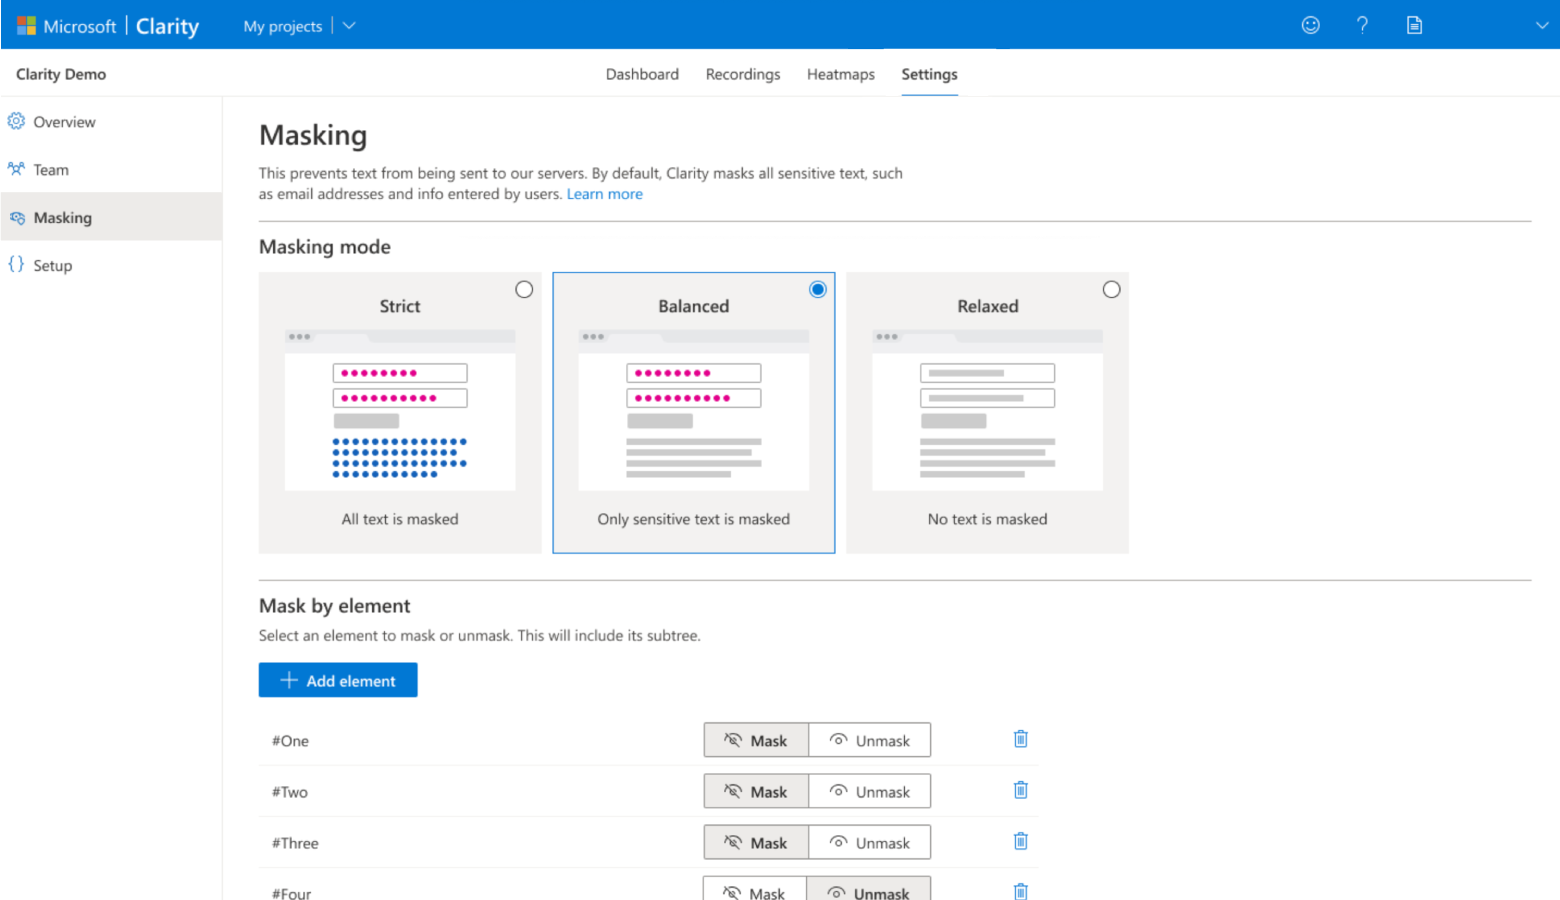
There are three masking modes that prevent Clarity from capturing your website’s sensitive text:
- Strict: All text is masked.
- Balanced: Only sensitive text is masked. Sensitive text includes input fields, numbers, and email addresses. (This is Clarity’s default setting.)
- Relaxed: No text is masked.
In addition to Clarity’s masking modes, you can also mask specific content, such as images.
Note: It’s not advisable to use Clarity on sites that include sensitive data, such as medical records or financial information.
IP Blocking: Exclude Certain Visitors From Tracking
IP blocking prevents specific IP addresses from being recorded by Clarity. For example, you may want to block site visits from your team members. Traffic coming from addresses on the block list won’t appear on your project’s dashboard.
Google Analytics 4 (GA4): Link to Clarity Recordings
Although there are similarities between the platforms, Google Analytics 4 (GA4) and Clarity aren’t competitors; they complement each other. GA4 measures traffic, conversions, and e-commerce performance. Clarity captures some of the same data, but it also lets you see how users actually navigate and engage with your site through session recordings and heatmaps.
For instance, if you notice an underperforming page in GA4, you can use Clarity to watch user sessions and identify the page’s design flaws. Used together, these tools can help explain why users behave the way they do and reveal opportunities for improvement.
AI-powered Insights: Analyze Recordings More Efficiently
Microsoft has also introduced AI-powered features that help users analyze session recordings more efficiently. By using Copilot in Clarity, you can generate summaries of session recordings, identify notable behaviors, and highlight patterns that appear across multiple user sessions.
Instead of reviewing recordings one by one, you can use the summaries to quickly identify potential usability issues, such as confusing navigation paths or points where users appear to struggle. This can be especially helpful on high-traffic websites where manually reviewing large numbers of recordings may not be practical.
Like heatmaps and session recordings, AI-generated insights are most useful as a starting point for investigation rather than a replacement for direct observation.
Microsoft Clarity Yields Valuable User Insights
Designers pour countless hours into user research, information architecture, prototyping, and testing. Behavioral analytics are vital to this ongoing process of discovery and refinement because they reveal which design choices are effective and which are not. With its intuitive features and graphic simplicity, Microsoft Clarity helps designers turn complex user behaviors into data-backed design decisions.
Further Reading on the Toptal Blog:
Understanding the basics
Microsoft Clarity is a behavioral analytics tool that turns user data into visual insights and shows which parts of your website get the most engagement. It offers dashboards, heatmaps, session replays, and features such as rage clicks and dead clicks that make it easy to analyze issues that frustrate users.
User retention measures customers’ use of a product over a specific timeframe. It’s based on how much and how often users interact with the product. However, it can be difficult to define what constitutes “using” a product, and each company must set its own user retention goals.
Heatmaps help you visualize aggregated web sessions and reveal how users interact with a page. There are three types of heatmaps in Microsoft Clarity. Click and tap heatmaps show where users clicked on a desktop or mobile page, and scroll heatmaps show how far users scrolled down a page.

Ahmed Osman
Cairo, Cairo Governorate, Egypt
Member since December 8, 2020
About the author
Ahmed is a software engineer who specializes in .NET and Azure, and builds innovative solutions for companies such as Amazon and Microsoft.
Expertise
PREVIOUSLY AT